. 2017 Dec;13(4):429-442.
doi: 10.1007/s11302-017-9571-6. Epub 2017 Jun 14.

Modulation of the TGF-β1-induced epithelial to mesenchymal transition (EMT) mediated by P1 and P2 purine receptors in MDCK cells

Affiliations

Modulation of the TGF-β1-induced epithelial to mesenchymal transition (EMT) mediated by P1 and P2 purine receptors in MDCK cells

Mariachiara Zuccarini et al. Purinergic Signal. 2017 Dec.

Retraction in

Abstract

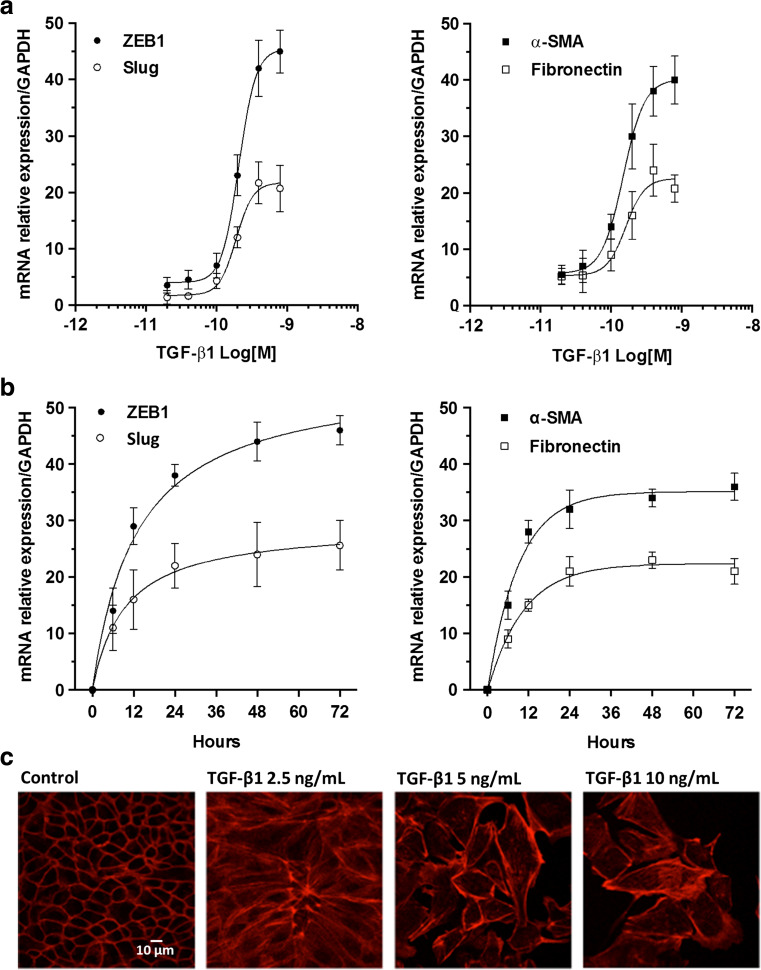
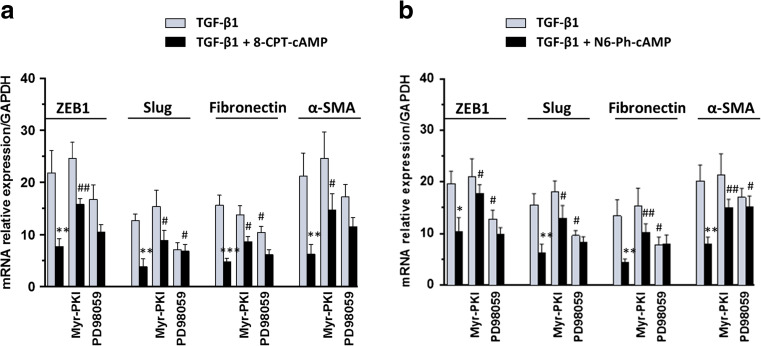
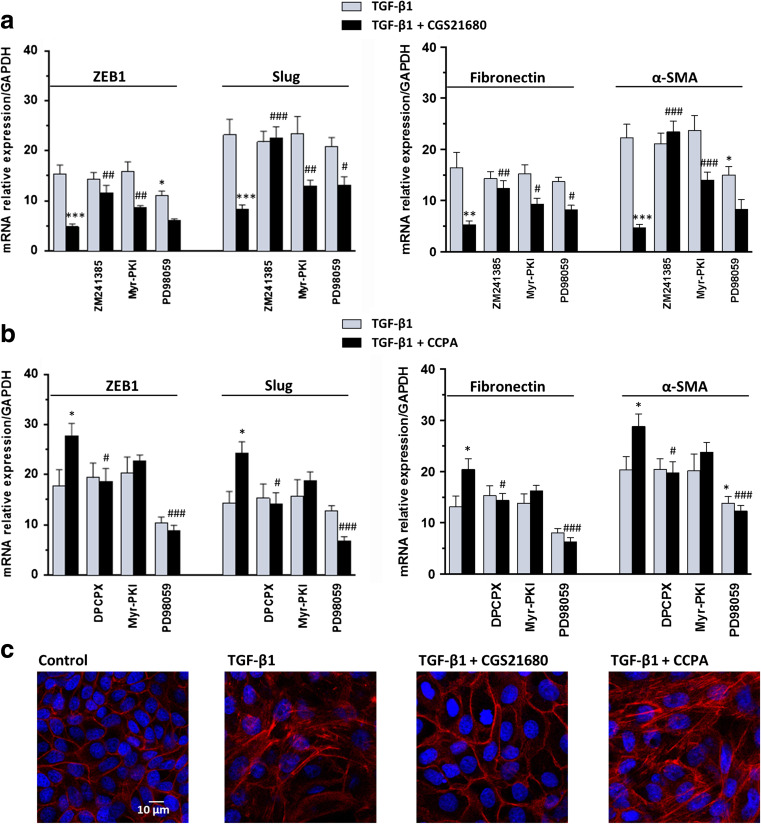
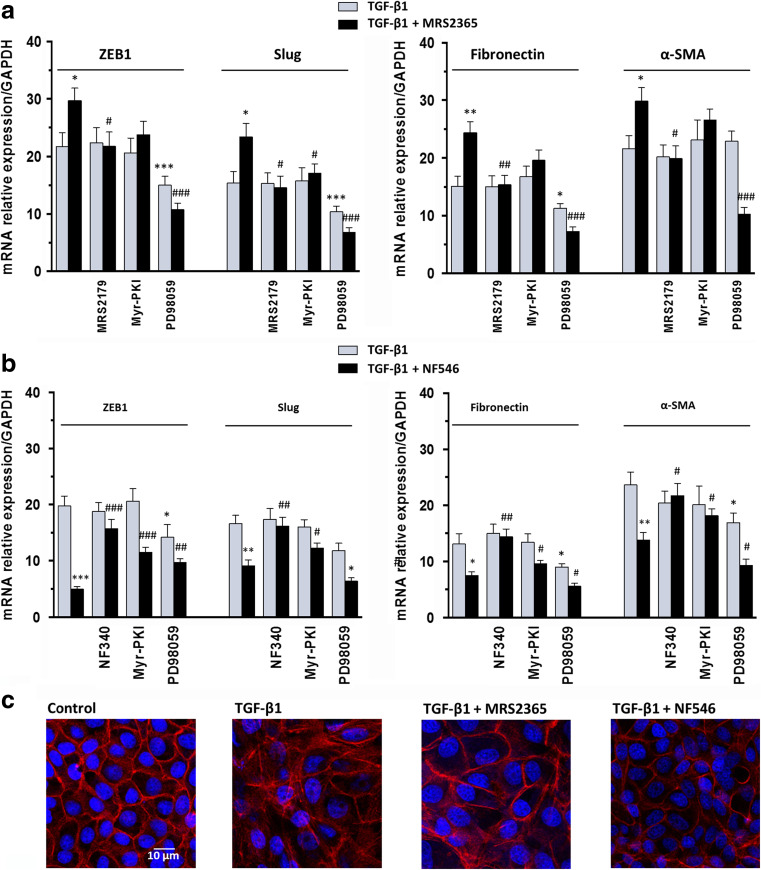
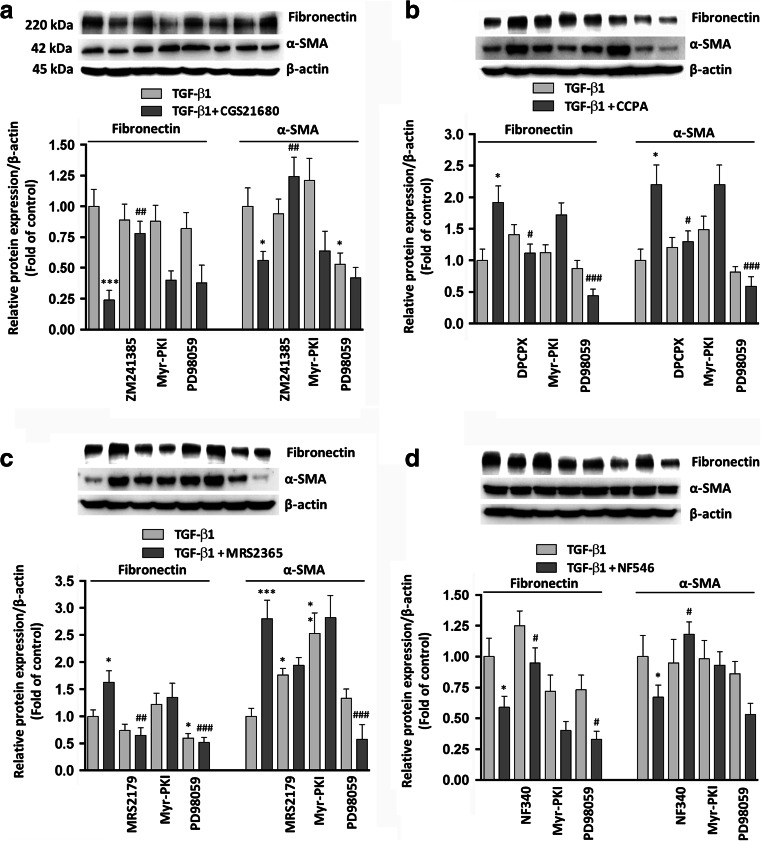
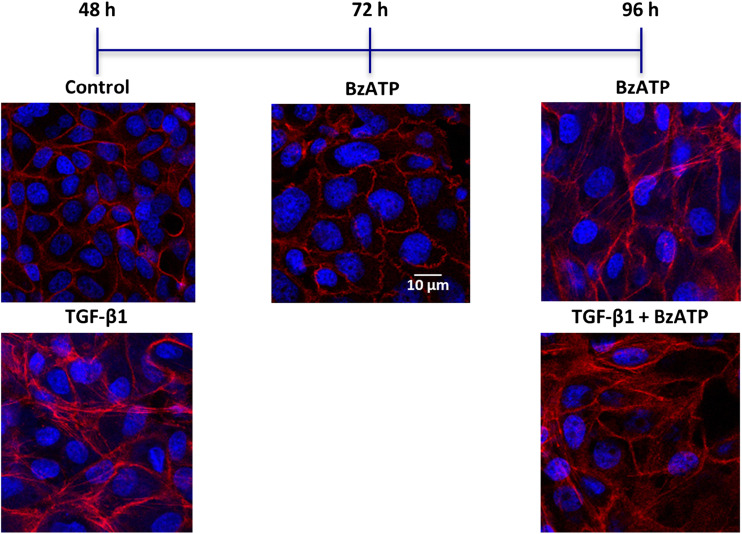
Epithelial to mesenchymal transition (EMT) occurs during embryogenesis or under pathological conditions such as hypoxia, injury, chronic inflammation, or tissue fibrosis. In renal tubular epithelial cells (MDCK), TGF-β1 induces EMT by reducing or increasing epithelial or mesenchymal marker expression, respectively. In this study, we confirmed that the cAMP analogues, 8-CPT-cAMP or N6-Ph-cAMP, inhibited the TGF-β1-driven overexpression of the mesenchymal markers ZEB-1, Slug, Fibronectin, and α-SMA. Furthermore, we showed that A1, A2A, P2Y1, P2Y11, and P2X7 purine receptor agonists modulated the TGF-β1-induced EMT through the involvement of PKA and/or MAPK/ERK signaling. The stimulation of A2A receptor reduced the overexpression of the EMT-related markers, mainly through the cAMP-dependent PKA pathway, as confirmed by cell pre-treatment with Myr-PKI. Both A1 and P2Y1 receptor stimulation exacerbated the TGF-β1-driven effects, which were reduced by cell pre-treatment with the MAPK inhibitor PD98059, according to the increased ERK1/2 phosphorylation upon receptor activation. The effects induced by P2Y11 receptor activation were oppositely modulated by PKA or MAPK inhibition, in line with the dual nature of the Gs- and Gq-coupled receptor. Differently, P2X7 receptor induced, per se, similar and not additive effects compared to TGF-β1, after prolonged cell exposure to BzATP. These results suggest a putative role of purine receptors as target for anti-fibrotic agents.

Keywords: Epithelial to mesenchymal transition; Fibrosis; Madin Darby canine kidney cells; P1/P2 purinergic receptors; Transforming growth factor β1.


Conflict of interest statement

Mariachiara Zuccarini declares that she has no conflict of interest.

Patricia Giuliani declares that she has no conflict of interest.

Silvana Buccella declares that she has no conflict of interest.

Valentina Di Liberto declares that she has no conflict of interest.

Giuseppa Mudò declares that she has no conflict of interest.

Natale Belluardo declares that she has no conflict of interest.

Marzia Carluccio declares that she has no conflict of interest.

Margherita Rossini declares that she has no conflict of interest.

Daniele Filippo Condorelli declares that he has no conflict of interest.

Michel Piers Rathbone declares that she has no conflict of interest.

Francesco Caciagli declares that he has no conflict of interest.

Renata Ciccarelli declares that she has no conflict of interest.

Patrizia Di Iorio declares that she has no conflict of interest.

Figures

Fig. 1
Fig. 1
Effect of TGF-β1 on EMT marker expression. a Dose-effect curves of TGF-β1. MDCK cells were challenged with increasing concentrations of TGF-β1 ranging from 0.75 ng/mL (30 pM) to 20 ng/mL (800 pM) for 48 h to examine TGF-β1-mediated changes in ZEB1, Slug expression (left) and α-SMA, Fibronectin (right) by RT-PCR analysis. b Time course of TGF-β1. The effect of TGF-β1 on ZEB1, Slug (left) and α-SMA, Fibronectin (right) expression was evaluated by RT-PCR analysis in MDCK cells exposed to 5 ng/mL (200 pM) TGF-β1 up to 72 h. Each value represents the mean ± SEM of at least three independent experiments, and it is expressed as relative amount of mRNA normalized to GAPDH. c Representative photomicrographs of MDCK cells. Cells were challenged with increasing concentration of TGF-β1 (2.5–10 ng/mL) for 48 h. The sub-confluent monolayers were stained with rhodamine-phalloidin (red) to label F-actin of the cytoskeleton. Scale bars: 10 μm. TGF-β1-stimulated cells showed spindle-like morphology with elongated F-actin stress fibers, indicative of mesenchymal cells
Fig. 2
Fig. 2
Effects of cAMP analogues and IBMX on TGF-β1-induced EMT. MDCK cells were exposed to 5 ng/mL TGF-β1 for 48 h in the absence or presence of 5 μM 8-CPT-cAMP, 5 μM N6-Ph-cAMP, 5 μM 8-CPT-2Me-cAMP, or 100 μM IBMX. a Representative Western blot analysis of Fibronectin, E-cadherin (left), α-SMA, and N-cadherin (right) with the respective β-actin as loading control. b Quantitative data of densitometric analysis. Each column represents the mean ± SEM of at least three independent experiments, and it is expressed as relative protein expression normalized to β-actin. Student’s t test: *P < 0.05, **P < 0.02, ***P < 0.01, § P < 0.001 vs. untreated cells (control); # P < 0.05, ## P < 0.02, ### P < 0.01, P < 0.001 vs. TGF-β1-treated cells
Fig. 3
Fig. 3
Effects of 8-CPT-cAMP and N6-Ph-cAMP on TGF-β1-induced EMT. MDCK cells were challenged to 5 ng/mL TGF-β1 for 48 h in the absence or presence of 5 μM 8-CPT-cAMP (a) and 5 μM N6-Ph-cAMP (b). The expression of EMT-associated genes ZEB1, Slug, Fibronectin, and α-SMA was evaluated by RT-PCR analysis. PKA or ERK 1/2 inhibitors, 5 μM Myr-PKI or 10 μM PD98059, were added to culture medium 30 min before TGF-β1 treatment or co-treatment with TGF-β1/cAMP analogues until the end of the experiment. The relative amount of mRNA is presented as ratio of mRNA to GAPDH. Each column represents the mean ± SEM of at least five independent experiments, and it is expressed as relative amount of mRNA normalized to GAPDH. Student’s t test: *P < 0.05, **P < 0.01, ***P < 0.001 vs. TGF-β1-treated cells; # P < 0.05, ## P < 0.01 vs. TGF-β1/cAMP analogue-treated cells
Fig. 4
Fig. 4
Effects of P1 adenosine receptor agonists on TGF-β1-induced EMT. a MDCK cells were challenged to 5 ng/mL TGF-β1 for 48 h in the absence or presence of the selective A2AR agonist, 50 nM CGS21680, or b the selective A1R agonist, 50 nM CCPA. The expression of ZEB1, Slug (left) and Fibronectin, α-SMA (right) was evaluated by RT-PCR analysis. A2AR or A1R antagonists, 50 nM ZM241385 or 100 nM DPCPX, as well as PKA or ERK 1/2 inhibitors, 5 μM Myr-PKI or 10 μM PD98059, were added to culture medium 30 min before TGF-β1 treatment or co-treatment with TGF-β1/A2A or A1R agonists until the end of the experiment. Each column represents the mean ± SEM of at least five independent experiments, and it is expressed as relative amount of mRNA normalized to GAPDH. Student’s t test: *P < 0.05, **P < 0.01, ***P < 0.001 vs. TGF-β1-treated cells; # P < 0.05, ## P < 0.01, ### P < 0.001 vs. TGF-β1/A2AR or A1R agonist-treated cells. c Representative photomicrographs of MDCK cells. Cells were challenged with 5 ng/mL TGF-β1 in the absence or presence of 50 nM CGS21680 or 50 nM CCPA for 48 h. The sub-confluent monolayers were stained with rhodamine-phalloidin (red) and nuclei were counterstained with DAPI (blue). Scale bars: 10 μm
Fig. 5
Fig. 5
Effects of P2 adenosine receptor agonists on TGF-β1-induced EMT. a MDCK cells were challenged to 5 ng/mL TGF-β1 for 48 h in the absence or presence of the selective P2Y1R agonist, 30 nM MRS2365, or b the selective P2Y11R agonist, 100 μM NF546. The expression of ZEB1, Slug (left) and Fibronectin, α-SMA (right) was evaluated by RT-PCR analysis. P2Y1R or P2Y11R antagonists, 10 μM MRS2179 or 10 μM NF340, as well as PKA or ERK 1/2 inhibitors, 5 μM Myr-PKI or 10 μM PD98059, were added to culture medium 30 min before TGF-β1 treatment or co-treatment with TGF-β1/P2Y1R or P2Y11R agonists until the end of the experiment. Each column represents the mean ± SEM of at least five independent experiments, and it is expressed as relative amount of mRNA normalized to GAPDH. Student’s t test: *P < 0.05, **P < 0.01, ***P < 0.001 vs. TGF-β1-treated cells; # P < 0.05, ## P < 0.01, ### P < 0.001 vs. TGF-β1/P2Y1R or P2Y11R agonist-treated cells. c Representative photomicrographs of MDCK cells. Cells were challenged with 5 ng/mL TGF-β1 in the absence or presence of 30 nM MRS2365 or 100 μM NF546 for 48 h. The sub-confluent monolayers were stained with rhodamine-phalloidin (red) and nuclei were counterstained with DAPI (blue). Scale bars: 10 μm
Fig. 6
Fig. 6
Effects of P1 and P2 purine receptor agonists on TGF-β1-induced EMT. Western blots show the expression of Fibronectin and α-SMA in MDCK cells challenged to 5 ng/mL TGF-β1 for 48 h in the absence or presence of a the selective A2AR agonist, 50 nM CGS21680; b the selective A1R agonist, 50 nM CCPA; c the P2Y1R agonist, 30 nM MRS2365; or d the selective P2Y11R agonist, 100 μM NF546. A2AR, A1R, P2Y1R, or P2Y11R antagonists (50 nM ZM241385, 100 nM DPCPX, 10 μM MRS2179, or 10 μM NF340), as well as PKA or ERK 1/2 inhibitors, 5 μM Myr-PKI or 10 μM PD98059, were added to culture medium 30 min before TGF-β1 treatment or co-treatment with TGF-β1/P1 or P2 receptor agonists until the end of the experiment. Histograms represent data of densitometric analysis, and each column indicates the mean ± SEM of at least three independent experiments and it is expressed as relative protein expression normalized to β-actin. Student’s t test: *P < 0.05, **P < 0.02, ***P < 0.01, § P < 0.001 vs. TGF-β1-treated cells; # P < 0.05, ## P < 0.02, ### P < 0.01, P < 0.001 vs. TGF-β1/P1 or P2 receptor agonist-treated cells
Fig. 7
Fig. 7
Effects of P2X7 receptor agonist on cell morphology. Representative photomicrographs of MDCK cells challenged with 5 ng/mL TGF-β1 for 48 h or P2X7R agonist, 150 μM BzATP, up to 96 h, alone or in the presence of 5 ng/mL TGF-β1, added to the culture medium for the last 48 h of the experiment. The sub-confluent monolayers were stained with rhodamine-phalloidin (red) and nuclei were counterstained with DAPI (blue). Scale bars: 10 μm

References

    1. Thiery JP. Epithelial-mesenchymal transitions in tumour progression. Nat rev Cancer. 2002;2(6):442–454. doi: 10.1038/nrc822. - DOI - PubMed
    1. Lopez-Novoa JM, Nieto MA. Inflammation and EMT: an alliance towards organ fibrosis and cancer progression. EMBO Mol med. 2009;1(6–7):303–314. doi: 10.1002/emmm.200900043. - DOI - PMC - PubMed
    1. Hinz B. The myofibroblast: paradigm for a mechanically active cell. J Biomech. 2010;43(1):146–155. doi: 10.1016/j.jbiomech.2009.09.020. - DOI - PubMed
    1. Humphreys BD, Lin SL, Kobayashi A, Hudson TE, Nowlin BT, Bonventre JV, Valerius MT, McMahon AP, Duffield JS. Fate tracing reveals the pericyte and not epithelial origin of myofibroblasts in kidney fibrosis. Am J Pathol. 2010;176(1):85–97. doi: 10.2353/ajpath.2010.090517. - DOI - PMC - PubMed
    1. Kriz W, Kaissling B, Le Hir M. Epithelial-mesenchymal transition (EMT) in kidney fibrosis: fact or fantasy. J Clin Invest. 2011;121(2):468–474. doi: 10.1172/JCI44595. - DOI - PMC - PubMed

Publication types

MeSH terms

Substances

LinkOut - more resources