. 2017 Jun 15:6:e25555.
doi: 10.7554/eLife.25555.

Full length RTN3 regulates turnover of tubular endoplasmic reticulum via selective autophagy

Affiliations

Full length RTN3 regulates turnover of tubular endoplasmic reticulum via selective autophagy

Paolo Grumati et al. Elife. .

Erratum in

Abstract

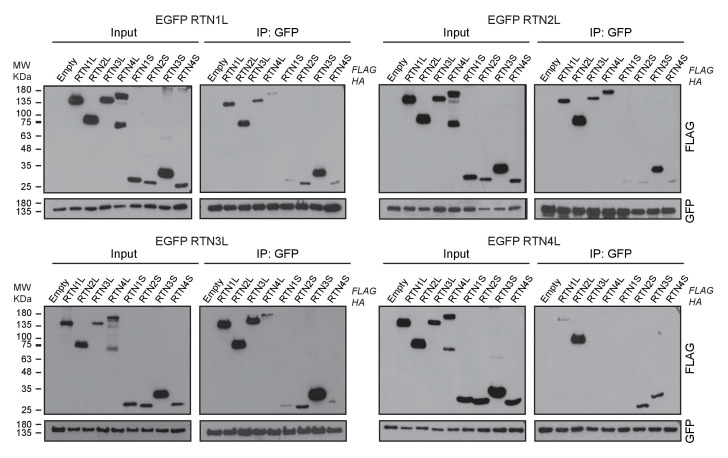
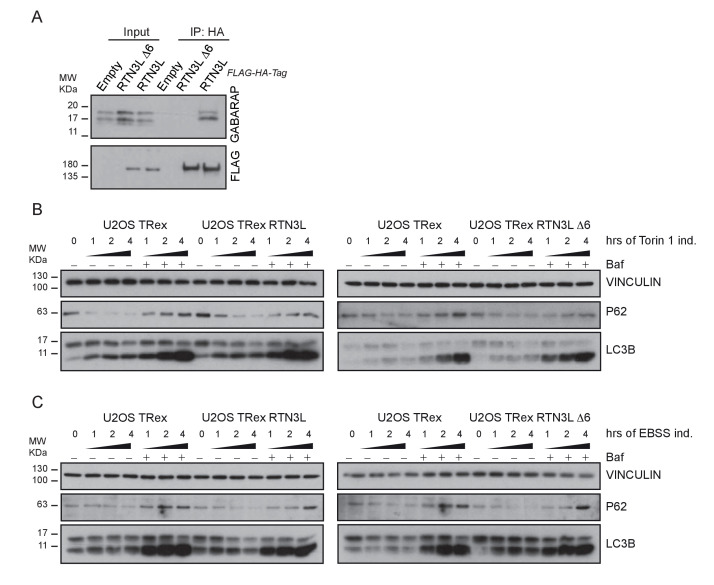
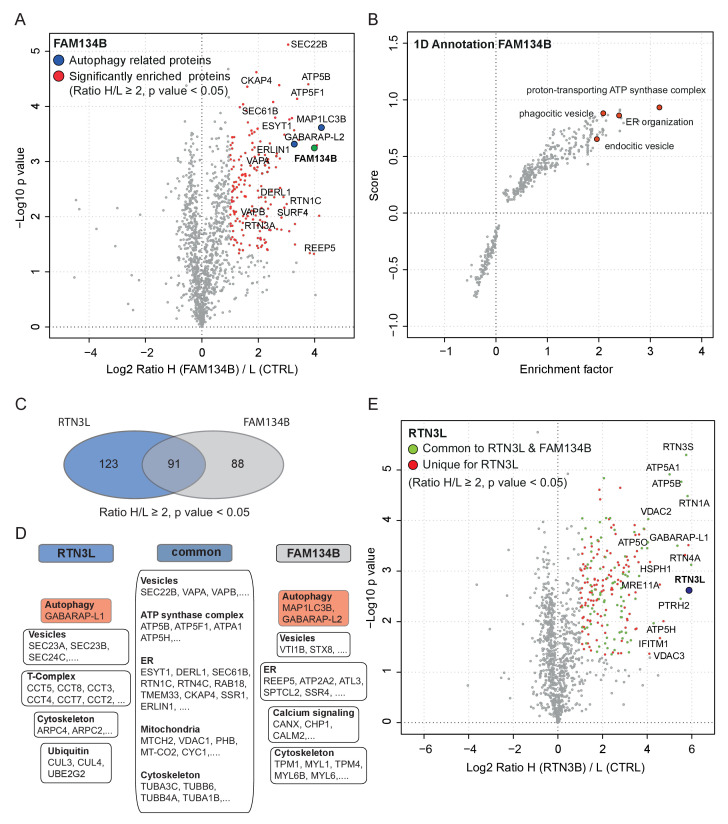
The turnover of endoplasmic reticulum (ER) ensures the correct biological activity of its distinct domains. In mammalian cells, the ER is degraded via a selective autophagy pathway (ER-phagy), mediated by two specific receptors: FAM134B, responsible for the turnover of ER sheets and SEC62 that regulates ER recovery following stress. Here, we identified reticulon 3 (RTN3) as a specific receptor for the degradation of ER tubules. Oligomerization of the long isoform of RTN3 is sufficient to trigger fragmentation of ER tubules. The long N-terminal region of RTN3 contains several newly identified LC3-interacting regions (LIR). Binding to LC3s/GABARAPs is essential for the fragmentation of ER tubules and their delivery to lysosomes. RTN3-mediated ER-phagy requires conventional autophagy components, but is independent of FAM134B. None of the other reticulon family members have the ability to induce fragmentation of ER tubules during starvation. Therefore, we assign a unique function to RTN3 during autophagy.

Keywords: RTN3; autophagy; biochemistry; cell biology; endoplasmic reticulum; none; reticulon; selective autophagy.


Conflict of interest statement

ID: Senior editor, eLife.

The other authors declare that no competing interests exist.

Figures

Figure 1.
Figure 1.. RTN3 over-expression induces ER tubules fragmentation during starvation.
(A, B) Schematic representation of the protein structure and topology of FAM134B (A) and RTN3 long and short isoforms (B). (C) Immunofluorescence of HA and LC3B in U2OS TRex stable cell lines expressing FLAG-HA-RTN3L after 24 hr treatment with 1 µg/ml of doxycycline. Cells were kept in standard growing condition (DMEM with 10% FBS) or starved with EBSS for 6 hr. RTN3L was monitored using anti HA antibody, while autophagy induction was visualized using anti-LC3B antibody. Bafilomycin A1 was added at a final concentration of 200 ng/ml. Scale bars: 10 µm. (D) Quantification of U2OS TRex FLAG-HA-RTN1-4L cells with ER tubule fragment after 6 hr starvation with EBSS plus Bafilomycin A1, 200 ng/ml. Number of cells >100 for each condition. Data are representative of three independent biological replicates. Error bars indicate s.d. (E) Super-resolution fluorescence microscopy (dSTORM) of ER fragments in U2OS TRex FLAG-HA-RTN3L cells stained with anti HA and anti LC3B antibodies after 6 hr starvation with EBSS plus Bafilomycin A1, 200 ng/ml. Scale bar: 0.5 µm. (F) Schematic representation of ER tubules fragmentation and LC3 labeling in U2OS TRex FLAG-HA-RTN3L cells. The red square indicates the level of high resolution represented in panel E. DOI: http://dx.doi.org/10.7554/eLife.25555.002
Figure 1—figure supplement 1.
Figure 1—figure supplement 1.. Reticulon family members.
(A) Schematic representation of RTN1-4 genes and relative isoforms. Red asterisks (*) indicate the presence of mutations inside the RHD of RTN3. (B) RTNs short and long isoforms nomenclature as indicated in PubMed (Gene) and Ref-Seqs. For simplicity, the long isoforms are indicated as RTN#L the short isoform as RTN#S. (C) Schematic representation for the U2OS TRex FLAG-HA-RTNs stable and inducible cell lines. DOI: http://dx.doi.org/10.7554/eLife.25555.003
Figure 1—figure supplement 2.
Figure 1—figure supplement 2.. ER tubules morphology in U2OS TRex cells after over-expression of full length RTN proteins.
(A) Endogenous labeling of CALNEXIN and REEP5 in U2OS TRex cells. (B) Endogenous labeling of CALNEXIN and REEP5 in U2OS TRex cells after over-expression of long RTN isoforms. Scale bars: 10 µm. DOI: http://dx.doi.org/10.7554/eLife.25555.004
Figure 1—figure supplement 3.
Figure 1—figure supplement 3.. ER tubules morphology in U2OS TRex cell after over-expression of short RTN variants.
(A) Endogenous labeling of CALNEXIN and REEP5 in U2OS TRex cells. (B) Endogenous labeling of CALNEXIN and REEP5 in U2OS TRex cells after over-expression of short RTN isoforms. Scale bars: 10 µm. DOI: http://dx.doi.org/10.7554/eLife.25555.005
Figure 1—figure supplement 4.
Figure 1—figure supplement 4.. ER tubules morphology in U2OS TRex RTNs cell lines after autophagy induction via EBSS starvation.
(A) Immunofluorescence of HA and LC3B in U2OS TRex RTN1-4L (B) and RTN1-4S after 24 hr treatment with 1 µg/ml of doxycycline. Cells were kept in standard growing condition (DMEM with 10% FBS) or starved with EBSS for the indicated time. RTNs were monitored using anti-HA antibody, while autophagy induction was visualized using anti-LC3B antibody. Bafilomycin A1 was added at a final concentration of 200 ng/ml. Scale bars: 10 µm. DOI: http://dx.doi.org/10.7554/eLife.25555.006
Figure 1—figure supplement 5.
Figure 1—figure supplement 5.. RTN3L over-expression promotes ER tubules fragmentation during autophagy induction.
(A) Super-resolution fluorescence microscopy (dSTORM) of ER fragments in U2OS TRex FLAG-HA-RTN3L cells stained with anti HA and anti LC3B antibodies after 6 hr starvation with EBSS plus Bafilomycin A1, 200 ng/ml. Scale bar: 5 µm. The white box indicates the magnification reported in Figure 1E. (B) Co-localization of endogenous RTN3 with SEC63, in U2OS cells over-expressing GFP-SEC63, in standard growing conditions and after EBSS treatment for 6 hr. (C) Co-staining of endogenous RTN3 and LC3B in U2OS cells in standard growing conditions (DMEM with 10% FBS) and after nutrient deprivation (EBSS). (D) Co-staining of HA and CALNEXIN, BSCL2, REEP5 and CLIMP-63 in U2OS TRex FLAG-HA-RTN3L cells in standard growing conditions and after EBSS starvation. Scale bars: 10 µm. DOI: http://dx.doi.org/10.7554/eLife.25555.007
Figure 2.
Figure 2.. RTN3L homo-dimerization induces ER tubules fragmentation.
(A) Schematic representation of 2XFKBP-HA-RTN3L, 2XFKBP-HA-RTN3S and FRB-FLAG-RTN3L plasmids. (B) Working model for the RTN3 homo/hetero-dimerization assay. (C) Quantification of cells presenting ER tubule fragmentation after transient co-transfection with FKBP-FKBP-HA-RTN3L/FRB-FLAG-RTN3L or 2XFKBP-HA-RTN3S/FRB-FLAG-RTN3L plasmids in standard conditions and after Rapalog treatment. Number of cells >100 for each condition. Data are representative of three independent biological replicates, *p<0.05; **p<0.01. Error bars indicate s.d. (D,E) U2OS TRex transiently expressing 2XFKBP-HA-RTN3L and FRB-FLAG-RTN3L. 24 hr after transfection, 500 nM Rapalog was added for 2 hr and cells were (D) double stained with antibodies against HA and FLAG and (E) triple stained with HA, FLAG and LC3B after 1 hr EBSS treatment plus 200 ng/ml Bafilomycin A1. Scale bars: 10 µm. DOI: http://dx.doi.org/10.7554/eLife.25555.008
Figure 2—figure supplement 1.
Figure 2—figure supplement 1.. Homo- and hetero-dimerization of RTN3 affects ER morphology independently from autophagy.
(A) Immunofluorescence of HA and FLAG in U2OS TRex cells transiently expressing FKBP-HA-RTN3L or FRB-FLAG-RTN3L or FKBP-HA-RTN3S. (B) Immunofluorescence of HA and FLAG in U2OS TRex transiently co-expressing FKBP-HA-RTN3S and FRB-FLAG-RTN3L. After 24 hr, 500 nM Rapalog was added for 2 hr. Scale bars: 10 µm. (C) Quantification of cells presenting extended ER tubules after transient co-transfection with 2XFKBP-HA-RTN3L/FRB-FLAG-RTN3L or 2XFKBP-HA-RTN3S/FRB-FLAG-RTN3L plasmids in standard conditions and after Rapalog treatment. Number of cells >100 for each condition. Data are representative of three independent biological replicates. **p<0.01. Error bars indicate s.d. (D) Western blot analysis of LC3B lipidation and p62 degradation in U2OS TRex cells treated with Rapalog for the indicated time. DOI: http://dx.doi.org/10.7554/eLife.25555.009
Figure 2—figure supplement 2.
Figure 2—figure supplement 2.. Dimerization of RTN3 modifies ER tubules structure.
(A,B) Immunofluorescence of HA, FLAG in U2OS TRex transiently co-expressing 2XFKBP-HA-RTN3L and FRB-FLAG-RTN3L (A) or 2XFKBP-HA-RTN3S and FRB-FLAG-RTN3L (B). ER was labelled using antibodies against endogenous: CALNEXIN, BSCL2, REEP5 and CLIMP-63. After 24 hr from transfection, 500 nM Rapalog was added for 2 hr. Scale bars: 10 µm. DOI: http://dx.doi.org/10.7554/eLife.25555.010
Figure 3.
Figure 3.. ER tubules fragments are delivered to lysosomes.
(A) Immunofluorescence of HA and LAMP1 in U2OS TRex stable cell lines expressing FLAG-HA-RTN3L in basal growing conditions and after 6 hr starvation with EBSS plus Bafilomycin A1 200 ng/ml. RTN3L level was monitored using an anti HA antibody, while lysosomes were visualized using anti-LAMP1 antibody. Scale bars: 10 µm. (B) Super-resolution fluorescence microscopy (dSTORM) of ER fragments in U2OS TRex FLAG-HA-RTN3L cells stained with anti-HA and anti-LAMP1 antibodies after 6 hr starvation with EBSS plus Bafilomycin A1, 200 ng/ml. Asterisk indicates RTN3L positive ER tubule fragment. Scale bar: 0.5 µm. (C) Schematic representation of ER tubules fragmentation and their delivery to lysosome. The red square indicates the level of high resolution represented in panel B. (D,E) Immuno-gold labelling of cryo-sections using antibodies against CD63 (large dots, diameter 15 nm) and against either the KDEL peptide (D) or the HA tag (E) (small dots, diameter 10 nm). U2OS RTN3L cells were nutrient starved in EBSS for 6 hr in the presence of Bafilomycin A1 before being processed for IEM. AL, autolysosome; M, mitochondrion; ER, endoplasmic reticulum; Arrowheads indicates KDEL-positive ER fragments (D) or HA-RTN3L (E). Scale bar, 500 nm. Enlargement in D shows a detail of a KDEL-positive ER fragment inside an autolysosome. Scale bar, 200 nm. DOI: http://dx.doi.org/10.7554/eLife.25555.011
Figure 3—figure supplement 1.
Figure 3—figure supplement 1.. EBSS treatment induces fragmentation of the ER and subsequent delivery of the fragments to lysosomes.
Co-staining of U2OS TRex cells with endogenous RTN3, CALNEXIN, REEP5 or CLIMP-63 with the lysosomal marker LAMP1. Cells were grown in standard growing conditions (DMEM with 10% FBS) or treated with EBSS for 6 hr. Scale bars: 10 µm. DOI: http://dx.doi.org/10.7554/eLife.25555.012
Figure 3—figure supplement 2.
Figure 3—figure supplement 2.. ER tubule fragments are delivered to lysosomes after autophagy induction.
(A) Immunofluorescence of HA and LAMP1 in U2OS TRex RTN1-4L and (B) the RTN1-4S cells after 24 hr treatment with 1 µg/ml of doxycycline. Cells were kept in standard growing condition (DMEM with 10% FBS) or starved for 6 hr in EBSS. RTNs were monitored using anti HA antibody, while lysosomes were visualized using LAMP1 antibody. Bafilomycin A1 was added at the final concentration of 200 ng/ml. Scale bars: 10 µm. DOI: http://dx.doi.org/10.7554/eLife.25555.013
Figure 3—figure supplement 3.
Figure 3—figure supplement 3.. RTN3L fragments ER tubules and mediates their delivery to lysosomes.
Immunofluorescence of HA and endogenous CALNEXIN, BSCL2, REEP5, CLIMP-63 and LAMP1 in U2OS TRex RTN3L cells after 24 hr treatment with 1 µg/ml of doxycycline and 6 hr EBSS starvation in the presence of Bafilomycin A1, 200 ng/ml. Scale bars: 10 µm. DOI: http://dx.doi.org/10.7554/eLife.25555.014
Figure 3—figure supplement 4.
Figure 3—figure supplement 4.. RTN3L is degraded via lysosomes during starvation.
(A) U2OS TRex transiently expressing 2XFKBP-HA-RTN3L and FRB-FLAG-RTN3L. 24 hr after transfection, 500 nM Rapalog was added for 2 hr and cells were triple stained with HA, FLAG and LAMP1 after 1 hr EBSS treatment plus 200 ng/ml Bafilomycin A1. Scale bars: 10 µm. (B) Super-resolution fluorescence microscopy (dSTORM) of ER fragments in U2OS TRex FLAG-HA-RTN3L cells stained with anti HA and anti LAMP1 antibodies after 6 hr starvation with EBSS plus Bafilomycin A1, 200 ng/ml. Scale bar 5 µm. The white box indicates the magnification reported in Figure 3B. (C) HeLa TRex mCherry-EGFP-RTN3L cells were treated with 1 µg/ml doxycycline for 24 hr and starved with EBSS for 6 hr in the absence of Bafilomycin A1. Scale bars: 10 µm. DOI: http://dx.doi.org/10.7554/eLife.25555.015
Figure 3—figure supplement 5.
Figure 3—figure supplement 5.. ER membranes and RTN3L are present in autolysosomes.
U2OS RTN3L cells were nutrient starved in EBSS for 6 hr in the presence of Bafilomycin A1, 200 ng/ml. (A) Immuno-gold labelling of cryo-sections using antibodies against the KDEL peptide. (B) Immuno-gold labelling for the HA tag peptide. (C) Double immuno-gold labelling against CD63 (large dots, diameter 15 nm) and the HA tag (small dots, diameter 10 nm). AL, autolysosome; N, nucleus; ER, endoplasmic reticulum; MVB, multi-vesicular bodies; A, autophagosome. Scale bar 500 nm. DOI: http://dx.doi.org/10.7554/eLife.25555.016
Figure 4.
Figure 4.. RTN3 absence impairs ER tubules turnover but not macro-autophagy flux.
(A) Western blot analysis of ER protein turnover in wild-type, Atg5–/–, Fip200–/–, Fam134b–/– and Rtn3–/– MEFs. Cells were starved with EBSS for the indicate time in the presence of 100 µM cicloheximide. SQSTM1 (p62) has been used as positive control for autophagy induction. (B) Western blot analysis of ER tubules markers in wild-type, Rtn3–/– MEFs and Rtn3–/– MEFs reconstituted with the human EGFP-RTN3L. (C) Western blot for GFP in Rtn3–/– MEFs transfected with human EGFP-RTN3L. (D,E) Western blot analysis of Lc3b and p62 in wild-type and Rtn3–/– MEFs. Cells were treated with 250 nM Torin1 (D) or EBSS (E) in the presence or absence of Bafilomycin A1, 200 ng/ml, for the indicated time. (F) Representative confocal imagines of wild-type and Rtn3 knockout MEFs, transfected with mCherry-EGFP-LC3B, in standard conditions (DMEM with 10% FBS) and after 6 hr EBSS treatment. Scale bars: 10 µm. (G) Quantification of LC3B positive autophagy puncta in wild-type and Rtn3–/– MEFs transfected with mCherry-EGFP-LC3B. Cells were grown in standard conditions or treated with EBSS for 2 hr. Number of cells >50 for each condition. Data are representative of three independent biological replicates. Error bars indicate s.d. No significant differences were detected between wild-type and Rtn3–/– MEFs. DOI: http://dx.doi.org/10.7554/eLife.25555.017
Figure 4—figure supplement 1.
Figure 4—figure supplement 1.. Rtn3 absence affects ER tubules degradation but not macro-autophagy or ER morphology.
(A) Densitometry analysis of Western Blot bands represented in Figure 4A–C. Values represent the average of three experiments. (B) Western blot for Rtn3 protein in wild type and Rtn3 knockout MEFs. (C) Immunofluorescence of Calnexin, Reep5 and Climp-63 in wild-type and Rtn3 knockout MEFs. Scale bars: 10 µm. DOI: http://dx.doi.org/10.7554/eLife.25555.018
Figure 5.
Figure 5.. RTN3 interacts with the autophagy modifiers.
(A) Venn diagrams of the interactors of the four RTNs. Numbers represent the identified peptides significantly enriched in three IP and mass spectrometry replicates for each RTN. (B) Annotation enrichment analysis of the interactors of long RTN1-4 isoforms. Bars represent the significantly enriched gene ontology biological process (GOBP), the gene ontology cellular components (GOCC), the gene ontology molecular function (GOMF), the over-expressed pathways (KEGG) and the domain enrichment (Pfam). The numeric value on the right side of the bar shows the Benjamini-Hochberg FDR value. (C) Scatter-plot for 1D annotation enrichment analysis of RTN3L interactor partners significantly enriched in three different IPs. (D) Volcano-plot for RTN3L SILAC-based interactome. Peptides with and Log2 Ratio H/L ≥1 and –Log10 p value > 1.3 are labeled in red. Three biological replicates were analyzed. (E) Co-IP of endogenous GABARAP and GABARAP-L1 with over-expressed long and short isoforms of RTN1-4. Over-expression was induced for 24 hr in U2OS TRex stable cell lines using 1 µg/ml of doxycycline. Bafilomycin A1 was added at the final concentration of 200 ng/ml for 2 hr. (F) Endogenous Co-IP of RTN3 with GABARAP in A549 cells. The ‘empty’ lane represents unconjugated beads. Bafilomycin A1, 200 ng/ml, was added for 2 hr. DOI: http://dx.doi.org/10.7554/eLife.25555.019
Figure 5—figure supplement 1.
Figure 5—figure supplement 1.. Interactome analysis of RTN1-4L.
(A) Schematic representation for the SILAC-based mass spectrometric analysis of RTNs interactomes. (B) Scatter plot for 1D annotation enrichment analysis of RTN1L, RTN2L and RTN4L interactors significantly enriched in three different IP analyzed by mass spectrometry. (C) Volcano-plot for RTN1L, RTN2L and RTN4L SILAC-based interactomes. Interacting partners of each RTNs with and Log2 Ratio H/L >1 and –Log10 p value > 1.3 are labeled in red. Each volcano-plot represents three independent experiments. DOI: http://dx.doi.org/10.7554/eLife.25555.022
Figure 5—figure supplement 2.
Figure 5—figure supplement 2.. Interactome analysis of RTN1-4S.
(A) Volcano-plot for RTN1-4 short isoforms SILAC-based interactomes. Interactors of each RTNs with and Log2 Ratio H/L >1 and –Log10 p value > 1.3 are labeled in red. Each volcano-plot represents three independent experiments. (B) Venn diagrams of the interacting partners for the four RTNs. Numbers represent the identified proteins significantly enriched in three IP and mass spectrometry replicates for each RTN. (C) Annotation enrichment analysis of RTN1-4S interacting partners. The bars represent the significantly enriched gene ontology biological process (GOBP), the gene ontology cellular components (GOCC), the gene ontology molecular function (GOMF) and the domain enrichment (Pfam). The numeric value on the right side of the bar shows the Benjamini-Hochberg FDR. DOI: http://dx.doi.org/10.7554/eLife.25555.023
Figure 5—figure supplement 3.
Figure 5—figure supplement 3.. RTN1-4 strongly interact amongst themselves.
Co-immuno-precipitation of RTN1-4L indicates the interactions of each RTN with long and short isoforms of the other family members. Proteins were co-overexpressed in HEK293T cells for 24 hr. DOI: http://dx.doi.org/10.7554/eLife.25555.024
Figure 6.
Figure 6.. RTN3 LIR motifs are required for ER tubules fragmentation.
(A) A549 cell lysates were added to beads with immobilized GST fusion LC3-like modifiers: GST, GST-LC3A, GST-LC3B, GST-GABARAP-L1, GST-GABARAP-L2), followed by WB using an antibody against endogenous RTN3. (B) Domain architecture of RTN3L and alignment of the LIR motifs. Blue: reticulon homology domain (RHD), red: LC3-interacting region (LIR). (C) RTN3L lacking all six LIR domains (∆6) fails to bind to GST fusion LC3-like modifiers when over-expressed in HEK-293T cells. (D) Immunofluorescence of HA and LC3B in U2OS TRex FLAG-HA-RTN3L and FLAG-HA-RTN3L∆6LIRs after 24 hr treatment with 1 µg/ml of doxycycline and starved for 6 hr with EBSS plus Bafilomycin A1, 200 ng/ml. RTN3L was monitored using an anti HA antibody, while autophagy induction was visualized using anti-LC3B antibody. Scale bars: 10 µm. (E) Quantification of cells presenting at least one ER tubule fragment after 6 hr starvation with EBSS plus Bafilomycin A1, 200 ng/ml. Number of cells >500 for each condition. Data are representative of three independent biological experiments. *p<0.01. Error bars represent s.d. (F) Immunofluorescence of HA and LAMP1 in U2OS TRex FLAG-HA-RTN3L or FLAG-HA-RTN3L∆6LIRs cells induced 24 hr with 1 µg/ml of doxycycline and subsequently starved for 6 hr with EBSS plus Bafilomycin A1, 200 ng/ml. RTN3L was monitored using an anti-HA antibody, while lysosomes are visualized using anti-LAMP1 antibody. Scale bars: 10 µm. DOI: http://dx.doi.org/10.7554/eLife.25555.025
Figure 6—figure supplement 1.
Figure 6—figure supplement 1.. RTN3L directly binds to the LC3s/GABARAPs modifiers.
(A,B) HEK293T cells were transfected with the HA tagged RTN3L and RTN2L (A) and RTN3S (B). Cell lysates were added to beads with immobilized GST-fusion LC3-like modifiers (GST, GST-LC3A, GST-LC3B, GST-LC3C, GST-GABARAP, GST-GABARAP-L1, GST-GABARAP-L2, GST-Ub, GST-4XUb), followed by WB using an antibody against HA tag. (C) A549 cell lysates were added to beads with immobilized GST-fusion LC3-like modifiers or the LC3 like modifiers lacking the unique N-Terminus, followed by WB using an antibody against endogenous RTN3. (D) A549 cell lysates were added to beads with GST-LC3B or GST-LC3BF52A-V53A mutant and followed by WB using an antibody against endogenous RTN3. (E) HEK293T were transfected with the FLAG tagged RTN3L with mutation in one, five or six LIR domains mutated. Cell lysates were added to beads with immobilized GST-fusion LC3-like modifiers, followed by WB using an antibody against FLAG tag. DOI: http://dx.doi.org/10.7554/eLife.25555.026
Figure 6—figure supplement 2.
Figure 6—figure supplement 2.. LIR motifs are required to deliver RTN3L to lysosomes.
(A,B) Immunofluorescence of HA, GABARAP-L1 (A) and LC3B (B) and LAMP1 in U2OS TRex FLAG-HA-RTN3L and FLAG-HA-RTN3L∆6LIRs cells after 24-hr treatment with 1 µg/ml of doxycycline. Cells were kept in standard growing condition (DMEM with 10% FBS) or starved with EBSS for 6 hr. RTN3L was monitored using anti HA antibody, while autophagy induction is monitored using GABARAP-L1 (A) and (B) lysosomes were visualized using anti-LAMP1 antibody. Bafilomycin A1 was added at a final concentration of 200 ng/ml. Scale bars: 10 µm. (C) HeLa TRex mCherry-EGFP-RTN3 or mCherry-EGFP-RTN3∆6LIRs were treated with 1 µg/ml doxycycline for 24 hr and starved with EBSS for 6 hr in the absence of Bafilomycin A1. Scale bars: 10 µm. (D) Endogenous labeling of CALNEXIN and REEP5 in U2OS TRex cells and in U2OS TRex cells after RTN3L∆6LIRs over-expression. Scale bars: 10 µm. DOI: http://dx.doi.org/10.7554/eLife.25555.027
Figure 6—figure supplement 3.
Figure 6—figure supplement 3.. RTN3L over-expression does not affect autophagy flux.
(A) Co-immuno-precipitation of endogenous GABARAP with RTN3L and RTN3L∆6LIRs in U2OS TRex cells. (B,C) Western blot analysis of LC3B lipidation and p62 degradation in U2OS TRex FLAG-HA-RTN3L and FLAG-HA-RTN3L∆6LIRs cells after Torin1, 250 nM (B) or EBSS (C) treatment for the indicated time. DOI: http://dx.doi.org/10.7554/eLife.25555.028
Figure 7.
Figure 7.. Autophagy machinery influences RTN3 ability to fragment ER tubules.
(A) Venn diagrams of the interacting partners for RTN3L and RTNS. Numbers represent the identified proteins significantly enriched in three IP and mass spectrometry replicates for each isoform. (B) Schematic representation of the common and unique significantly enriched peptides for RTN3L and RTN3S. (C) Volcano-plot for RTN3L SILAC-based interactome. The interactors partners of RTN3L with and Log2 Ratio H/L >1 and –Log10 p value > 1.3 are labeled in dark blue. The common peptides between RTN3L and RTN3S, with and Log2 Ratio H/L >1 and –Log10 p value > 1.3, are labeled in red. Data represent three independent biological replicates. (D) Western blot analysis of ER tubules markers in wild-type, Rtn3–/– MEFs and Rtn3–/– MEFs reconstituted with the human EGFP-RTN3S or EGFP-RTN3L∆6LIRs. (E) Western blot for GFP in Rtn3–/– MEFs transfected with human EGFP-RTN3S or EGFP-RTN3L∆6LIRs. (F) Immunofluorescence of HA and LC3B in U2OS TRex FLAG-HA-RTN3L; FAM134B or ATG7 knockout cells induced for 24 hr with 1 µg/ml of doxycycline and starved for 6 hr with EBSS plus Bafilomycin A1, 200 ng/ml. RTN3L was monitored using anti HA antibody, while autophagy induction was visualized using anti-LC3B antibody. Scale bars: 10 µm. (G) Quantification of cells presenting ER tubule fragments after 6 hr starvation with EBSS plus Bafilomycin A1, 200 ng/ml. Number of cells >500 for each condition. Data are representative of three independent biological replicates. *p<0.01. Error bars indicate s.d. (H) Western blot analysis for ATG7 and FAM134B protein level in U2OS TRex FLAG-HA-RTN3L cells after ATG7 or FAM134B gene knockout by CRISPR-CAS9 technology. DOI: http://dx.doi.org/10.7554/eLife.25555.029
Figure 8.
Figure 8.. Similarities and differences between RTN3L and FAM134B.
(A) Volcano-plot for FAM134B SILAC-based interactome. Peptides with and Log2 Ratio H/L >1 and –Log10 p value >1.3 are labeled in red. Data represent three biological replicates. (B) Scatter plot for 1D annotation enrichment analysis of FAM134B interacting partners significantly enriched in three different IP analyzed by mass spectrometry. (C) Venn diagrams of RTN3L and FAM134B interactors. Numbers represent the identified peptides significantly enriched in three IP and mass spectrometry replicates for the two baits. (D) Schematic representation of the common and unique interacting partners of RTN3L and FAM134B interactors (E) Volcano-plot for RTN3L SILAC-based interactome. RTN3L interactors with and Log2 Ratio H/L >1 and –Log10 p value >1.3 are labeled in dark blue. The common peptides between RTN3L and FAM134B with and Log2 Ratio H/L >1 and –Log10 p value > 1.3 are labeled in red. Data represent three biological replicates. DOI: http://dx.doi.org/10.7554/eLife.25555.031
Figure 8—figure supplement 1.
Figure 8—figure supplement 1.. RTN3L and FAM134B are two independent ER-phagy receptors.
(A) Annotation enrichment analysis of FAM134B interactors. Bars represent the significantly enriched gene ontology biological process (GOBP) and the gene ontology cellular components (GOCC). The numeric value on the right side of the bar shows the Benjamini-Hochberg FDR value. (B) Cytoscape scheme for some FAM134B interactors. (C) Co-IP of RTN3L with the three members of the FAM134 protein family. Proteins were co-overexpressed in HEK293T cells for 24 hr. RTN1L was used as positive control. (D) Co-IP of FAM134B with three members of the FAM134 protein family and RTN3L. Proteins were co-overexpressed in HEK293T cells for 24 hr. (E) Co-IP of FAM134B with the long isoforms of RTN1-4. Proteins were co-overexpressed in HEK293T cells for 24 hr. (F) Co-IP of FAM134B with the short isoforms of RTN1-4. Proteins were co-overexpressed in HEK293T cells for 24 hr. DOI: http://dx.doi.org/10.7554/eLife.25555.033
Figure 9.
Figure 9.. Model for ER tubules degradation.
To drive ER tubules turnover, local RTN3L homo-dimerizes and leads to the recruitment of autophagic membranes and ER tubules fragmentation. Autophagosomes containing ER tubules as cargo, subsequently fuse with lysosomes. DOI: http://dx.doi.org/10.7554/eLife.25555.034

References

    1. Anderson DJ, Hetzer MW. Reshaping of the endoplasmic reticulum limits the rate for nuclear envelope formation. The Journal of Cell Biology. 2008;182:911–924. doi: 10.1083/jcb.200805140. - DOI - PMC - PubMed
    1. Bhogaraju S, Kalayil S, Liu Y, Bonn F, Colby T, Matic I, Dikic I. Phosphoribosylation of Ubiquitin Promotes Serine Ubiquitination and Impairs Conventional Ubiquitination. Cell. 2016;167:1636–1649. doi: 10.1016/j.cell.2016.11.019. - DOI - PubMed
    1. Biazik J, Ylä-Anttila P, Vihinen H, Jokitalo E, Eskelinen EL. Ultrastructural relationship of the phagophore with surrounding organelles. Autophagy. 2015;11:439–451. doi: 10.1080/15548627.2015.1017178. - DOI - PMC - PubMed
    1. Birgisdottir ÅB, Lamark T, Johansen T. The LIR motif - crucial for selective autophagy. Journal of Cell Science. 2013;126:3237–3247. doi: 10.1242/jcs.126128. - DOI - PubMed
    1. Borgese N, Francolini M, Snapp E. Endoplasmic reticulum architecture: structures in flux. Current Opinion in Cell Biology. 2006;18:358–364. doi: 10.1016/j.ceb.2006.06.008. - DOI - PMC - PubMed

Publication types