. 2017 Jun 15;18(6):1271.
doi: 10.3390/ijms18061271.

Lipid Storage and Autophagy in Melanoma Cancer Cells

Affiliations

Lipid Storage and Autophagy in Melanoma Cancer Cells

Claudia Giampietri et al. Int J Mol Sci. .

Abstract

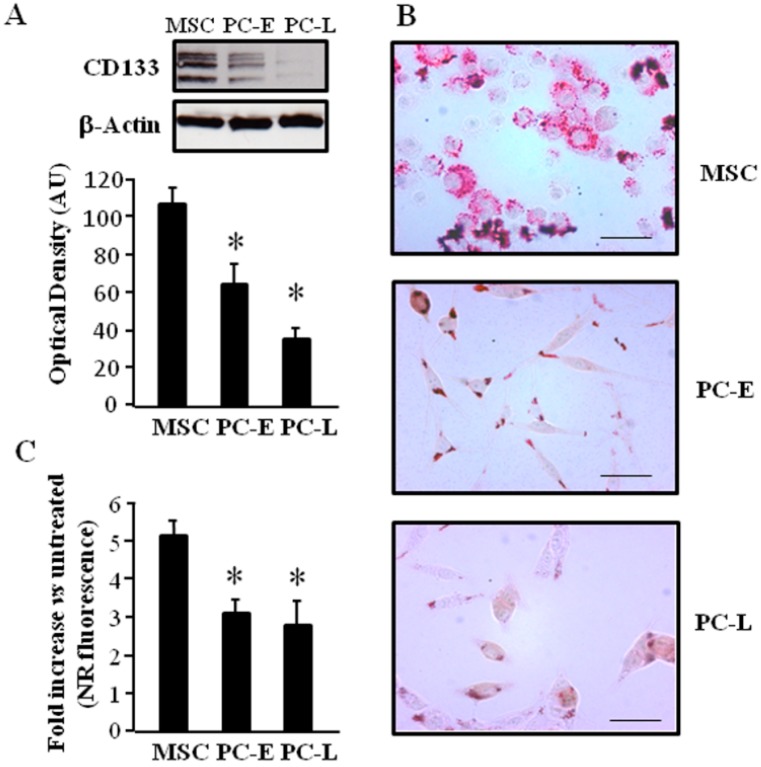
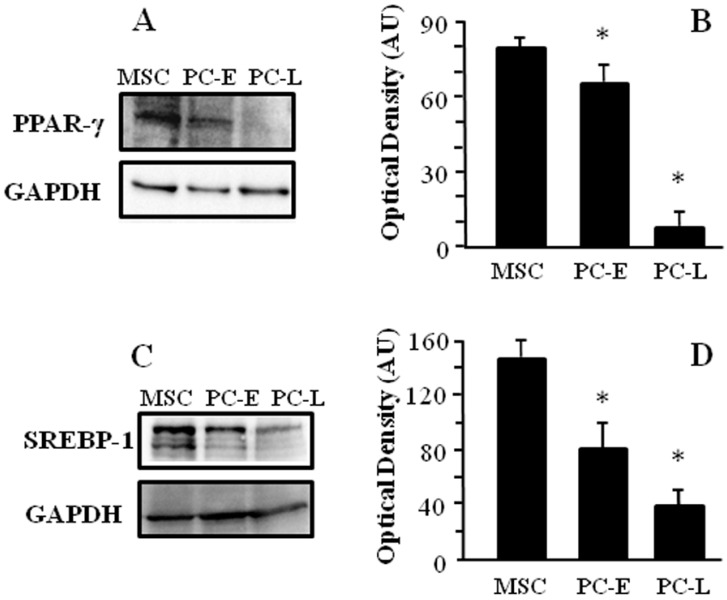
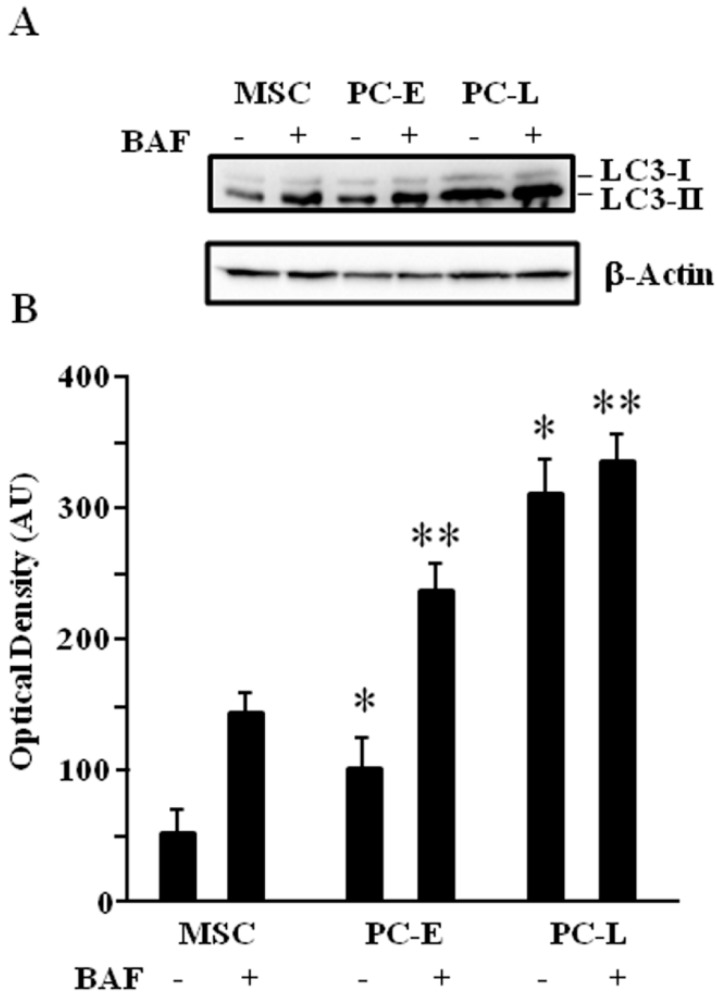
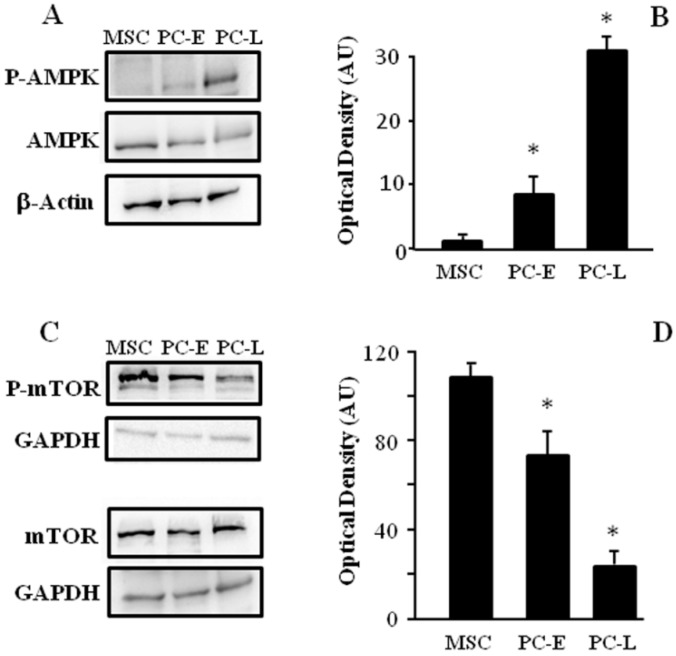
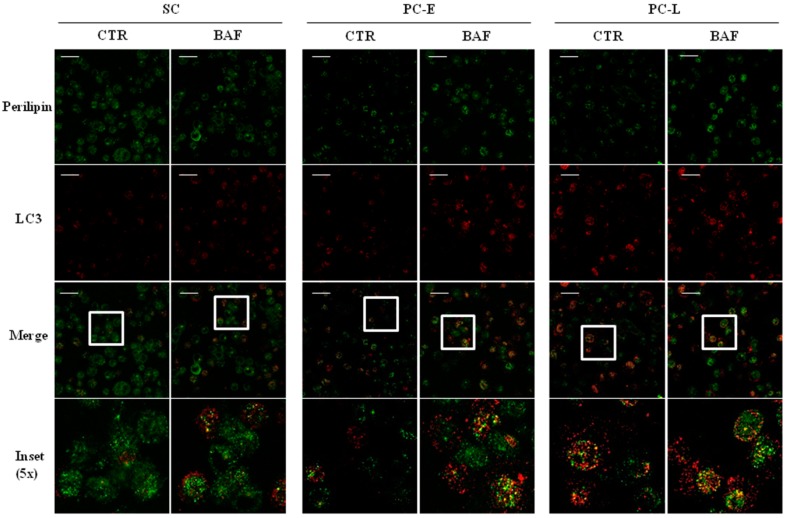
Cancer stem cells (CSC) represent a key cellular subpopulation controlling biological features such as cancer progression in all cancer types. By using melanospheres established from human melanoma patients, we compared less differentiated melanosphere-derived CSC to differentiating melanosphere-derived cells. Increased lipid uptake was found in melanosphere-derived CSC vs. differentiating melanosphere-derived cells, paralleled by strong expression of lipogenic factors Sterol Regulatory Element-Binding Protein-1 (SREBP-1) and Peroxisome Proliferator-Activated Receptor-γ (PPAR-γ). An inverse relation between lipid-storing phenotype and autophagy was also found, since microtubule-associated protein 1A/1B-Light Chain 3 (LC3) lipidation is reduced in melanosphere-derived CSC. To investigate upstream autophagy regulators, Phospho-AMP activated Protein Kinase (P-AMPK) and Phospho-mammalian Target of Rapamycin (P-mTOR) were analyzed; lower P-AMPK and higher P-mTOR expression in melanosphere-derived CSC were found, thus explaining, at least in part, their lower autophagic activity. In addition, co-localization of LC3-stained autophagosome spots and perilipin-stained lipid droplets was demonstrated mainly in differentiating melanosphere-derived cells, further supporting the role of autophagy in lipid droplets clearance. The present manuscript demonstrates an inverse relationship between lipid-storing phenotype and melanoma stem cells differentiation, providing novel indications involving autophagy in melanoma stem cells biology.

Keywords: autophagy; lipids; melanoma; stem cells.


Conflict of interest statement

The authors declare no conflict of interest.

Figures

Figure 1
Figure 1
CD133 antigen (also known as prominin-1) expression and lipid-storing phenotype in melanosphere-derived cells. (A) CD133 marker is up-regulated in melanosphere-derived cancer stem cells (MSC). MSC and differentiating melanosphere-derived melanoma cells Early and Late (PC-E and PC-L) were lysed; protein samples were subjected to Western blot analyses and CD133 was detected. Western blot panel is representative of three independent experiments and reveal CD133 progressive down-regulation in melanoma cells undergoing progressive differentiation. β-Actin was used as a loading control. Densitometric analyses of CD133 relative to β-Actin in three independent experiments are presented in the graph as the mean ± s.d. expressed as Arbitrary Units (AU). * indicates p ≤ 0.05 vs. MSC; (B) Lipid Droplets (LD) staining is higher in MSC. MSC, PC-E and PC-L were stained with Oil Red O and then observed by bright-field microscopy. The images shown are representative of three independent experiments and reveal reduction in LD color intensity with melanoma cell differentiation. Bar corresponds to 35 μm; (C) MSC display increased lipid up-take. Increase of Nile Red (NR)-stained neutral lipids was evaluated by flow-cytometry after oleic acid treatment in MSC, PC-E and PC-L and reported in the graph as FL2 fluorescence fold increase vs. untreated cells. The data shown are the mean ± s.d. of three independent experiments. * indicates p ≤ 0.05 vs. MSC.
Figure 2
Figure 2
MSC express higher PPAR-γ and SREBP-1 levels as compared to PC-E and PC-L. MSC, PC-E and PC-L were lysed and protein samples were subjected to Western blot analyses using Glyceraldehyde 3-Phosphate Dehydrogenase (GAPDH) as a loading control. Representative panels of: PPAR-γ (A); and SREBP-1 (C) are shown. Densitometric analyses of: PPAR-γ (B); and SREBP-1 (D) relative to GAPDH in three independent experiments are presented in the graph as the mean ± s.d. expressed as Arbitrary Units (AU). PPAR-γ and SREBP-1 show down-regulation in melanoma cells undergoing progressive differentiation. * indicates p ≤ 0.05 in PC vs. MSC.
Figure 3
Figure 3
LC3-II increases in melanoma cells undergoing progressive differentiation revealing autophagic flux up-regulation. (A) MSC, PC-E and PC-L were cultured in the presence or absence of the lysosomal degradation inhibitor bafilomycin A1 (BAF). They were lysed and protein samples were subjected to Western blot analysis. LC3-II increase in differentiated melanoma cells, although evident in either case, is more evident after BAF treatment, thus demonstrating autophagic flux up-regulation as function of time of differentiation. Western blot panel is representative of three independent experiments. β-Actin was used as a loading control; (B) densitometric analysis of LC3-II relative to β-Actin in three independent experiments is presented in the graph as the mean ± s.d. expressed as AU. BAF-treated MSC vs. untreated MSC display significant increase (p ≤ 0.05). Similarly, ΒΑF treated PC-E vs. untreated PC-E display significant increase (p ≤ 0.05). ** indicates p ≤ 0.05 in BAF-treated PC vs. BAF-treated MSC. * indicates p ≤ 0.05 in untreated PC vs. untreated MSC.
Figure 4
Figure 4
AMPK and mTOR phosphorylation levels change with melanoma cell differentiation. MSC, PC-E and PC-L were lysed and protein samples were subjected to Western blot using β-Actin or GAPDH as a loading control. Representative panels of P-AMPK and AMPK (A); and P-mTOR and m-TOR (C) are shown; (B,D) densitometric analyses of P-AMPK/AMPK and P-mTOR relative to the corresponding loading control, respectively, reveal progressive P-AMPK/AMPK increase and progressive P-mTOR decrease as function of time of differentiation. Data are presented as the mean ± s.d. expressed as AU of three independent experiments. * indicates p ≤ 0.05 in PC vs. MSC.
Figure 5
Figure 5
LC3-stained autophagosome spots co-localize with perilipin-stained LD suggesting LD clearance through autophagy. Immunofluorescence for perilipin (green) or LC3 (red) was performed on MSC, PC-E and PC-L, cultured in the absence (CTR) or presence of the lysosomal degradation inhibitor bafilomycin A1 (BAF). Yellow spots, indicating LC3-perilipin co-localization, increase as function of differentiation and are more evident in BAF-treated cells. Representative images of three experiments. All images were taken at the same magnification Bar corresponds to 60 μm. Insets correspond to further 5× enlargement.

References

    1. Singh S., Zafar A., Khan S., Naseem I. Towards therapeutic advances in melanoma management: An overview. Life Sci. 2017;174:50–58. doi: 10.1016/j.lfs.2017.02.011. - DOI - PubMed
    1. Sette G., Fecchi K., Salvati V., Lotti F., Pilozzi E., Duranti E., Biffoni M., Pagliuca A., Martinetti D., Memeo L., et al. Mek inhibition results in marked antitumor activity against metastatic melanoma patient-derived melanospheres and in melanosphere-generated xenografts. J. Exp. Clin. Cancer Res. 2013;32:91. doi: 10.1186/1756-9966-32-91. - DOI - PMC - PubMed
    1. Ailles L.E., Weissman I.L. Cancer stem cells in solid tumors. Curr. Opin. Biotechnol. 2007;18:460–466. doi: 10.1016/j.copbio.2007.10.007. - DOI - PubMed
    1. Cojoc M., Mabert K., Muders M.H., Dubrovska A. A role for cancer stem cells in therapy resistance: Cellular and molecular mechanisms. Semin. Cancer Biol. 2015;31:16–27. doi: 10.1016/j.semcancer.2014.06.004. - DOI - PubMed
    1. Johnson D.L., Stiles B.L. Maf1, a new PTEN target linking RNA and lipid metabolism. Trends Endocrinol. Metab. 2016;27:742–750. doi: 10.1016/j.tem.2016.04.016. - DOI - PMC - PubMed

Substances