. 2017 Jun 15;13(6):e1005578.
doi: 10.1371/journal.pcbi.1005578. eCollection 2017 Jun.

Robust transmission of rate coding in the inhibitory Purkinje cell to cerebellar nuclei pathway in awake mice

Affiliations

Robust transmission of rate coding in the inhibitory Purkinje cell to cerebellar nuclei pathway in awake mice

Samira Abbasi et al. PLoS Comput Biol. .

Abstract

Neural coding through inhibitory projection pathways remains poorly understood. We analyze the transmission properties of the Purkinje cell (PC) to cerebellar nucleus (CN) pathway in a modeling study using a data set recorded in awake mice containing respiratory rate modulation. We find that inhibitory transmission from tonically active PCs can transmit a behavioral rate code with high fidelity. We parameterized the required population code in PC activity and determined that 20% of PC inputs to a full compartmental CN neuron model need to be rate-comodulated for transmission of a rate code. Rate covariance in PC inputs also accounts for the high coefficient of variation in CN spike trains, while the balance between excitation and inhibition determines spike rate and local spike train variability. Overall, our modeling study can fully account for observed spike train properties of cerebellar output in awake mice, and strongly supports rate coding in the cerebellum.


Conflict of interest statement

The authors have declared that no competing interests exist.

Figures

Fig 1
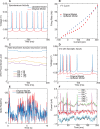
Fig 1. Purkinje cell AST construction from rate templates.
Matching AST properties with recorded PC spike trains. A. The slow rate function calculated from a single recorded PC spike train (black) and of a sample AST sampled with a gamma distribution from the adaptive Gaussian rate function of this PC (see Methods). The AST generally matches slow rate modulations of the recorded PC. To highlight this match a representative time window of 10s out of the complete 115s spike train of the Purkinje cell recording was chosen. The mean difference between the recorded PC and AST rate functions over the complete 115s was 6.9 Hz (calculated as root mean square error–RMSE) B. The high frequency rate function was obtained by dividing the normalized adaptive rate function by the normalized slow rate function in order to isolate fast rate fluctuations. The AST matches the recorded fast fluctuations qualitatively, but not their exact time course. This is due to the random drawing of gamma ISIs in the creation of ASTs as fast fluctuations reflect this random process. To highlight this match for fast frequencies a representative time window of 1s out of the complete 115s spike train of the Purkinje cell recording was chosen. The time window shown corresponds to the 0-1s window in panel A. C. The ISI distribution of the 115s PC recording and of the refractory period corrected gamma AST are shown. The small mean difference in the ISI density of 0.0059 per bin (RMSE) indicates a good match between the recorded spike train and the AST derived from its rate function. D. The power spectrum of the same sample spike train shown in A-C (black) and of the AST constructed from the adaptive rate template (red). The match between 0 and 20 Hz is primarily due to the shared slow rate function and for faster frequencies is due to the fast rate function and to random gamma ISIs being matched to the shape parameter (LV) of the recorded spike train. The mean difference in Log Power across all frequencies was 0.072 (RMSE). E. The CV of recorded PC spike trains always exceeded the LV (dashed line marks unity) and exceeded the value of 1.0 for Poisson spike trains in some cases. ASTs (50 blue dots in a dense cluster) generated from a particular PC spike train (cyan asterisk) show the LV of the recording and a slightly diminished CV. F. The histogram shows the mean firing rate distribution of the 21 recorded PCs.
Fig 2
Fig 2. Properties of biophysical CN model.
A. Spontaneous spiking in the absence of synaptic input. The original model is as published on ModelDB (https://senselab.med.yale.edu/modeldb/ShowModel.cshtml?model=136175), while the updated model includes the changes described in the Supplemental Materials of the original publication [7]. B. The model spike rate as a function of injected current. The rate was calculated as the inverse of the mean ISI over 1 s of injected current following 1 s of spike rate equilibration with the same current level. C. Synaptic depression levels in updated model during a sample period of 200 ms. The fraction of maximal synaptic conductance that is present in the absence of depression is shown for a sample PC to CN synapse activated randomly at the rates shown after steady state depression levels are reached. Each incremental change in depression is the result of the length of the preceding ISI in the PC input. (compare to Fig 2B in [20]). D. Vm trace comparison of original and updated model when subjected to the same mixed pattern of excitatory and inhibitory input (50 PC ASTs w/ Gin of 6 nS and 48 MF ASTs w/ Gex of 2 nS. The GABA reversal potential of the original model is -80 mV, which is 10 mV more hyperpolarized than in the updated model). The spike times of both models similarly tied to fluctuations in inhibition and excitation. E. The spike rate of both models for the same set of input ASTs is similarly modulated. F. Synaptic currents in the model for the segment of activity shown in D). Note that the net (In) current, i.e. the sum of inhibitory and excitatory current is inward. Spikes in the inhibitory current are due to large driving force shifts during an action potential in the soma.
Fig 3
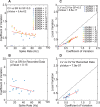
Fig 3. Model spike train statistics with PC and MF AST input matching recordings.
A. Model spike rates for different gain factors in the unitary inhibitory input conductance (Gin) as a function of unitary excitatory input conductance (Gex). There is little effect of 100% (SF = 0), and 0% (SF = 1) rate covariance between PC inputs on spike rate (symbols are superposed in many cases). B. The model spike train CV as a function of spike rate (SR) for different values of Gin and SF. Note that the CV for a given SR increases with increasing Gin and with decreasing SF. C. The LV also decreases with SR and decreasing Gin. It is much less dependent on SF than CV because it is not sensitive to slow rate changes that result from rate covariance in the inputs. D. LV and CV are highly correlated, but the LV of model spiking is always lower than CV (dashed black line denotes unity).
Fig 4
Fig 4. The CN model neuron spike statistics using different Gin and Gex combinations fit the distribution of recorded spike train statistics.
A. Model CV significantly decreases with SR (p-value for linear regression is given). Variability at any given SR is introduced by different values of Gin / Gex such that higher total conductances result in a higher CV. B. The recorded CN neurons show a similar CV vs SR relationship but the CV variability at any given SR is higher. Each cross presents the mean SR of one recorded neuron. C,D. Model and data show a strong linear correlation between LV and CV. The recorded population is best matched by models employing inputs with a SF of 0.5 (subset of Fig 3D).
Fig 5
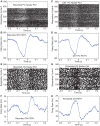
Fig 5. Recorded and simulated peri-stimulus time histograms (PSTH) for respiration.
The median respiratory interval in our data set was 242 ms (respiratory frequency of 3.9 Hz), therefore approximately one full respiratory cycle is shown to each side of the event trigger. A,B. Spike raster plot for sample PC recording (top) and average PSTH (bottom). C,D. Spike raster plot for PC AST made from the shown sample average PSTH (A) convolved into the rate template from a different recorded PC without respiratory modulation at the time of each respiratory event. E,F. Raster plot (top) and average PSTH (bottom) of a sample CN neuron aligned to respiration. Note that this CN neuron is not recorded at the same time and its phase of modulation is not driven by the PC neuron shown in panel A,B. G,H. Simulated CN neuron respiratory PSTH resulting from simulation with 50% of PC inputs incorporating respiratory modulation as depicted in C,D). The dot sizes in the raster plots were adapted to the mean rate of each spike train to best depict modulation. Note that the phase of the modulation in the CN simulation is not targeted to match the phase of the CN recording, but is the inverse of the phase of respiratory modulation in the PC ASTs (Fig 5D) due to the inhibitory nature of PC inputs onto CN neurons.
Fig 6
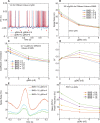
Fig 6. Model PSTH as a function of input AST properties.
A. The average respiratory modulation in the spike output smoothly varies with the amplitude of respiratory modulation in the inputs (behavioral modulation strength (BMS): gain factor between 0 and 2 applied to the respiratory rate modulation of the sample recording from which ASTs were generated (Fig 5A and 5B)). The Gin was 16 nS, and the model was tested for 2 spike rates achieved with a high level of 6 nS and a low level of 3.5 nS for Gex. B. The amplitude of respiratory spike train modulation was scored as the mean frequency increase during the peak. The output spike frequency increase is nearly linear with increasing BMS of the inputs. The slope of this line is a function of the fraction of modulated inputs (BMF). The SF in the background rate covariance has little effect on the PSTH, but the frequency increases are higher when the baseline spike rate is 60 Hz than when it is 20 Hz. C,D. The CV and LV as a function of BMS for two values of BMF and 2 levels of excitation Gex: H(igh) resulting in a 60 Hz baseline, and Gex: L(ow) resulting in a 20 Hz baseline (see A). The CV is moderately affected by increasing BMS when the baseline spike rate is low.
Fig 7
Fig 7. Comparison of CN simulations with 500 vs. 50 PC AST inputs.
A. The unitary conductance was divided by 10 for 500 inputs to result in a matching mean inhibitory input conductance. B,D,E. Conventions as in Fig 6. C. The 500 PC inputs lead to a much reduced spike rate. F. Difference between (E) and Fig 6B. PSTH mean peak frequency changes are generally similar, but higher by up to 14 Hz for Gex: L with 50 PC inputs.
Fig 8
Fig 8. Effect of SK conductance density on model output.
A. Sample period of spiking for zero (red trace) and 8 nS (blue trace) somatic gSk. Red arrows point to respiratory event times. Blue arrow points to a sample spike afterhyperpolarization (AHP), showing increased AHP depth for high gSK. B. Spike rate for identical AST inputs diminishes with increasing gSK. The behavioral modulation strength (BMS) has a minor effect on SR. C. The CV diminishes for increasing gSK. D. The LV shows a maximum for a gSKs around 4 nS. For a high gSKs the BMS has a noticeable effect on LV. E, F. The PSTH peak is diminished for higher values of gSKs.

References

    1. Georgopoulos AP, Kalaska JF, Caminiti R, Massey JT (1982) On the relations between the direction of two-dimensional arm movements and cell discharge in primate motor cortex. JNeurosci 2: 1527–1537. - PMC - PubMed
    1. Eliasmith C, Stewart TC, Choo X, Bekolay T, DeWolf T, et al. (2012) A Large-Scale Model of the Functioning Brain. Science 338: 1202–1205. doi: 10.1126/science.1225266 - DOI - PubMed
    1. Walter JT, Khodakhah K (2006) The linear computational algorithm of cerebellar Purkinje cells. Journal of Neuroscience 26: 12861–12872. doi: 10.1523/JNEUROSCI.4507-05.2006 - DOI - PMC - PubMed
    1. Walter JT, Khodakhah K (2009) The advantages of linear information processing for cerebellar computation. Proceedings of the National Academy of Sciences of the United States of America 106: 4471–4476. doi: 10.1073/pnas.0812348106 - DOI - PMC - PubMed
    1. Cao Y, Maran SK, Dhamala M, Jaeger D, Heck DH (2012) Behavior-Related Pauses in Simple-Spike Activity of Mouse Purkinje Cells Are Linked to Spike Rate Modulation. Journal of Neuroscience 32: 8678–8685. doi: 10.1523/JNEUROSCI.4969-11.2012 - DOI - PMC - PubMed

LinkOut - more resources