. 2017 Jun 1;22(6):66008.
doi: 10.1117/1.JBO.22.6.066008.

Optical coherence tomography angiography-based capillary velocimetry

Affiliations

Optical coherence tomography angiography-based capillary velocimetry

Ruikang K Wang et al. J Biomed Opt. .

Abstract

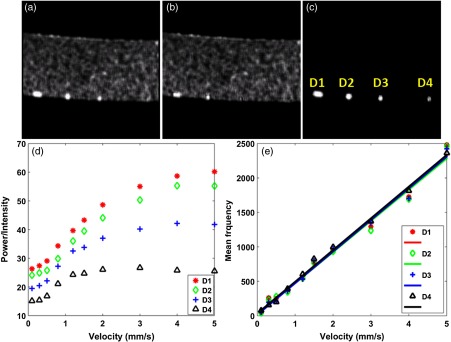
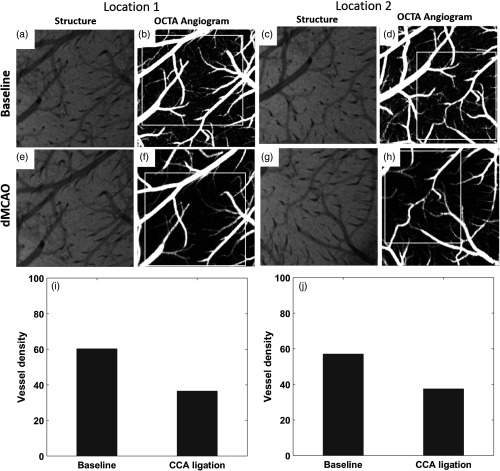
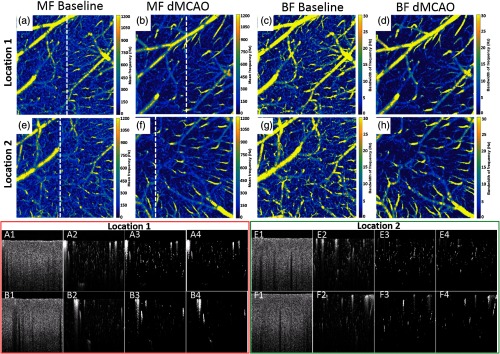
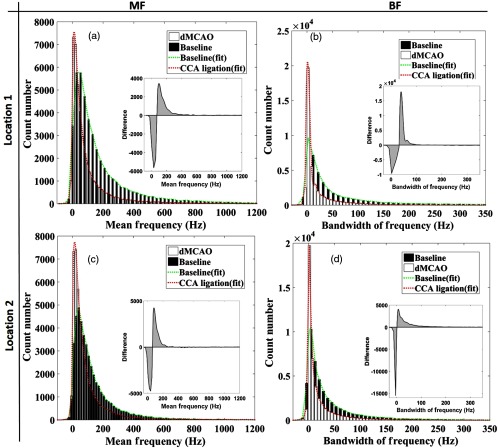
Challenge persists in the field of optical coherence tomography (OCT) when it is required to quantify capillary blood flow within tissue beds in vivo. We propose a useful approach to statistically estimate the mean capillary flow velocity using a model-based statistical method of eigendecomposition (ED) analysis of the complex OCT signals obtained with the OCT angiography (OCTA) scanning protocol. ED-based analysis is achieved by the covariance matrix of the ensemble complex OCT signals, upon which the eigenvalues and eigenvectors that represent the subsets of the signal makeup are calculated. From this analysis, the signals due to moving particles can be isolated by employing an adaptive regression filter to remove the eigencomponents that represent static tissue signals. The mean frequency (MF) of moving particles can be estimated by the first lag-one autocorrelation of the corresponding eigenvectors. Three important parameters are introduced, including the blood flow signal power representing the presence of blood flow (i.e., OCTA signals), the MF indicating the mean velocity of blood flow, and the frequency bandwidth describing the temporal flow heterogeneity within a scanned tissue volume. The proposed approach is tested using scattering phantoms, in which microfluidic channels are used to simulate the functional capillary vessels that are perfused with the scattering intralipid solution. The results indicate a linear relationship between the MF and mean flow velocity. In vivo animal experiments are also conducted by imaging mouse brain with distal middle cerebral artery ligation to test the capability of the method to image the changes in capillary flows in response to an ischemic insult, demonstrating the practical usefulness of the proposed method for providing important quantifiable information about capillary tissue beds in the investigations of neurological conditions in vivo.


Figures

Fig. 1
Fig. 1
The distribution of spatial tissue signals within OCT images captured from cerebral cortex in rodents. (a) Representative B-scan image. (b) and (c) The signal distribution within region 1 and region 2 marked in (a), respectively. The distribution of tissue signal in a smaller region approaches a Gaussian shape.
Fig. 2
Fig. 2
Typical eigenvalue spectrum, where 30 eigenvalues are analyzed for the signals representing static tissue components, dynamic motion signal, and noise. The OCT signals are captured from the cortical tissue of a rodent.
Fig. 3
Fig. 3
The relationship between frequency and eigenvalue (eigenvector) presented in box-whisker plot form. The results were obtained and evaluated from 10 3-D scans of rodent brain in vivo.
Fig. 4
Fig. 4
Cross-sectional view of the microfluidic phantom. Four microfluidic channels with the sizes as shown were fabricated at the interface between the channel body and the substrate of glass slide. The channel body was fabricated with polydimethylsiloxane (PDMS) mixed with TiO2 powder to mimic static tissue surrounding blood vessels.
Fig. 5
Fig. 5
The ED-algorithm is capable of measuring the mean flow velocity in the microfluidic channels. (a) The structure OCT image, (b) static tissue signal image, and (c) OCTA flow image of the scanned microfluidic phantom. (d) The relationship between velocity and OCTA signal power within four channels. (e) The relationship between velocity and MF for four channels. A same linear relationship between MF and velocity is found with squared Pearson’s correlation coefficient of 0.983 of D1 channel, 0.982 of D2 channel, 0.970 of D3 channel, and 0.920 of D4 channel among all the given velocities.
Fig. 6
Fig. 6
The ED-based algorithm is capable of visualizing and quantifying the changes in capillary vessel density after the dMCA ligation in the mouse brain. The results are presented for two selected locations (left: location 1 and right: location 2) within the dMACO affected brain regions before (top row) and after (middle row) the dMCA ligation. (a, c, e, g) The reflectance and (b, d, f, h) OCTA enface images are given side-by-side. For quantification of vessel density, the ROIs (marked as white boxes) are selected through coregistration of OCTA angiograms obtained at location 1 (b, e) and location 2 (d, h) for the comparison between baseline and dMCAO. The quantification results are shown in (i) for location 1 and (j) for location 2. A reduction of vessel density about 30 percent was found for both ROIs after the dMCA ligation. The enface image size is 1.4×1.4  mm2.
Fig. 7
Fig. 7
The ED-based algorithm is capable of visualizing and quantifying the changes in capillary flows after the dMCA ligation in the mouse brain. (a, b, e, and f) The MF maps and (c, d, g and h) BF maps are given for both locations 1 and 2. The cross-sectional images of structural, blood flow, MF, and its bandwidth at the positions marked as dashed line in (a, b, e, and f) are given at the bottom row for locations 1 and 2, respectively. Location 1 (red box): before ligation, (a1 to a4); after ligation: (b1 to b4). Location 2 (green box): before ligation, (e1 to e4); after ligation: (f1 to f4). The enface image size is 1.4×1.4  mm2.
Fig. 8
Fig. 8
Statistical analyses for capillary blood flow response to the ischemic injury for both locations 1 and 2. The same ROI is chosen before and after the dMCA ligation (see Fig. 6 for ROIs used for quantification). The quantification was performed to provide histogram distribution of the (a, c) MF and (b, d) BF, which indicate the spatial heterogeneity of capillary flows. The BF map indicates directly the temporal heterogeneity of the flow. The insets are the results of differentiation between the histogram functions before and after the dMCA ligation, where the negative value in the curve indicates the increase of the probability within this region, and the positive indicates the opposite. The enface image size is 1.4×1.4  mm2.

References

    1. Fercher A., et al. , “Optical coherence tomography-principles and applications,” Rep. Prog. Phys. 66(2), 239–303 (2003).RPPHAG10.1088/0034-4885/66/2/204 - DOI
    1. Tomlins P. H., Wang R. K., “Theory, developments and applications of optical coherence tomography,” J. Phys. D Appl. Phys. 38(15), 2519 (2005).10.1088/0022-3727/38/15/002 - DOI
    1. Drexler W., et al. , “Ultrahigh-resolution ophthalmic optical coherence tomography,” Nat. Med. 7(4), 502–507 (2001).10.1038/86589 - DOI - PMC - PubMed
    1. Leitgeb R., Hitzenberger C. K., Fercher A. F., “Performance of Fourier domain vs. time domain optical coherence tomography,” Opt. Express 11(8), 889–894 (2003).OPEXFF10.1364/OE.11.000889 - DOI - PubMed
    1. Choma M. A., et al. , “Sensitivity advantage of swept source and Fourier domain optical coherence tomography,” Opt. Express 11(18), 2183–2189 (2003).OPEXFF10.1364/OE.11.002183 - DOI - PubMed