. 2017 Sep;65(9):1504-1520.
doi: 10.1002/glia.23176. Epub 2017 Jun 15.

Generation of a microglial developmental index in mice and in humans reveals a sex difference in maturation and immune reactivity

Affiliations

Generation of a microglial developmental index in mice and in humans reveals a sex difference in maturation and immune reactivity

Richa Hanamsagar et al. Glia. 2017 Sep.

Erratum in

Abstract

Evidence suggests many neurological disorders emerge when normal neurodevelopmental trajectories are disrupted, i.e., when circuits or cells do not reach their fully mature state. Microglia play a critical role in normal neurodevelopment and are hypothesized to contribute to brain disease. We used whole transcriptome profiling with Next Generation sequencing of purified developing microglia to identify a microglial developmental gene expression program involving thousands of genes whose expression levels change monotonically (up or down) across development. Importantly, the gene expression program was delayed in males relative to females and exposure of adult male mice to LPS, a potent immune activator, accelerated microglial development in males. Next, a microglial developmental index (MDI) generated from gene expression patterns obtained from purified mouse microglia, was applied to human brain transcriptome datasets to test the hypothesis that variability in microglial development is associated with human diseases such as Alzheimer's and autism where microglia have been suggested to play a role. MDI was significantly increased in both Alzheimer's Disease and in autism, suggesting that accelerated microglial development may contribute to neuropathology. In conclusion, we identified a microglia-specific gene expression program in mice that was used to create a microglia developmental index, which was applied to human datasets containing heterogeneous cell types to reveal differences between healthy and diseased brain samples, and between males and females. This powerful tool has wide ranging applicability to examine microglial development within the context of disease and in response to other variables such as stress and pharmacological treatments.

Keywords: development; microglia; sex differences; whole transcriptome analysis.


Conflict of interest statement

The authors declare no competing financial interests.

Figures

Figure 1
Figure 1. Sex differences in immune modulation of microglial developmental programs
(a) Hippocampal microglia isolated from male and female mice at different developmental time points were subjected to RNA extraction and Next Generation sequencing. (b) A total of 4645 genes were found to be down-regulated over development whereas 3038 genes were up-regulated from E18 to P60 in mouse microglia. (c) Developmental indices were created by taking the ratio of the average scaled expression levels of genes that were up-regulated during development in microglia, divided by the average expression levels of all down-regulated genes. (d) Line graph plots microglia index (MDI) across development against log2 age in weeks post conception (Non-linear fit, MDI R2 = 0.8525). (e) In order to validate the robustness of the index, gene group size was progressively increased 2-fold from 2 to 256 up- and down-regulated genes. (f) MDI was calculated from transcriptome data of mouse male and female microglia obtained from different developmental time points (E18, P4, P4 and P60, n = 4–10 per group, two-way ANOVA, post-hoc * p < 0.05). (g) Log fold-changes in gene expression between males and females at P60 were compared to those of P60vsE18 (developmental gene expression changes) to obtain positive correlation (Linear regression, Pearson’s r = 0.3311, *** p < 0.0001).
Figure 2
Figure 2. Sex differences in microglial response to LPS
(a) C57BL/6 male and female P60 mice were sacrificed 2 hours after saline or LPS (330 ug/kg, i.p.) injections following which microglia were isolated from the hippocampus and subject to RNA sequencing. (b) Out of the total number of genes changed in males and females following LPS treatment, about 21% (10% up and 11% down) were changed significantly in males (vs. male SAL), and 16% (5% up and 11% down) were changed significantly in females (vs. female SAL). (c) Microglial developmental index was calculated for P60 samples as described above (two-way ANOVA, post-hoc * p < 0.05, n = 6–8 per group). (d) Gene expression changes between P14 and E18 were compared with those in P60 vs. P4 (black line, linear regression, Pearson’s r = 0.48, *** p < 0.0001), P60 females vs. males (purple line, linear regression, Pearson’s r = 0.33, *** p < 0.0001), P60 male LPS vs. SAL (blue line, linear regression, Pearson’s r = 0.31, *** p < 0.0001) and P60 female LPS vs. SAL (red line, linear regression, Pearson’s r = 0.0.1, not significant).
Figure 3
Figure 3. Gene expression changes in microglia following an immune challenge are related to development
Top 1000 genes were selected between different group comparisons to input into DAVID gene functional annotation software (https://david.ncifcrf.gov/tools.jsp). Top 7 highly enriched gene functional groups were chosen for representation of group differences: (a) P60 vs. E18, (b) P60 females vs. males, (c) P60 male LPS vs. SAL, (d) P60 female LPS vs. SAL. Immune response genes are represented as green bars, membrane protein and signaling molecules as red bars, cell motility genes as purple bars and miscellaneous genes as orange bars. (e) Heat map of gene expression changes depicts up- or down-regulation of individual genes in different group comparisons. Red = up-regulation, blue = down-regulation.
Figure 4
Figure 4. Sex differences in MDI strongly correlate with morphology
(a) C57BL/6 male and female P60 mice were sacrificed 2 hours after saline or LPS (330 ug/kg, i.p.) injections following which brains were post-fixed in 4% PFA and processed for immunostaining. Brain slices (40 μm) were stained with the P2Y12 marker for microglia, and imaged on a confocal microscope at 100X magnification. 3D reconstruction was performed and filament tracings were carried out using Imaris software. 2–3 microglia per slice, 2–3 slices per brain and 3–4 brains per group were analyzed. (b, c) Using Sholl analysis, number of branches and intersections were measured at increasing distances from the soma. Values for every animal were averaged (two-way ANOVA, post hoc p < 0.05). (d) Total process volume and total process area were calculated using Imaris software for each microglia, and averaged across cells and slices for every sample (two-way ANOVA, post hoc p < 0.05). (e) Averaged microglial developmental index for a group was correlated to the averaged microglial process area for each sample (Correlation, Pearson’s R = 0.4952, ** p < 0.0016).
Figure 5
Figure 5. Microglial developmental index applied to transcriptomes from heterogeneous brain tissue
(a) Four different human brain dataset platforms were selected for validation purposes: Brain Span dataset (http://www.brainspan.org/static/download.html), human brain developmental datasest (BRAIN DEVL_GSE25219), Alzheimer’s dataset (ALZ_GSE5281) and Autism dataset (AUTISM GSE28521). There were 3,415 genes detected across all platforms of which 644 were up-regulated in our full MDI, 1,283 were down-regulated, and 1,488 were not used to calculate MDI because they were not significantly developmentally regulated in purified microglia. (b) The effect of index size on the correlation between independent indices was measured. Gene group size was progressively increased by 2-fold from 2 to 256 up- and down-regulated genes. MDI was calculated on these independent sets of genes and results were correlated. (c) Common genes across 4 different platforms (and used in purified microglia index) were identified to generate the new indices for heterogeneous tissue. The gene expression was then correlated to its respective MDI for every sample in both pure microglia and heterogeneous human sample. The two correlates (gene expression with heterogeneous and pure microglia MDI) were further compared to obtain a highly significant positive correlation between pure and heterogeneous tissue (Pearson’s correlation; Alzheimer’s disease GSE5281 R2 = 0.12 ***, p < 0.001; Autism GSE28521 R2 = 0.05 ***, p < 0.001; Brain developmental dataset GSE2519 R2 = 0.03 ***, p <0.001; BrainSpan R2 = 0.12 ***, p < 0.001). (d) The subindex calculated above was used to track microglial development in two human brain developmental data sets. Data were fit using least squares fitting to a log(agonist) vs. response curve (Nonlinear fit, Brain Development GSE25219: MGLA IDX – R2 = 0.8057; BrainSpan: MGLA IDX – R2 = 0.5837).
Figure 6
Figure 6. MDI is accelerated in brains of Alzheimer’s disease and autism patients
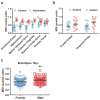
MDI was quantified from gene expression data of patients with (a) Alzheimer’s disease (GSE5281, two-way ANOVA, Region p< 0.0001; Disease p < 0.0001) and (b) autism (GSE28521, two-way ANOVA, MDI * p < 0.05) and compared to controls as discussed above. For both, results remained significant after controlling for age-related and regional variability (p<0.05). (c) MDI was calculated using data from adult males and females (18y+, BrainSpan developmental dataset).

Similar articles

Cited by

References

    1. Alter MD. Studying gene expression system regulation at the program level. PLoS One. 2013;8(4):e61324. doi: 10.1371/journal.pone.0061324. - DOI - PMC - PubMed
    1. Blank T, Prinz M. Microglia as modulators of cognition and neuropsychiatric disorders. Glia. 2013;61(1):62–70. doi: 10.1002/glia.22372. - DOI - PubMed
    1. Buchstaller J, Sommer L, Bodmer M, Hoffmann R, Suter U, Mantei N. Efficient isolation and gene expression profiling of small numbers of neural crest stem cells and developing Schwann cells. J Neurosci. 2004;24(10):2357–2365. doi: 10.1523/JNEUROSCI.4083-03.2004. - DOI - PMC - PubMed
    1. Cahoy JD, Emery B, Kaushal A, Foo LC, Zamanian JL, Christopherson KS, … Barres BA. A transcriptome database for astrocytes, neurons, and oligodendrocytes: a new resource for understanding brain development and function. J Neurosci. 2008;28(1):264–278. doi: 10.1523/JNEUROSCI.4178-07.2008. - DOI - PMC - PubMed
    1. Canetta S, Bolkan S, Padilla-Coreano N, Song LJ, Sahn R, Harrison NL, … Kellendonk C. Maternal immune activation leads to selective functional deficits in offspring parvalbumin interneurons. Mol Psychiatry. 2016;21(7):956–968. doi: 10.1038/mp.2015.222. - DOI - PMC - PubMed

Substances