

Outcomes of PCI in Relation to Procedural Characteristics and Operator Volumes in the United States
- PMID: 28619191
- PMCID: PMC5784411
- DOI: 10.1016/j.jacc.2017.04.032
Outcomes of PCI in Relation to Procedural Characteristics and Operator Volumes in the United States
Abstract
Background: Professional guidelines have reduced the recommended minimum number to an average of 50 percutaneous coronary intervention (PCI) procedures performed annually by each operator. Operator volume patterns and associated outcomes since this change are unknown.
Objectives: The authors describe herein PCI operator procedure volumes; characteristics of low-, intermediate-, and high-volume operators; and the relationship between operator volume and clinical outcomes in a large, contemporary, nationwide sample.
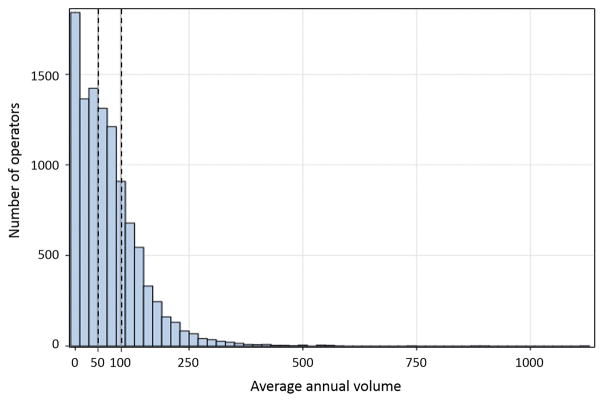
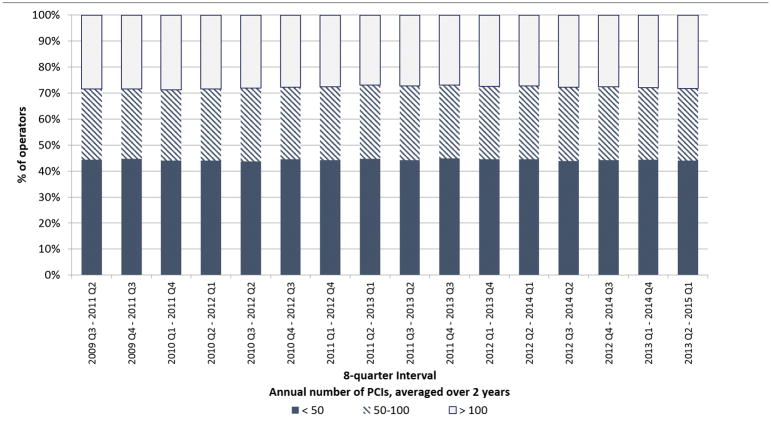
Methods: Using data from the National Cardiovascular Data Registry collected between July 1, 2009, and March 31, 2015, we examined operator annual PCI volume. We divided operators into low- (<50 PCIs per year), intermediate- (50 to 100 PCIs per year), and high- (>100 PCIs per year) volume groups, and determined the adjusted association between annual PCI volume and in-hospital outcomes, including mortality.
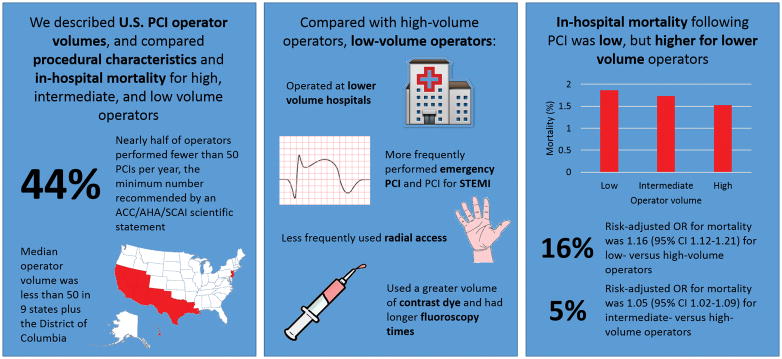
Results: The median annual number of procedures performed per operator was 59; 44% of operators performed <50 PCI procedures per year. Low-volume operators more frequently performed emergency and primary PCI procedures and practiced at hospitals with lower annual PCI volumes. Unadjusted in-hospital mortality was 1.86% for low-volume operators, 1.73% for intermediate-volume operators, and 1.48% for high-volume operators. The adjusted risk of in-hospital mortality was higher for PCI procedures performed by low- and intermediate-volume operators compared with those performed by high-volume operators (adjusted odds ratio: 1.16 for low versus high; adjusted odds ratio: 1.05 for intermediate vs. high volume) as was the risk for new dialysis post PCI. No volume relationship was observed for post-PCI bleeding.
Conclusions: Many PCI operators in the United States are performing fewer than the recommended number of PCI procedures annually. Although absolute risk differences are small and may be partially explained by unmeasured differences in case mix between operators, there remains an inverse relationship between PCI operator volume and in-hospital mortality that persisted in risk-adjusted analyses.
Keywords: bleeding; mortality; myocardial infarction; volume-outcome relationship.
Copyright © 2017 American College of Cardiology Foundation. Published by Elsevier Inc. All rights reserved.
Figures
Comment in
-
PCI Volume Benchmarks: Still Adequate for Quality Assessment in 2017?J Am Coll Cardiol. 2017 Jun 20;69(24):2925-2928. doi: 10.1016/j.jacc.2017.04.050. J Am Coll Cardiol. 2017. PMID: 28619192 No abstract available.
References
-
- Maroney J, Khan S, Powell W, Klein LW. Current operator volumes of invasive coronary procedures in medicare patients: Implications for future manpower needs in the catheterization laboratory. Catheterization and Cardiovascular Interventions. 2013;81:34–39. - PubMed
-
- Kim LK, Feldman DN, Swaminathan RV, et al. Rate of percutaneous coronary intervention for the management of acute coronary syndromes and stable coronary artery disease in the United States (2007 to 2011) Am J Cardiol. 2014;114:1003–1010. - PubMed
-
- Harold JG, Bass TA, Bashore TM, et al. ACCF/AHA/SCAI 2013 update of the clinical competence statement on coronary artery interventional procedures. J Am Coll Cardiol. 2013;62:357–396. - PubMed
-
- Levine GN, Bates ER, Blankenship JC, et al. 2011 ACCF/AHA/SCAI guideline for percutaneous coronary intervention. J Am Coll Cardiol. 2011;58:e44–e122. - PubMed
Publication types
MeSH terms
Grants and funding
LinkOut - more resources
Full Text Sources
Other Literature Sources
Medical
Miscellaneous
