Review
. 2017 Oct;27(7):463-472.
doi: 10.1016/j.tcm.2017.05.003. Epub 2017 May 10.

Recording sympathetic nerve activity from the skin

Affiliations
Review

Recording sympathetic nerve activity from the skin

Thomas H Everett 4th et al. Trends Cardiovasc Med. 2017 Oct.

Abstract

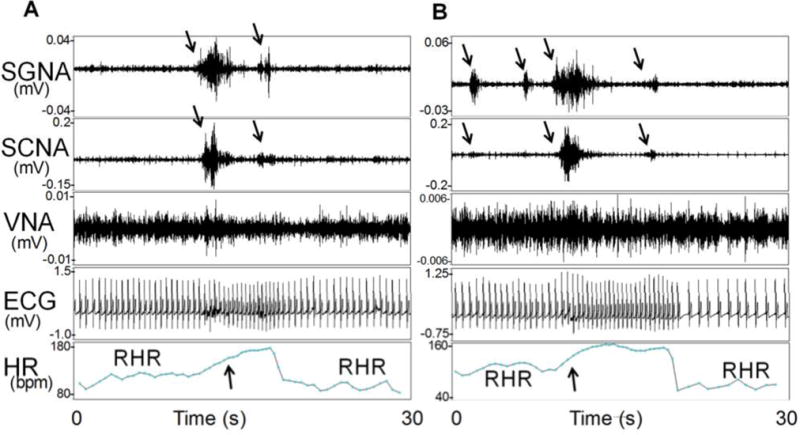
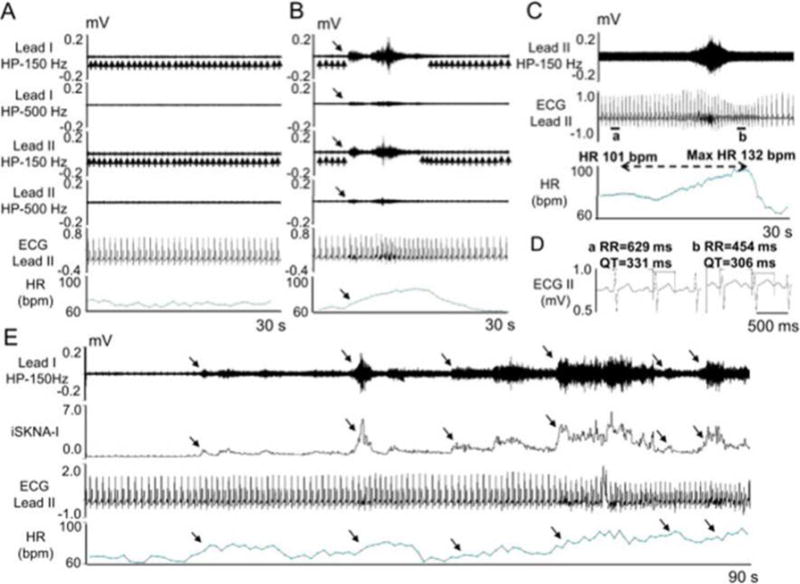
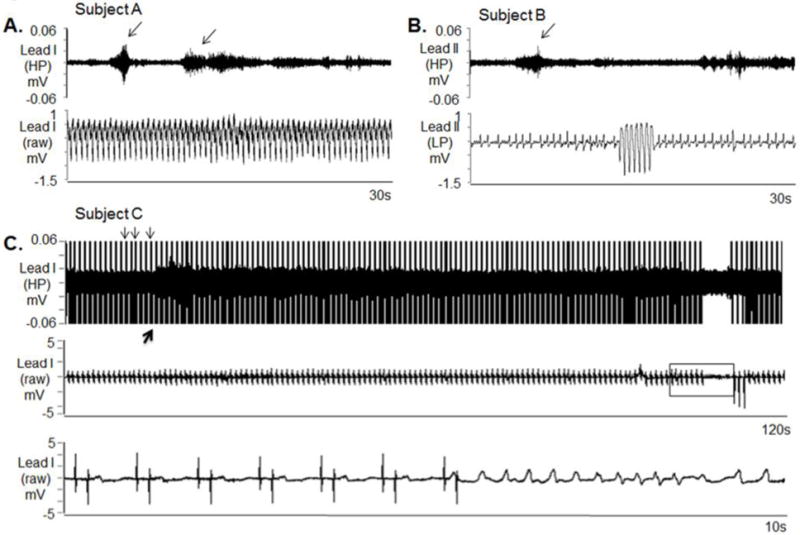
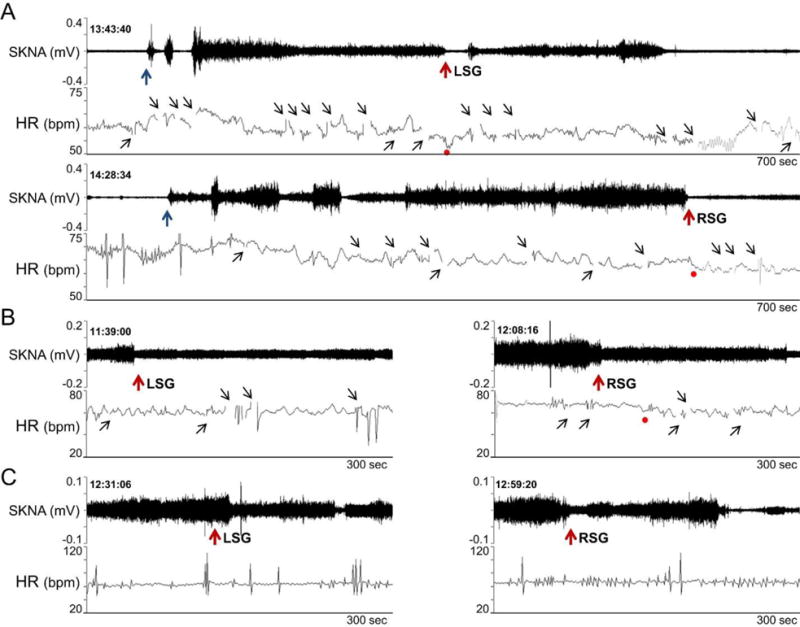
Sympathetic tone is important in cardiac arrhythmogenesis; however, methods to estimate sympathetic tone are either invasive or require proper sinus node function that may be abnormal in disease states. Because of the direct and extensive connections among various nerve structures, it is possible for the sympathetic nerves in the various structures to activate simultaneously. Therefore, we hypothesized that nerve activity can be recorded from the skin and it can be used to estimate the cardiac sympathetic tone. Preclinical studies in canines demonstrated that nerve activity is detectable using conventional ECG electrodes and can be used to estimate cardiac sympathetic tone. Subsequent clinical studies further supported this concept. In addition to studying the autonomic mechanisms of cardiac arrhythmia, these new methods may have broad application in studying both cardiac and non-cardiac diseases.

Keywords: Arrhythmia; Autonomic nervous system; Sympathetic nerve activity.


Figures

Figure 1
Figure 1
SCNA and SGNA are associated with heart rate elevation in an ambulatory dog. The first portion of Panel A shows rhythmic heart rate (HR) variations consistent with respiratory heart rate responses (RHR). SGNA and SCNA (downward arrows) then activated simultaneously, resulting in heart rate acceleration (upward arrow). There were no obvious changes of VNA in this recording. Simultaneous cessation of the SGNA and SCNA was associated with a reduction of the heart rate and the resumption of RHR. B shows simultaneous activation of SGNA, SCNA (downward arrows) in the same dog 25 seconds after Panel A. Downward arrows point to simultaneous nerve activities in SGNA and SCNA. Upward arrow indicates the onset of tachycardia. ECG, electrocardiogram. (From Robinson et al, J Cardiovasc Electrophysiol; 2015)(33)
Figure 2
Figure 2
Electrode locations. We used OctoBioAmp (ADInstruments, Colorado Springs, CO) to record SKNA in healthy volunteers and in patients without heart disease or with electrical storm. We used the healthy volunteer protocol to test various electrocardiogram (ECG) lead positions. All subjects had unipolar recordings from the usual chest lead locations V1–V6, except for three whose lead V1 was moved to the right wrist and leads V2–V6 were shifted in the V1–V5 position for unipolar recording. All bipolar recordings were made with limb lead ECG patch electrodes placed on the arms, abdomen, or fingers. For patients undergoing a bilateral stellate ganglion injection procedure, a portable ME6000 device was used for data acquisition. (A) shows the portable (181 × 85 × 35 mm) ME6000 Biomonitor. One channel was used to record ECG Lead I (B). The red electrodes were placed in the subclavicular area and the black electrode served as reference. A second channel was used to record SKNA from the right arm (C) to avoid ECG contamination. RA=right arm electrode, LA=left arm electrode, RL=right leg electrode (reference), LL=left leg electrode, wrist=unipolar electrode (V1) placed at the wrist location, V1–V6=standard unipolar electrocardiogram leads. (From Online Data Supplement, Doytchinova et al, Heart Rhythm 2017)(47)
Figure 3
Figure 3
Filter setting and signal to noise ratio of a recording from a healthy volunteer. Panel A shows the same data filtered with 3 different methods. After applying 150 Hz high pass filter, the ECG signals were incompletely eliminated but the nerve signals are clearly visible with a good signal to noise ratio. After applying the same data with a 500 Hz high pass filter, all ECG signals are eliminated by the signal to noise ratio for the nerve signal is reduced by approximately 50%. A Fast Fourier Transform analyses (Panel B) shows a high power signal (red arrow) slightly higher than 1000 Hz. This high power signal might be noise. Applying a band pass filter between 500 Hz and 1000 Hz eliminated that noise and reduced the thickness of the baseline, hence improved the signal to noise ratio of the SKNA. (From Online Data Supplement, Doytchinova et al, Heart Rhythm 2017)(47)
Figure 4
Figure 4
SKNA recordings from a health volunteer undergoing the Valsalva maneuver. Signals from lead V1 were bandpass filtered between 500–1000 Hz to detect SKNA and bandpass filtered between 0.5–150 Hz to detect the ECG. Integraded SKNA (iSKNA) was calculated over a 100-ms window. A: Increased SKNA was associated with heart rate (HR) acceleration. B: Higher magnification of SKNA showing baseline spontaneous nerve activity (a) and large variations of nerve discharges associated with tachycardia (b). C: increased SKNA and HR were evident during Valsalva maneuver. Dotted red lines mark the start and stop of the maneuver. D: Magnified boxed segment from Panel C showing phases II–IV of the Valsalva maneuver, demonstrating that SKNA was not synchronous with the QRS complex. (From Doytchinova et al, Heart Rhythm 2017)(47)
Figure 5
Figure 5
SKNA recordings during the cold water pressor test (CPT) in healthy volunteers. The electrode location was on the right and left arm for ECG Lead I recording. A–D: Increased skin sympathetic nerve activity (SKNA) was detected in subjects 1–4, respectively, during the CPT. Black downward arrows point to increased SKNA prior to CPT, likely due to the anticipation of the impending cold water immersion. The increased SKNA was associated with heart rate acceleration in patients 1–3, but not in patient 4. Integrated SKNA (iSKNA) shows the total SKNA over 100 ms windows after applying 500 Hz high pass filter. HR= heart rate, bmp=beats per minute. (From Doytchinova et al, Heart Rhythm 2017)(47)
Figure 6
Figure 6
SKNA recording in patients without known heart diseases. The electrodes were placed on the chest to form Lead I and Lead II. A - Baseline recording in leads I and II filtered at either 150 Hz or 500 Hz high pass to display SKNA and low pass filtered at 10 Hz to display the ECG. B - Episode of SKNA associated with heart rate (HR) acceleration (downward arrows). The 150 Hz high pass filter resulted in better signal to noise ratio and higher amplitude of SKNA, but some ECG signals remained (upward arrows). High pass filter at 500 Hz largely eliminated the ECG signals, but also reduced nerve amplitude and the signal to noise ratio. The baseline artifact on the surface ECG occurred after the onset of SKNA, suggesting motion artifacts induced by muscle movement. C - SKNA (500 Hz high pass, Lead II) and ECG tracings (125 Hz low pass) from a different patient. There was abrupt increase of HR from 101 beats per minute (bpm) to a maximum (1 max) of 132 bpm after SKNA activation, along with QT interval shortening. D - Enlarged ECG from line segments a and b in panel C. Both the RR and the QT interval shortened after SKNA. E - 90 s recording at baseline, illustrating spontaneous SKNA episodes and their relationship with HR. HP=high pass, LP=low pass, bpm=beats per minute. (From Doytchinova et al, Heart Rhythm 2017)(47)
Figure 7
Figure 7
SKNA during sustained VT and before nonsustained VT. The neuECG electrodes were placed on the chest to form Lead I and Lead II. A: Nerve discharges (arrows) are noted throughout monomorphic ventricular tachycardia (VT). Signals simultaneously obtained from ECG lead I with the top panel representing the signal after 500 Hz high pass (HP) filter and the bottom panel displaying the raw signal. B: Similar discharges are observed in another patient preceding non-sustained VT. Signal simultaneously obtained from ECG lead II, the top panel is filtered at 500 Hz high pass and the bottom ECG is filtered at 10 Hz low pass. C: Pacing artifacts (downward arrows) are observed despite 500 Hz high pass filtering. Increased high frequency SKNA is still evident (upward arrow) beginning 90 s prior to VT. The bottom panel shows the boxed segment from the middle panel and the onset of VT. VT=ventricular tachycardia, ECG=electrocardiogram, HP=500 Hz high pass filter, LP=10 Hz low pass filter, SKNA=skin sympathetic nerve activity. (From Doytchinova et al, Heart Rhythm 2017)(47)
Figure 8
Figure 8
Effects of lidocaine (10 ml, 2 %) stellate ganglion block on SKNA continuously recorded from the right arm. A shows patient 1. Needle insertion (black arrows) was followed by activation of SKNA. Lidocaine injection (red arrows) into the LSG transiently reduced SKNA. However, RSG injection was followed by a significant reduction of SKNA. Panels B and C show responses to lidocaine injection in the remaining 2 patients. The gaps in tachogram (small black upward arrows) occurred because artifacts prevented automated selections of the R waves. (From Doytchinova et al, Heart Rhythm 2017)(47)

Comment in

References

    1. Einthoven W. Galvanometrische registratie van het menschelijk electrocardiogram. Leiden, Netherlands: Eduard Ijdo; 1902.
    1. Rubart M, Zipes DP. Mechanisms of sudden cardiac death. JClinInvest. 2005;115(9):2305–15. - PMC - PubMed
    1. Shen MJ, Choi EK, Tan AY, Lin SF, Fishbein MC, Chen LS, et al. Neural mechanisms of atrial arrhythmias. Nat Rev Cardiol. 2011;27:30–9. - PubMed
    1. Mark AL, Wallin BG. Microneurography: a technique for assessing central neural effects of adrenergic drugs on sympathetic outflow in humans. J Cardiovasc Pharmacol. 1985;7(Suppl 8):S67–9. - PubMed
    1. Vallbo AB, Hagbarth KE, Wallin BG. Microneurography: how the technique developed and its role in the investigation of the sympathetic nervous system. JApplPhysiol. 2004;96(4):1262–9. - PubMed

Publication types