. 2017 Aug 7;216(8):2409-2424.
doi: 10.1083/jcb.201701041. Epub 2017 Jun 15.

Molecular model of fission yeast centrosome assembly determined by superresolution imaging

Affiliations

Molecular model of fission yeast centrosome assembly determined by superresolution imaging

Andrew J Bestul et al. J Cell Biol. .

Abstract

Microtubule-organizing centers (MTOCs), known as centrosomes in animals and spindle pole bodies (SPBs) in fungi, are important for the faithful distribution of chromosomes between daughter cells during mitosis as well as for other cellular functions. The cytoplasmic duplication cycle and regulation of the Schizosaccharomyces pombe SPB is analogous to centrosomes, making it an ideal model to study MTOC assembly. Here, we use superresolution structured illumination microscopy with single-particle averaging to localize 14 S. pombe SPB components and regulators, determining both the relationship of proteins to each other within the SPB and how each protein is assembled into a new structure during SPB duplication. These data enabled us to build the first comprehensive molecular model of the S. pombe SPB, resulting in structural and functional insights not ascertained through investigations of individual subunits, including functional similarities between Ppc89 and the budding yeast SPB scaffold Spc42, distribution of Sad1 to a ring-like structure and multiple modes of Mto1 recruitment.


Figures

Figure 1.
Figure 1.
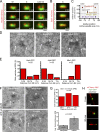
Assembly of satellite SPB using SIM. (A) List of SPB proteins in fission yeast used in this study and their known or predicted homologues in S. cerevisiae and H. sapiens. X, no homologue known; *, nonhomologous protein with similar function. Proteins in gray have not been reported to have roles in centrosome duplication. (B) G1/S cells were identified within asynchronous population of cells containing GFP-tagged core SPB components (top row) or membrane/bridge/γ-TC proteins (bottom row) based on a septum in the differential interference contrast (DIC) image, as shown in the last panel. The ends of the cells are shown by dashes. Two SPBs could be detected by SIM, one in each cell. Bar, 3 µm. Insets show a magnified region of the SPB. Arrows point to SPBs in Cam1-GFP. Bar, 0.5 µm. (C) Percentage of G1/S cells that contained two closely spaced foci (top). For membrane/bridge/γ-TC proteins, two foci or an extended GFP signal was detected (Fig. S1 C); both were quantitated as described in Materials and methods (bottom). The number of cells is shown. Protein localization fell into four classes: greater than 75% (green), 50–75% (red), 5–45% (orange), and 0% of cells with two foci, suggesting a temporal order of assembly during SPB duplication shown in D.
Figure 2.
Figure 2.
Structure of the S. pombe bridge. (A) G1/S cells containing GFP-Cdc31 or Sfi1-GFP were identified within the asynchronous population based on a septum in the DIC image, as in Fig 1 B. Arrows point to the SPBs in GFP-Cdc31. Bars: (main) 3 μm; (inset) 0.5 μm. The percentage of cells containing one or two foci two foci is shown. (B) SPA-SIM images of Ppc89-mCherry with GFP-Sfi1 (top), Sfi1-GFP (center), or GFP-Cdc31 (bottom). Cells were synchronized in G1 (nitrogen starvation for 16 h at 25°C), S (10 mM HU for 4 h at 25°C), and late G2 (cdc25.22 mutant, 36°C for 3.5 h). The number of images used to create the projection is indicated (n). Bar, 200 nm. (C) Location of proteins derived from SPA-SIM in (B) were determined for both the pole and mother-satellite axes and plotted using the Ppc89-mCherry signal at the mother and new SPB as the zero reference position. Error bars represent SEM. n, as in B. The positions of the mother/bridge proximal region and satellite/bridge distal region were determined based on mean FWHM values of Ppc89-mCherry at the mother and satellite (Table S1). (D and E) Distance and angles were determined in three dimensions using GFP-Sfi1 foci and Ppc89-mCherry/Sfi1-GFP on the old and new Sfi1 filament that is proximal and distal to the mother SPB, respectively, from data in C. Error bars represent SEM. n, as in B. Indicated values are statistically significant based on Student’s t test (P < 0.01). (F) Within an asynchronous population, the intensity of GFP-Sfi1 at the mother and satellite SPB was quantitated in the indicated number of individual images (n), and the mean level in each cell cycle stage (determined using DIC image) was calculated. For comparison purposes, values were normalized setting the highest observed value (satellite in late G2) to 1.0. Error bars represent SEM. n, as in B. P-values were determined using Student’s t test, *, P ≤ 0.0001; **, P = 0.002; NS, P > 0.05. (G) Schematic view of the elongated bridge showing the bend in Sfi1 (orange) that progresses during the cell cycle, the preferential association of Sfi1 to the satellite and the position of Cdc31 near the center of the bridge (black circles).
Figure 3.
Figure 3.
Localization of SPB core and linker components during S phase. (A) SPA-SIM images of Ppc89-mCherry and indicated core SPB protein-GFP synchronized in S phase cells. Number of images, n. Bar, 200 nm. (B) Location of core SPB proteins derived from SPA-SIM in A. The maximum intensity of the Cam1-GFP, Cdc11-GFP, Cut12-GFP, Mto1-GFP, GFP-Pcp1, Pcp1-GFP, and Sid4-GFP distributions were determined for both the pole and mother-satellite axes and plotted using the Ppc89-mCherry signal at the mother and new SPB as the zero reference position. Error bars represent SEM. n, as in A. Based on the FWHM values of Ppc89-GFP at the mother (129 nm, −168 to −39 nm) and satellite (120 nm; 44 to 164 nm; Table S1), the bridge was divided into proximal/mother and distal/satellite regions. (C) Contour map showing the distribution of the fluorescent intensity of the core SPB proteins (colored as indicated) of images from A. Ppc89-mCherry for each sample is shown in red. Bar, 200 nm. (D) SPA-SIM images of S phase–arrested Sad1-mCherry containing N- or C-terminal GFP-tagged Ppc89 or Pcp1. Number of images, n. Bar, 200 nm. (E) Positional location of Ppc89 and Pcp1 derived from SPA-SIM images in (D). The maximum intensity of fits of Ppc89-GFP, GFP-Ppc89, Pcp1-GFP, and GFP-Pcp1 distributions were determined for both axes and plotted using the Sad1-mCherry signal at the mother and the satellite as the zero reference position. Error bars represent SEM. n, as in D. FWHM values are listed in Table S1, and the bridge was divided into proximal/mother and distal/satellite regions, using positional information from B. The approximate positions of the NE based on EM data are also shown. (F) Immuno-EM of Ppc89-GFP, GFP-Ppc89, and Pcp1-GFP. Arrows indicate the NE. A magnified region containing gold particles at the SPB is shown below. Bar, 100 nm. (G) Quantification of the indicated number of gold particles from at least 20 EM images of interphase cells. The distance of individual gold particles was measured in ImageJ at an angle of 90° from the NE. Error bars show the mean distance and SEM. P-values were calculated using the Student’s t test. (H) Schematic showing the orientation of Ppc89 N and C termini (red) along with the approximate distance based on SIM data from the C terminus of Pcp1 (Table S1). The projections of GFP-Pcp1/Ppc89-mCherry and Ppc89-GFP/Sad1-mCherry in A and D are also shown in Fig. S3 (D and A, respectively).
Figure 4.
Figure 4.
Assembly of core and linker components at the SPB. (A) SPA-SIM of G1-arrested Ppc89-mCherry cells containing the indicated core SPB GFP-fusion. The number of images (n) used to create the projection is shown. Bar, 200 nm. (B) Individual images from A were analyzed to determine the number of SPBs that contained two red foci of Ppc89-mCherry and one or two foci of GFP at the mother and satellite (denoted 2R:1G and 2R:2G, respectively), as shown in the schematic. A fraction of cells that contained two GFP foci and a single focus of Ppc89-mCherry (1R:2G) were also observed. (C) Asynchronously growing cells at 25°C containing the indicated GFP-tagged SPB component were imaged by SIM, and the intensity of GFP at the satellite was determined. For comparison purposes, values for each protein were then normalized setting the highest observed value to 1.0. Cell cycle position was determined by cell morphology from an identical DIC image. Error bars represent SEM; n ≥ 20 cells for each cell cycle quantified. The projection of Mto1-GFP/Ppc89-mCherry is also shown in Fig. S3 D.
Figure 5.
Figure 5.
γ-Tubulin complex components, Alp4 and Alp6, localize near the NE between duplicated SPBs. (A) SPA-SIM images of Ppc89-mCherry with Alp4-GFP (top), Alp6-GFP (middle), or Mzt1-GFP (bottom) arrested in G1, S, or late G2. The number of images used to create the projection is indicated (n). Bar, 200 nm. (B) SPA-SIM of Sad1-mCherry with Alp4-GFP (top), Alp6-GFP (middle), or Mzt1-GFP (bottom) from the indicated number of S phase–arrested cells. Bar, 200 nm. (C) The maximum intensity of the Alp4-GFP, Alp6-GFP, or Mzt1-GFP distributions were determined from images in B in the pole and mother-satellite axes and plotted using the Sad1-mCherry signal at the mother and the satellite as the zero reference position. Ppc89-GFP is also shown, with FWHM values used to delineate proximal/mother and distal/satellite regions. Error bars represent SEM. n, as in B. Complete FWHM values for all data points are listed in Table S1. The approximate position of the NE is shown by the dashed line. (D) Anti-GFP immuno-EM of interphase cells containing Alp4-GFP, Alp6-GFP, and Mto1-GFP. Arrows indicate the NE, and arrowheads indicate the SPB. Bar, 200 nm. (E) The distance of individual gold particles was measured in ImageJ at an angle of 90° from the NE. The number (n) of images is shown. (F) Immuno-EM was also performed with polyclonal antibodies that recognize the amino acids 38–53 in γ-tubulin. Three interphase cells and one mitotic cell are shown. Bar, 100 nm. (G) Gold particles were quantitated as in E, with negative and positive numbers representing the nuclear and cytoplasmic sides of the NE. Also shown is the number of gold particles detected at the SPB in interphase and mitotic cells. Error bars show SEM. P-value was calculated using Student’s t test. (H) cdc25.22 cells containing mCherry-Atb2 and Alp4-GFP were synchronized in late G2 for 4 h at 36°C and then released into mitosis for 20 min by incubation at 25°C and imaged by SIM. Cytoplasmic microtubules were seen perpendicular to the SPB before release (top), whereas parallel microtubules from a single SPB (middle) and in a bipolar spindle (bottom) are seen after release. Bar, 1 µm. The projection of Alp4-GFP/Sad1-mCherry is also shown in Fig. S3 A.
Figure 6.
Figure 6.
Sad1 and Kms2 localization to the SPB by SIM. (A) SPA-SIM images of Ppc89-mCherry with Sad1-GFP (top) or GFP-Kms2 (middle) from G1-, S-, or late G2–arrested cells. The number of images used to create the projection is indicated (n). Bar, 200 nm. Bottom contour maps show the distribution of the fluorescent intensity Sad1 (cyan) and Kms2 (yellow) from the images above. Ppc89-mCherry for each sample is shown in red. Bar, 200 nm. (B) Ppc89-mCherry cells containing Sad1-GFP or GFP-Kms2 were arrested in G1 phase by nitrogen starvation for 16 h at 25°C then analyzed by SIM to determine the number (n) of SPBs that contained two red foci of Ppc89-mCherry and one or two foci of GFP at the mother and satellite (denoted 2R:1G and 2R:2G, respectively). Cells that contained two GFP foci and a single focus of Ppc89-mCherry (1R:2G) were also observed. (C) sad1.1 cells containing either GFP-Sfi1 (top) or Ppc89-GFP (bottom) were grown at 25°C, and then cultures were divided, with one kept at 25°C for 4 h (left) and the other culture shifted to 36°C for 4 h (right). Cells were examined by SIM, and example images of cells with SPBs are shown. Bars, 3 µm. Insets show a magnified region containing the SPB. Bar, 500 nm. (D) Percentage of septated cells from (C) that had either GFP-Sfi1 or Ppc89-GFP signal at the satellite in the sad1.1 background. Wild-type (wt) cells were included to ensure that sad1.1 cells at 25°C were not already compromised. Total number of septated cells examined is listed. P-values were determined using Student’s t test; none were statistically significant. (E) cdc25.22 cells containing Ppc89-mCherry and Sad1-GFP were grown overnight at 25°C, arrested in late G2 by growth at 36°C for 3.5 h, and then released into mitosis by shifting back to 25°C for 0, 10, and 20 min. Example images from each time point are shown to illustrate how Sad1-GFP localizes beneath the SPBs in late G2 (left; side-on view) and then localizes to a region around a single SPB (middle; top-down view) and finally around both SPBs (right; top-down view). Bar, 200 nm. (F) SPA-SIM of cdc25.22 Sad1-mCherry Alp4-GFP early mitotic cells that were released from cdc25.22 arrest for 10 min. Alp4-GFP signal is below Sad1-mCherry signal in the pole-axis. Bar, 200 nm. (G) Position of maximum intensity of Sad1-mCherry and Alp4-GFP along the pole-axis (y) in S (from Fig 5, B and C) and cells in F with Sad1-mCherry as the zero reference position. Error bars represent SEM (see Table S1). n, as in Figs. 5 B and 6 F.
Figure 7.
Figure 7.
Model for S. pombe SPB duplication and maturation during the cell cycle. Schematic of SPB duplication (A) based on data described throughout, with key molecules indicated based on B.

References

    1. Anders A., Lourenço P.C., and Sawin K.E.. 2006. Noncore components of the fission yeast gamma-tubulin complex. Mol. Biol. Cell. 17:5075–5093. 10.1091/mbc.E05-11-1009 - DOI - PMC - PubMed
    1. Bähler J., Wu J.Q., Longtine M.S., Shah N.G., McKenzie A. III, Steever A.B., Wach A., Philippsen P., and Pringle J.R.. 1998. Heterologous modules for efficient and versatile PCR-based gene targeting in Schizosaccharomyces pombe. Yeast. 14:943–951. 10.1002/(SICI)1097-0061(199807)14:10<943::AID-YEA292>3.0.CO;2-Y - DOI - PubMed
    1. Baker J., Theurkauf W.E., and Schubiger G.. 1993. Dynamic changes in microtubule configuration correlate with nuclear migration in the preblastoderm Drosophila embryo. J. Cell Biol. 122:113–121. 10.1083/jcb.122.1.113 - DOI - PMC - PubMed
    1. Bouhlel I.B., Ohta M., Mayeux A., Bordes N., Dingli F., Boulanger J., Velve Casquillas G., Loew D., Tran P.T., Sato M., and Paoletti A.. 2015. Cell cycle control of spindle pole body duplication and splitting by Sfi1 and Cdc31 in fission yeast. J. Cell Sci. 128:1481–1493. 10.1242/jcs.159657 - DOI - PubMed
    1. Bridge A.J., Morphew M., Bartlett R., and Hagan I.M.. 1998. The fission yeast SPB component Cut12 links bipolar spindle formation to mitotic control. Genes Dev. 12:927–942. 10.1101/gad.12.7.927 - DOI - PMC - PubMed

MeSH terms