. 2017 Sep;16(9):1779-1790.
doi: 10.1158/1535-7163.MCT-16-0848. Epub 2017 Jun 15.

Inhibition of Hsp90 Suppresses PI3K/AKT/mTOR Signaling and Has Antitumor Activity in Burkitt Lymphoma

Affiliations

Inhibition of Hsp90 Suppresses PI3K/AKT/mTOR Signaling and Has Antitumor Activity in Burkitt Lymphoma

Lisa Giulino-Roth et al. Mol Cancer Ther. 2017 Sep.

Abstract

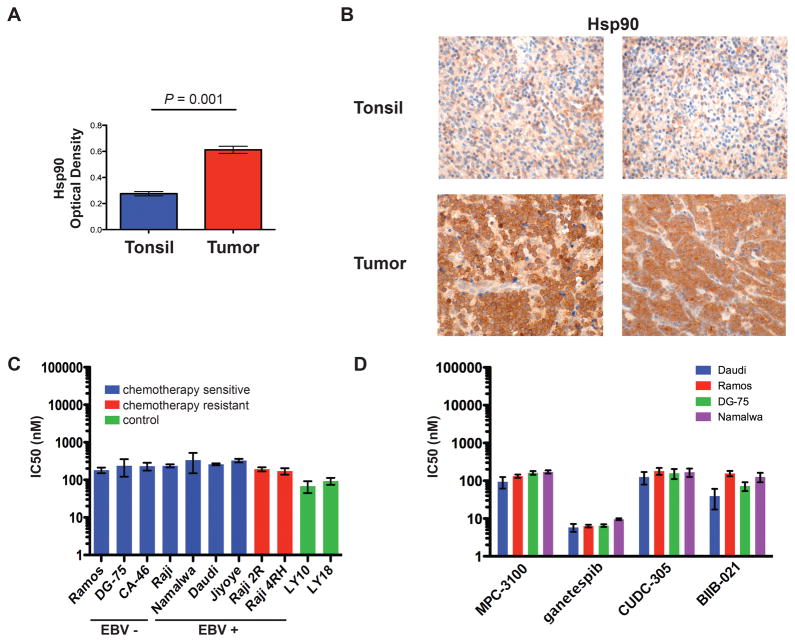
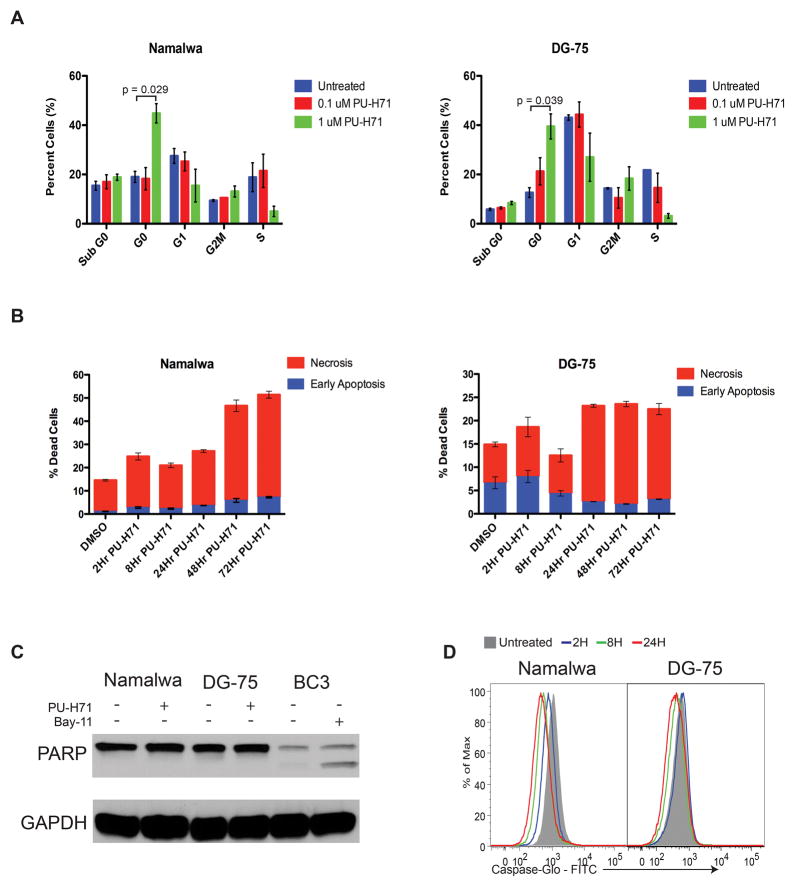
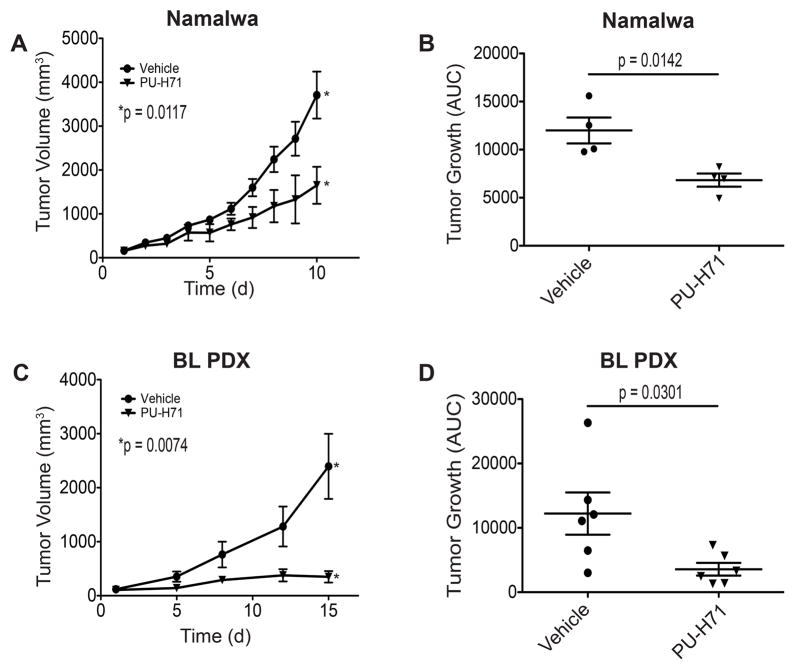
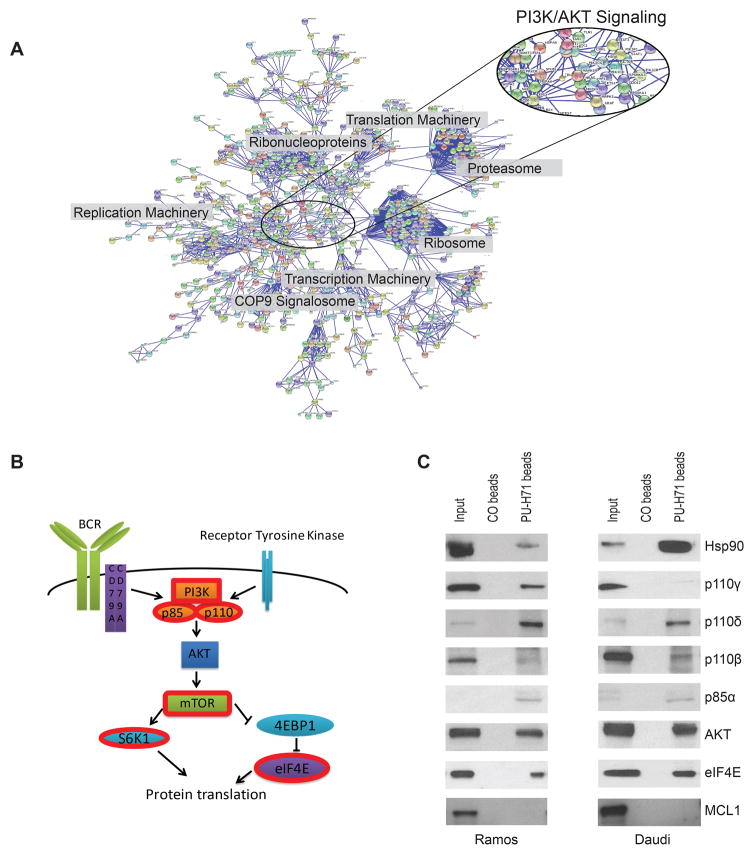
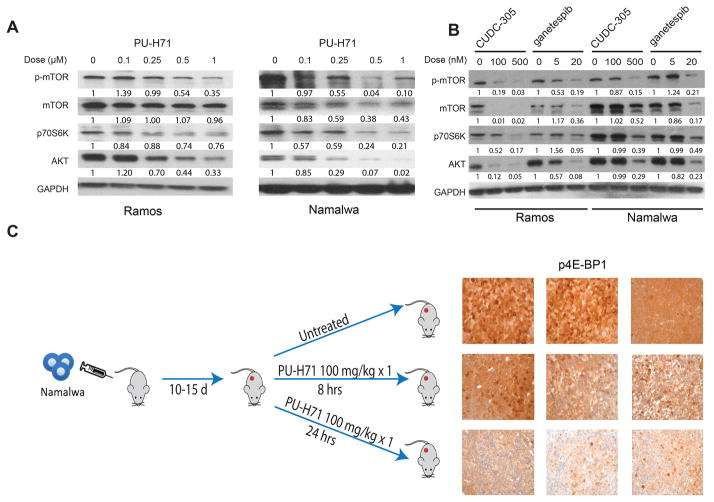
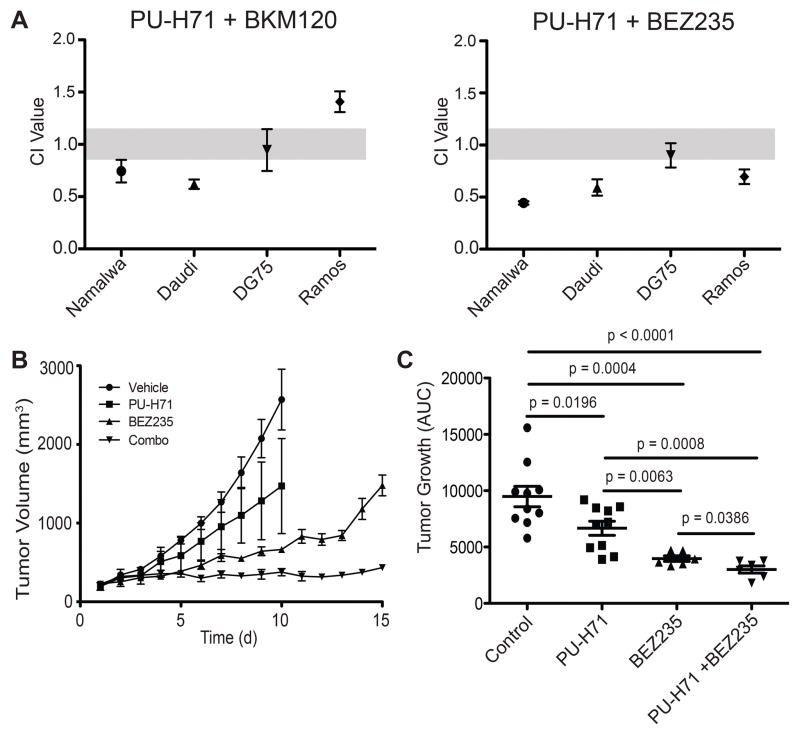
Hsp90 is a molecular chaperone that protects proteins, including oncogenic signaling complexes, from proteolytic degradation. PU-H71 is a next-generation Hsp90 inhibitor that preferentially targets the functionally distinct pool of Hsp90 present in tumor cells. Tumors that are driven by the MYC oncoprotein may be particularly sensitive to PU-H71 due to the essential role of Hsp90 in the epichaperome, which maintains the malignant phenotype in the setting of MYC. Burkitt lymphoma (BL) is an aggressive B-cell lymphoma characterized by MYC dysregulation. In this study, we evaluated Hsp90 as a potential therapeutic target in BL. We found that primary BL tumors overexpress Hsp90 and that Hsp90 inhibition has antitumor activity in vitro and in vivo, including potent activity in a patient-derived xenograft model of BL. To evaluate the targets of PU-H71 in BL, we performed high-affinity capture followed by proteomic analysis using mass spectrometry. We found that Hsp90 inhibition targets multiple components of PI3K/AKT/mTOR signaling, highlighting the importance of this pathway in BL. Finally, we found that the anti-lymphoma activity of PU-H71 is synergistic with dual PI3K/mTOR inhibition in vitro and in vivo Overall, this work provides support for Hsp90 as a therapeutic target in BL and suggests the potential for combination therapy with PU-H71 and inhibitors of PI3K/mTOR. Mol Cancer Ther; 16(9); 1779-90. ©2017 AACR.


Figures

Figure 1
Figure 1. Burkitt lymphomas overexpresses Hsp90 and are sensitive to inhibition with Hsp90 inhibitors in-vitro.
(A and B) Hsp90 protein expression as determined by immunohistochemistry in primary BL tumors (n=59) and control tonsil tissue (n=3). Optical density was measured (A) and is shown as average +/− SEM. Panel B shows representative samples of tonsil and BL tumor, original magnification ×600 with 60× objective lens. Microscope: Olympus BX 43; camera: Jenoptik ProgRes CF; software: ProgRes Mac CapturePro 2.7.6. (C and D) IC50 of a panel of EBV-positive and EBV-negative BL cell lines after exposure to PU-H71 or other Hsp90 inhibitors. Cells were exposed to increasing doses of PU-H71, MPC-3100, ganetespib, CUDC-305, BIIB-021 or vehicle control (water + DMSO) and evaluated for viability at 48 hrs using the CellTiter-Glo assay. IC50 was calculated using Prism software (Graphpad). Results represent the mean of 3 biologic replicates, each of which was performed in experimental triplicates. Error bars represent SEM. DLBCL cell lines known to be sensitive to PU-H71 (Ly10, Ly18) were used as positive controls.
Figure 2
Figure 2. PU-H71 inhibits the growth of BL through cell cycle arrest
(A) Cells were treated with PU-H71 or vehicle control for 24 hours, harvested, fixed and stained with Ki67-BV510 antibody followed by Propidium Iodide (PI) and 1×10⁵ cells were analyzed by flow cytometry. The average of three independent experiments are presented with bars representing SEM. (B) Cells were treated with 1μM PU-H71 or vehicle control for 2hr, 8hr, 24hr, 48hr, or 72hr, stained with 7-AAD and Annexin V-AlexaFluor 647 and analyzed by flow cytometry. The average of three independent experiments is shown. (C) Cells were treated with 1uM PU-H71 and evaluated for PARP cleavage at 2hrs. BC3 cells treated with 5uM of Bay11, which is known to induce apoptosis, were used as a positive control. (D) Cells were treated with 1uM PU-H71 at the indicated timepoints. 30 minutes before harvesting, cells were stained with CAS-MAP Green (Intracellular Technologies) working solution. After harvesting, cells were washed and resuspended in PBS for flow cytometry analysis. Cells undergoing apoptosis were detected via fluorescence at 488 nm.
Figure 3
Figure 3. PU-H71 has anti-lymphoma effect in-vivo
(A) NOD-SCID mice were injected in the subcutaneous flank with 1 × 10⁷ Namalwa cells. When tumors reached 150–200mm3 mice were treated with PU-H71 or vehicle control. Tumor growth plot of mice treated with PU-H71 or vehicle control. Error bars represent SEM. (B) Growth of tumor as measured by area under the curve. Average tumor growth is represented on the y axis which represents tumor volume (mm3)/time (days). Error bars represent SEM. (C) PDX mice were generated using fresh tumor tissue from a patient with an abdominal presentation of BL. Cells were implanted into NSG mice (P0) and once palpable tumors developed, they were fragmented and implanted into additional mice (P1) for further studies. Once tumors reached 150–200mm3 mice were treated with PU-H71 or vehicle control × 10 days. At the completion of treatment all mice were humanely sacrificed for biology studies. Tumor growth plot of mice treated with PU-H71 or vehicle control. Error bars represent SEM. (D) Growth of tumor as measured by area under the curve. Average tumor growth is represented on the y axis which represents tumor volume (mm3)/time (days). Error bars represent SEM.
Figure 4
Figure 4. PI3K signaling pathway proteins are Hsp90 clients in BL
(A) STRING representation of the union of proteins identified in Ramos and Daudi chemical precipitations at 0.99 confidence. (B) A representation of the PI3K signaling pathway is shown. Proteins with red borders were identified as Hsp90 chaperone client proteins by LC-MS/MS. (C) Chemical precipitation with PU-H71 conjugated beads: lysates from Ramos and Daudi were subjected to chemical precipitation with PU-H71 conjugated beads or Hsp90-inert control beads (CO) followed by immunoblotting for the indicated PI3K pathway proteins. Hsp90 and MCL1 are used as a positive and negative controls respectively.
Figure 5
Figure 5. PI3K pathway proteins depend on Hsp90 to maintain expression in-vitro and in-vivo
(A and B) Ramos and Namalwa cells were exposed to PU-H71, CUDC-305, or ganetespib for 24 hours at the doses indicated and evaluated by immunoblot using the indicated antibodies. GAPDH was used as a loading control. Numerical quantification relative to GAPDH and expression in untreated cells is shown below each band (C) Namalwa xenografts were generated by injecting 1 × 10⁷ cells into NOD-SCID mice. 10–15 days after injection, mice were treated with a single dose of PU-H71 at 100mg/kg IP or vehicle control. Mice were humanely sacrificed at 8 or 24 hours after treatment to harvest tumors for immunohistochemistry as indicated. Tumors from 3 mice in each condition (untreated, 8hrs, and 24 hrs) are shown: original magnification ×600 with 60× objective lens. Microscope: Olympus BX 41; camera: Olympus Q-COLOR3; software: QCapture Version 2.9.8.0 (Quantitative Imaging).
Figure 6
Figure 6. Hsp90 inhibition is synergistic with PI3K/mTOR inhibition in BL
(A) Namalwa, Daudi, DG-75, and Ramos cells were treated with increasing doses of PU-H71 alone, a PI3K inhibitor as indicated alone, or the combination. Cell viability was measured using CellTiter-Glo. Synergy was calculated using Compusyn. CI values <0.9 are synergistic. Results represent the mean of the experiment performed in triplicate +/− SEM. (B) NOD-SCID mice were injected with 1 × 10⁷ Namalwa cells. When tumors reached 150–200mm3 mice were treated with PU-H71, BEZ235, the combination, or vehicle control. Tumor growth plot of mice treated with PU-H71, BEZ235, the combination, or vehicle control. Error bars represent SEM. (C) Growth of tumor as measured by area under the curve. Average tumor growth is represented on the y axis which represents tumor volume (mm3)/time (days). Error bars represent SEM.

References

    1. Giulino-Roth L, Wang K, Macdonald TY, Mathew S, Tam Y, Cronin MT, et al. Targeted genomic sequencing of pediatric Burkitt lymphoma identifies recurrent alterations in antiapoptotic and chromatin-remodeling genes. Blood. 2012;120(26):5181–4. doi: 10.1182/blood-2012-06-437624blood-2012-06-437624. [pii] - DOI - PMC - PubMed
    1. Love C, Sun Z, Jima D, Li G, Zhang J, Miles R, et al. The genetic landscape of mutations in Burkitt lymphoma. Nat Genet. 2012;44(12):1321–5. doi: 10.1038/ng.2468ng.2468. [pii]. - DOI - PMC - PubMed
    1. Richter J, Schlesner M, Hoffmann S, Kreuz M, Leich E, Burkhardt B, et al. Recurrent mutation of the ID3 gene in Burkitt lymphoma identified by integrated genome, exome and transcriptome sequencing. Nat Genet. 2012;44(12):1316–20. doi: 10.1038/ng.2469ng.2469. [pii]. - DOI - PubMed
    1. Schmitz R, Young RM, Ceribelli M, Jhavar S, Xiao W, Zhang M, et al. Burkitt lymphoma pathogenesis and therapeutic targets from structural and functional genomics. Nature. 2012;490(7418):116–20. doi: 10.1038/nature11378nature11378. [pii]. - DOI - PMC - PubMed
    1. Giulino-Roth L, Ricafort R, Kernan NA, Small TN, Trippett TM, Steinherz PG, et al. Ten-year follow-up of pediatric patients with non-Hodgkin lymphoma treated with allogeneic or autologous stem cell transplantation. Pediatr Blood Cancer. 2013;60(12):2018–24. doi: 10.1002/pbc.24722. - DOI - PubMed

MeSH terms

Substances

LinkOut - more resources