. 2017 Jun 15;6(6):e005869.
doi: 10.1161/JAHA.117.005869.

Mitochondrial Integrity and Function in the Progression of Early Pressure Overload-Induced Left Ventricular Remodeling

Affiliations

Mitochondrial Integrity and Function in the Progression of Early Pressure Overload-Induced Left Ventricular Remodeling

Antoine H Chaanine et al. J Am Heart Assoc. .

Abstract

Background: Following pressure overload, compensatory concentric left ventricular remodeling (CR) variably transitions to eccentric remodeling (ER) and systolic dysfunction. Mechanisms responsible for this transition are incompletely understood. Here we leverage phenotypic variability in pressure overload-induced cardiac remodeling to test the hypothesis that altered mitochondrial homeostasis and calcium handling occur early in the transition from CR to ER, before overt systolic dysfunction.

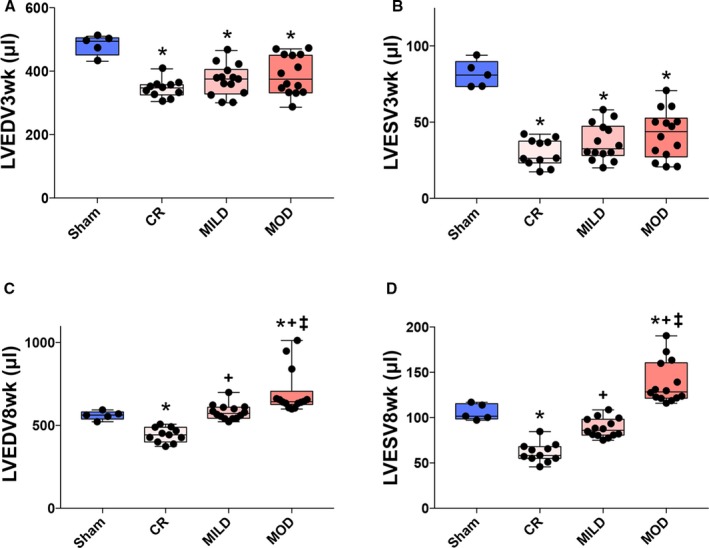
Methods and results: Sprague Dawley rats were subjected to ascending aortic banding, (n=68) or sham procedure (n=5). At 3 weeks post-ascending aortic banding, all rats showed CR (left ventricular volumes < sham). At 8 weeks post-ascending aortic banding, ejection fraction was increased or preserved but 3 geometric phenotypes were evident despite similar pressure overload severity: persistent CR, mild ER, and moderate ER with left ventricular volumes lower than, similar to, and higher than sham, respectively. Relative to sham, CR and mild ER phenotypes displayed increased phospholamban, S16 phosphorylation, reduced sodium-calcium exchanger expression, and increased mitochondrial biogenesis/content and normal oxidative capacity, whereas moderate ER phenotype displayed decreased p-phospholamban, S16, increased sodium-calcium exchanger expression, similar degree of mitochondrial biogenesis/content, and impaired oxidative capacity with unique activation of mitochondrial autophagy and apoptosis markers (BNIP3 and Bax/Bcl-2).

Conclusions: After pressure overload, mitochondrial biogenesis and function and calcium handling are enhanced in compensatory CR. The transition to mild ER is associated with decrease in mitochondrial biogenesis and content; however, the progression to moderate ER is associated with enhanced mitochondrial autophagy/apoptosis and impaired mitochondrial function and calcium handling, which precede the onset of overt systolic dysfunction.

Keywords: heart failure; hypertrophy; mitochondria; remodeling.


Figures

Figure 1
Figure 1
Serial assessment of LV volumes at 3 and 8 weeks post‐ascending aortic banding (AAB) in the different phenotypes. LV end‐diastolic (LVEDV) and LV end‐systolic (LVESV) volume at 3 (A and B) and 8 (C and D) weeks post‐AAB. Individual data points, box and whisker plots showing the median, interquartile range, and maximum and minimum values. *P<0.05 vs sham; + P<0.05 vs CR and P<0.05 vs MILD. CR indicates concentric remodeling; MILD, mild eccentric remodeling; MOD, moderate eccentric remodeling.
Figure 2
Figure 2
Echocardiographic assessment of the different phenotypes. A, Representative M‐mode images at the level of the midpapillary muscle in the different phenotypes. B and C, LV septal (IVSd) and posterior wall (LVPWd) thickness across the different phenotypes. D, LV ejection fraction (LVEF) across the different phenotypes. Individual data points, box and whisker plots showing the median, interquartile range, and maximum and minimum values. *P<0.05 vs sham; + P<0.05 vs CR and P<0.05 vs MILD. CR indicates concentric remodeling; IVSd, interventricular septal thickness in end‐diastole; LVEF, left ventricular ejection fraction; LVPWd, left ventricular wall thickness in end‐diastole; MILD, mild eccentric remodeling; MOD, moderate eccentric remodeling.
Figure 3
Figure 3
Hemodynamic assessment of the different phenotypes. A, Top panel: Representative P–V loop tracings at steady state (left) and with inferior vena cava constriction (right) in the different phenotypes. Bottom panel: Representative P–V loop tracings scaled for diastolic pressures at steady state (left) and with inferior vena cava constriction (right) in the different phenotypes. LV maximum pressure (LVPmax) (B), LV end‐diastolic pressure (LVEDP) (C), the dimensionless chamber stiffness index (DCSI) (D) and end‐systolic elastance (Ees) (E) across the different phenotypes. Individual data points, box and whisker plots showing the median, interquartile range, and maximum and minimum values. *P<0.05 vs sham; + P<0.05 vs CR and P<0.05 vs MILD. CR indicates concentric remodeling; LV, left ventricular; MILD, mild eccentric remodeling; MOD, moderate eccentric remodeling; P–V, pressure–volume.
Figure 4
Figure 4
LV interstitial fibrosis, markers of pathological hypertrophy and fetal gene expression in the different phenotypes. A, Representative photomicrographs of LV tissue stained with Picrosirius red taken by light (upper and bottom row) and polarized microscopy (middle row). Upper and middle row scale bar 200 μm. Bottom row scale bar 100 μm. B, Interstitial fibrosis assessed by collagen area fraction (CAF). C and D, Collagen I and III mRNA expression relative to sham. E, F, and G, Alpha‐skeletal muscle actin (ACTA1), Beta‐myosin heavy chain (β‐MyHC) and brain natriuretic peptide (BNP) mRNA expression relative to sham. Individual data points, box and whisker plots showing the median, interquartile range, and maximum and minimum values. *P<0.05 vs sham; + P<0.05 vs CR and P<0.05 vs MILD. CR indicates concentric remodeling; MILD, mild eccentric remodeling; MOD, moderate eccentric remodeling.
Figure 5
Figure 5
Assessment of the matrix metalloproteinases (MMP) and their tissue inhibitors (TIMP) in the different phenotypes. A, MMP‐2, MMP‐9, TIMP‐1, and TIMP‐2 expression in the different phenotypes compared to sham. Blue arrows showing MMP‐2 monomer and dimer at 75 and 150 kDa, respectively. B, Ratios of MMP‐2 and MMP‐9 over TIMP‐1 and TIMP‐2, respectively. The n number of animals studied for immunoblotting in the sham, CR, MILD, and MOD groups is 5, 8, 8, and 6, respectively. Bar graphs show mean and SD. *P<0.05 vs sham; + P<0.05 vs CR and P<0.05 vs MILD. CR indicates concentric remodeling; MILD, mild eccentric remodeling; MOD, moderate eccentric remodeling.
Figure 6
Figure 6
Assessment of calcium cycling proteins, endoplasmic reticulum stress apoptotic and mitochondrial pro‐apoptotic markers, biogenesis, and content in the different phenotypes. A, SERCA2a and NCX‐1 expression and ratio of S16 phosphorylated to total phospholamban. B, CHOP expression. C, BNIP3 expression and Bax/Bcl‐2 ratio in the different phenotypes compared to sham. The n number of animals studied for immunoblotting in the sham, CR, MILD, and MOD groups is 5, 8, 8, and 6, respectively. Bar graphs show mean and SD. *P<0.05 vs sham; + P<0.05 vs CR and P<0.05 vs MILD. CR indicates concentric remodeling; MILD, mild eccentric remodeling; MOD, moderate eccentric remodeling.
Figure 7
Figure 7
Assessment of apoptosis in the different phenotypes. A, TUNEL assay in the different phenotypes compared to sham. Images are 20× magnified, scale bar = 50 μm. The n number of studied animals for sham, CR, MILD, and MOD is 5, 8, 8, and 7, respectively. B, Cleaved caspase 3 relative to caspase 3 expression in the different phenotypes compared with sham. The n number of studied animals in the sham, CR, MILD, and MOD is 5, 8, 8, and 6, respectively. Bar graphs show mean and standard deviation. *P<0.05 vs sham; + P<0.05 vs CR and P<0.05 vs MILD. CR indicates concentric remodeling; MILD, mild eccentric remodeling; MOD, moderate eccentric remodeling; TUNEL, terminal deoxynucleotidyl transferase‐mediated dUTP‐biotin nick‐end labeling.
Figure 8
Figure 8
Assessment of mitochondrial oxidative phosphorylation in the different phenotypes. A, Electron transport chain complexes I–V. B, Citrate synthase (CS) activity. C, COX IV activity. D, PGC‐1α expression. E, Mitochondrial to nuclear DNA ratio across the different phenotypes relative to sham. The n number of studied animals for sham, CR, MILD, and MOD is 5, 8, 8, and 6 for immunoblotting and 5, 8, 8, and 7 for CS and COX IV activity, respectively. Bar graphs show mean and SD. *P<0.05 vs sham; + P<0.05 vs CR and P<0.05 vs MILD. CR indicates concentric remodeling; MILD, mild eccentric remodeling; MOD, moderate eccentric remodeling.

Similar articles

Cited by

References

    1. McMurray JJ, Petrie MC, Murdoch DR, Davie AP. Clinical epidemiology of heart failure: public and private health burden. Eur Heart J. 1998;19(Suppl P):P9–P16. - PubMed
    1. Nichols M, Townsend N, Scarborough P, Rayner M. Cardiovascular disease in Europe 2014: epidemiological update. Eur Heart J. 2014;35:2950–2959. - PubMed
    1. Williamson JD, Supiano MA, Applegate WB, Berlowitz DR, Campbell RC, Chertow GM, Fine LJ, Haley WE, Hawfield AT, Ix JH, Kitzman DW, Kostis JB, Krousel‐Wood MA, Launer LJ, Oparil S, Rodriguez CJ, Roumie CL, Shorr RI, Sink KM, Wadley VG, Whelton PK, Whittle J, Woolard NF, Wright JT Jr, Pajewski NM. Intensive vs standard blood pressure control and cardiovascular disease outcomes in adults aged >/=75 years: a randomized clinical trial. JAMA. 2016;315:2673–2682. - PMC - PubMed
    1. Thomopoulos C, Parati G, Zanchetti A. Effects of blood pressure‐lowering treatment. 6. Prevention of heart failure and new‐onset heart failure–meta‐analyses of randomized trials. J Hypertens 2016;34:373–384; discussion 384. - PubMed
    1. Roger VL. Epidemiology of heart failure. Circ Res. 2013;113:646–659. - PMC - PubMed

MeSH terms