. 2017 Sep;362(3):368-377.
doi: 10.1124/jpet.116.239384. Epub 2017 Jun 15.

Ethyl Vanillin Activates TRPA1

Affiliations

Ethyl Vanillin Activates TRPA1

Shaw-Wen Wu et al. J Pharmacol Exp Ther. 2017 Sep.

Abstract

The nonselective cation channel transient receptor potential ankryn subtype family 1 (TRPA1) is expressed in neurons of dorsal root ganglia and trigeminal ganglia and also in vagal afferent neurons that innervate the lungs and gastrointestinal tract. Many TRPA1 agonists are reactive electrophilic compounds that form covalent adducts with TRPA1. Allyl isothiocyanate (AITC), the common agonist used to identify TRPA1, contains an electrophilic group that covalently binds with cysteine residues of TRPA1 and confers a structural change on the channel. There is scientific motivation to identify additional compounds that can activate TRPA1 with different mechanisms of channel gating. We provide evidence that ethyl vanillin (EVA) is a TRPA1 agonist. Using fluorescent calcium imaging and whole-cell patch-clamp electrophysiology on dissociated rat vagal afferent neurons and TRPA1-transfected COS-7 cells, we discovered that EVA activates cells also activated by AITC. Both agonists display similar current profiles and conductances. Pretreatment with A967079, a selective TRPA1 antagonist, blocks the EVA response as well as the AITC response. Furthermore, EVA does not activate vagal afferent neurons from TRPA1 knockout mice, showing selectivity for TRPA1 in this tissue. Interestingly, EVA appears to be pharmacologically different from AITC as a TRPA1 agonist. When AITC is applied before EVA, the EVA response is occluded. However, they both require intracellular oxidation to activate TRPA1. These findings suggest that EVA activates TRPA1 but via a distinct mechanism that may provide greater ease for study in native systems compared with AITC and may shed light on differential modes of TRPA1 gating by ligand types.


Figures

Fig. 1.
Fig. 1.
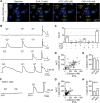
EVA and AITC sensitivity overlap in rat vagal afferent neurons. EVA stimulates AITC-sensitive vagal afferent neurons and TRPA1-transfected COS-7 cells. (A) Fluorescent photomicrographs of cultured rat vagal afferent neurons loaded with Fura-2 AM calcium indicator dye at baseline and exposed to 3 mM EVA, 300 µM AITC, and 100 nM CAP (white arrows = EVA-, AITC-, and CAP-responsive neurons; red arrows = CAP-only responsive). (B) Representative calcium traces showing response profiles of vagal afferent neurons exposed to 3 mM EVA, 300 µM AITC, and 100 nM CAP. (C) Histogram showing the percentage of neurons sensitive to EVA, AITC, and CAP (N = 75 neurons). (D) Scatterplot showing the positive linear relationship between EVA and AITC calcium response (N = 44 neurons, P < 0.0001, R2 = 0.35). (E) Average change in calcium to EVA and AITC in responsive neurons. AITC responses were statistically smaller on average compared with EVA responses (N = 44, P = 0.01, paired t test). (F) Calcium traces from nontransfected (GFP) and transfected (GFP+) COS-7 cells with TRPA1-GFP. EVA- and AITC-only activated cells containing TRPA1-GFP. (G) Similar to nodose neurons, transfected COS-7 cells show a positive linear relationship between EVA and AITC calcium response (N = 83 cells from three cultures, P < 0.0001, R2 = 0.28). (H) Average change in calcium to EVA and AITC in transfected COS-7 cells. AITC responses were statistically larger on average compared with EVA responses (N = 83/3, P < 0.001, Wilcoxon). *P < 0.05, ***P < 0.001.
Fig. 2.
Fig. 2.
EVA and AITC produce similar current-voltage profiles in rat vagal afferent neurons. (A) Representative current trace of an individual neuron at baseline (a), responsive to 3 mM EVA (b) and 300 µM AITC (c). (B) Average current densities normalized to capacitance of 3 mM EVA and 300 µM AITC held at −60 mV (N = 11 neurons, P = 0.001 and P = 0.005, respectively; paired t test against baseline). (C) Representative current-voltage (I-V) relationship curve of one cell at baseline (a) and in response to EVA (b) and AITC (c) across voltages. (D) Average I-V relationship curve of neurons that respond to EVA (b) and AITC (c) compared with baseline (a), showing increased inward current due to EVA and AITC exposure (N = 11 neurons). (E) Average conductance normalized to capacitance of all cells responsive to EVA and AITC (N = 11 neurons, P = 0.003 and P = 0.018, respectively, paired t test against baseline). Data are expressed as average ± S.E.M. **P < 0.01, ***P < 0.001.
Fig. 3.
Fig. 3.
Pharmacological and genetic evidence that EVA is a TRPA1 agonist. Pretreatment with the selective TRPA1 antagonist A967079 eliminates the AITC and EVA responses. (A) Representative calcium traces comparing EVA (3 mM) and AITC (300 µM) treatment responses before and after pretreatment with 1 µM A967079. (B) Average EVA and AITC increase in cytosolic calcium before and after pretreatment with A967079 (EVA: N = 31 neurons, P < 0.001, paired t test; AITC: N = 12 neurons, P < 0.001, paired t test). (C and D) EVA did not stimulate any vagal afferent neurons from TRPA1 KO mice. (C) Representative calcium traces from TRPA1 KO mice showing lack of responses to increasing concentrations of EVA (100 µM to 3 mM) and high-dose AITC (300 μM). (D) Average change in intracellular calcium levels across EVA dose from all neurons (N = 25 neurons). EVA and AITC failed to produce statistically significant changes in cytosolic calcium (EVA: P = 0.10, analysis of variance and AITC: P = 0.34, t test), whereas CAP and potassium depolarization did (CAP: P < 0.001, t test and KCl: P < 0.001, t test). (E) EVA activated vagal afferent neurons taken from wild-type mice that were also activated by AITC. (F) Average change in intracellular calcium levels across EVA dose response for activated neurons (N = 23 neurons). EVA and AITC produced statistically significant changes in cytosolic calcium (EVA: P < 0.001, analysis of variance and AITC: P = 0.002, t test), along with CAP and potassium depolarization (CAP: P < 0.001, t test and KCl: P < 0.001, t test). Black lines indicate time of ligand application. *P < 0.05, **P < 0.01, ***P < 0.001.
Fig. 4.
Fig. 4.
Two pharmacologically distinct populations of EVA reactivity in vagal afferent neurons. Distinct profiles from EVA concentration–response curves suggest two functionally distinct groups of EVA-responsive neurons. (A) Representative calcium traces showing profiles of high-sensitivity EVA-responsive neuron (left) and a low-sensitivity EVA-responsive neuron (right). Neurons were grouped into the high-sensitivity group if they responded to 300 μM EVA or less. (B) EVA dose-response curves between two different populations of EVA-sensitive neurons (dark circles: highly sensitive neurons; open circles: less sensitive neurons) (high sensitivity, N = 32 neurons; low sensitivity, N = 31 neurons). Group data were fit with a sigmoidal curve, and the following parameters were determined. (C) Comparison of the EC50 concentrations between high- and low-responsive populations of EVA-sensitive neurons (P < 0.001, t test). (D) The peak response of EVA-induced increase in cytosolic calcium (P = 0.002, t test). (E) The slope of the linear phase for the sigmoidal fits between groups of responsive neurons (P = 0.02, t test). **P < 0.01, ***P < 0.001.
Fig. 5.
Fig. 5.
Threshold EVA responsiveness predicts two populations of AITC-responsive neurons. (A) Representative calcium traces showing profiles of two distinct populations of vagal afferent neurons that respond differentially to increasing concentrations of AITC depending on their sensitivity to EVA at 300 μM (left: responds to EVA at 300 μM; right: does not respond to EVA at 300 μM). (B) AITC concentration–response curves depending on sensitivity to EVA at 300 μM (filled circles: EVA sensitive; open circles: EVA insensitive) (EVA+, N = 48 neurons; EVA, N = 25 neurons). (C) The EC50 concentration between the two different populations of AITC-sensitive neurons depending on sensitivity to EVA at 300 μM was statistically different (dark column: EVA sensitive; open column: EVA insensitive) (P < 0.001, t test). (D) The maximum AITC-induced increase in cytosolic calcium between two different populations of neurons depending on EVA sensitivity (P = 0.008, t test). (E) The slope of the linear phase in the sigmoid fit was not statistically different between the two AITC-responsive populations (P = 0.39, t test). **P < 0.01, ***P < 0.001.
Fig. 6.
Fig. 6.
AITC masks the response to EVA. When AITC is applied first, the subsequent response to EVA is diminished. This does not occur to the AITC response when EVA is applied first. (A) Representative trace of a neuron that responds to EVA (3 mM) and AITC (300 µM) when EVA application precedes AITC (left) and when AITC application precedes EVA (right). (B) Average AITC and EVA increases in cytosolic calcium from vagal afferents in which AITC application precedes EVA (N = 26 neurons) and in which EVA application precedes AITC (N = 42 neurons). AITC responses were not statistically different between the two conditions (P = 0.45, t test), whereas EVA was significantly reduced when it followed AITC (P < 0.001, t test). (C) Representative trace of a neuron that responds to 300 µM AITC and 100 nM CAP when AITC applications precede CAP (left trace) and when CAP application precedes AITC (right trace). (D) Average AITC and CAP increase in cytosolic calcium from vagal afferents in which AITC application precedes CAP (N = 11 neurons) and in which CAP application precedes AITC (N = 12 neurons). Neither AITC (P = 0.73, t test) nor the CAP (P = 0.59, t test) responses were statistically different between the two conditions. (E) Representative EVA (3 mM) and AITC (300 µM) response traces from TRPA1-GFP–transfected COS-7 cells when EVA application precedes AITC (left) and when AITC application precedes EVA (right). (F) Average AITC and EVA increases in cytosolic calcium from TRPA1-GFP–transfected COS-7 cells in which AITC application precedes EVA (N = 125 cells) and in which EVA application precedes AITC (N = 78 cells). AITC responses were not statistically different between the two conditions (P = 0.28, Mann–Whitney), whereas EVA was significantly reduced when it followed AITC (P < 0.001, Mann–Whitney). Group data are expressed as average ± S.E.M. ***P < 0.001.
Fig. 7.
Fig. 7.
Intracellular glutathione reduces both AITC and EVA currents. AITC is known to activate TRPA1 via intracellular oxidation; however, the extent to which this occurs for EVA is unknown. In this figure, we compare the responses between standard intracellular solutions or with glutathione (10 mM) present. (A) Representative traces showing AITC-induced currents under control (left) and with intracellular glutathione (right). (B, left panel) Average AITC-induced current density from control (N = 9 cells) and glutathione groups (N = 10 cells). The presence of intracellular glutathione significantly reduced the AITC-induced current (P = 0.049, t test). (B, right panel) Mean AITC currents normalized to the average control value. (C) Representative traces showing EVA-induced currents under control (left) and with intracellular glutathione (right). (D, left panel) Average EVA-induced current density from control (N = 9 cells) and glutathione groups (N = 10 cells). Intracellular glutathione significantly reduced the EVA current (P = 0.003, t test). (D, right panel) Mean EVA currents normalized to the average control value. Currents have been normalized to cell capacitance to control for differences in cell size. *P < 0.05, **P < 0.01.

Similar articles

Cited by

References

    1. Alvarez-Berdugo D, Rofes L, Farré R, Casamitjana JF, Enrique A, Chamizo J, Padrón A, Navarro X, Clavé P. (2016) Localization and expression of TRPV1 and TRPA1 in the human oropharynx and larynx. Neurogastroenterol Motil 28:91–100. - PubMed
    1. Bandell M, Story GM, Hwang SW, Viswanath V, Eid SR, Petrus MJ, Earley TJ, Patapoutian A. (2004) Noxious cold ion channel TRPA1 is activated by pungent compounds and bradykinin. Neuron 41:849–857. - PubMed
    1. Bautista DM, Jordt SE, Nikai T, Tsuruda PR, Read AJ, Poblete J, Yamoah EN, Basbaum AI, Julius D. (2006) TRPA1 mediates the inflammatory actions of environmental irritants and proalgesic agents. Cell 124:1269–1282. - PubMed
    1. Bautista DM, Movahed P, Hinman A, Axelsson HE, Sterner O, Högestätt ED, Julius D, Jordt SE, Zygmunt PM. (2005) Pungent products from garlic activate the sensory ion channel TRPA1. Proc Natl Acad Sci USA 102:12248–12252. - PMC - PubMed
    1. Brierley SM, Hughes PA, Page AJ, Kwan KY, Martin CM, O'Donnell TA, Cooper NJ, Harrington AM, Adam B, Liebregts T, et al. (2009) The ion channel TRPA1 is required for normal mechanosensation and is modulated by algesic stimuli. Gastroenterology 137:2084-2095 e2083. - PMC - PubMed

MeSH terms

LinkOut - more resources