. 2017 May 31:8:882.
doi: 10.3389/fpls.2017.00882. eCollection 2017.

Metabolome Dynamics of Smutted Sugarcane Reveals Mechanisms Involved in Disease Progression and Whip Emission

Affiliations

Metabolome Dynamics of Smutted Sugarcane Reveals Mechanisms Involved in Disease Progression and Whip Emission

Patricia D C Schaker et al. Front Plant Sci. .

Abstract

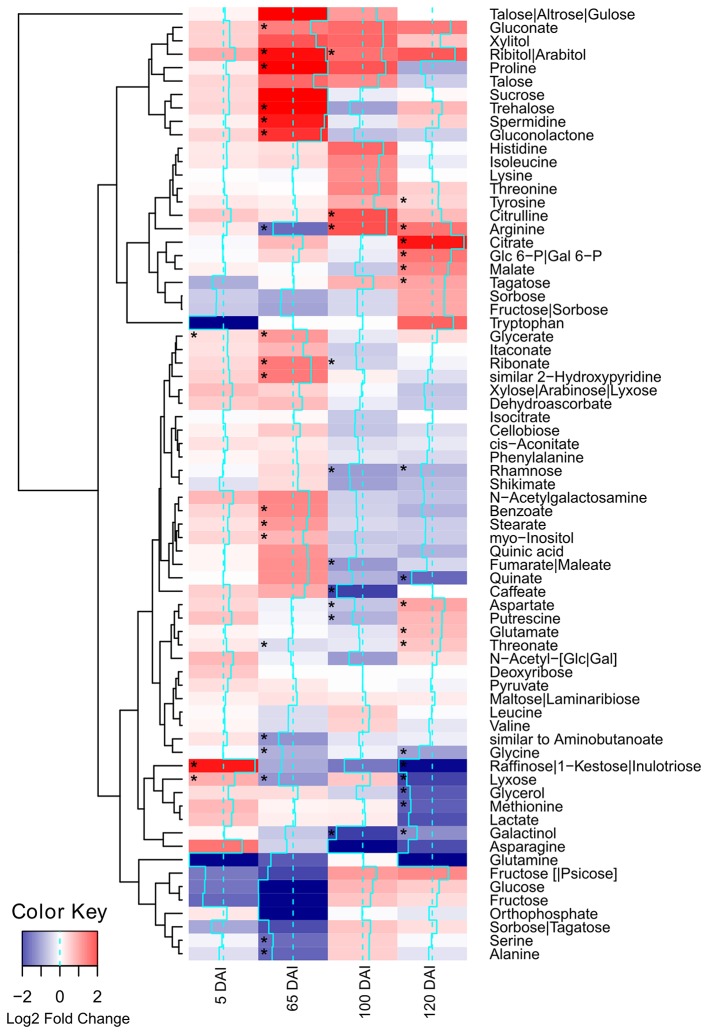
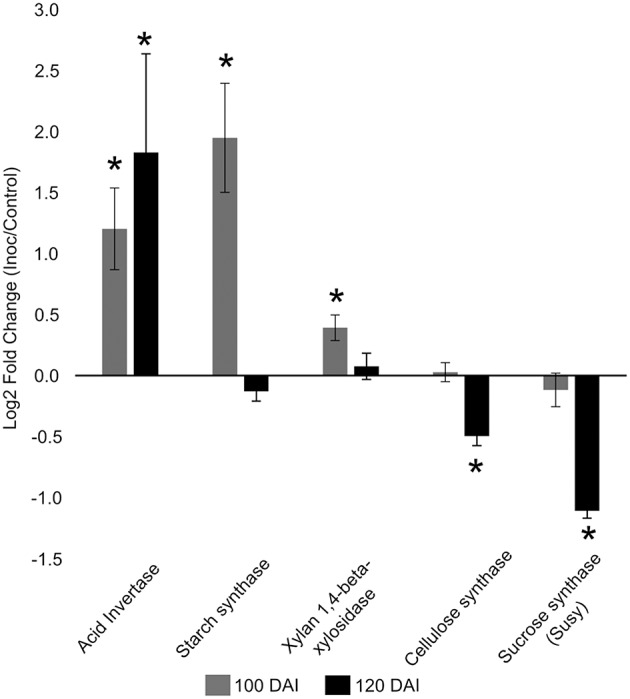
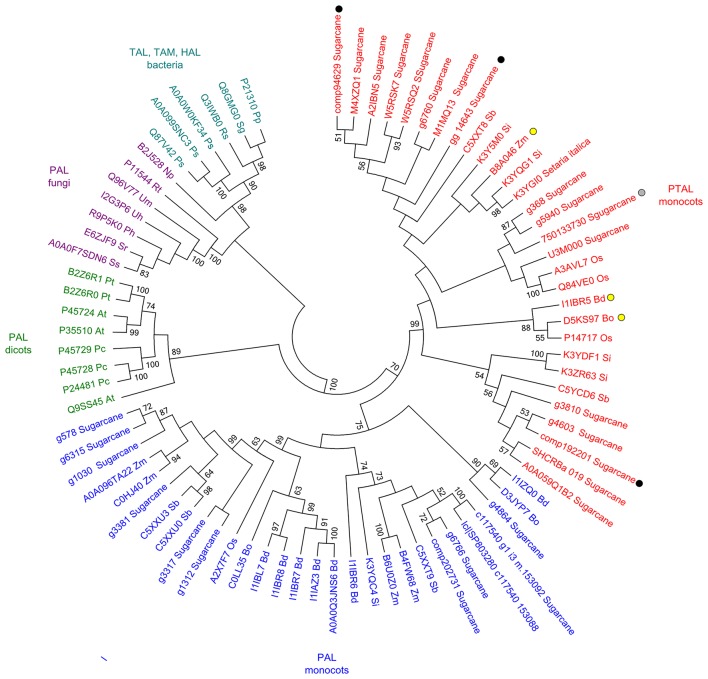
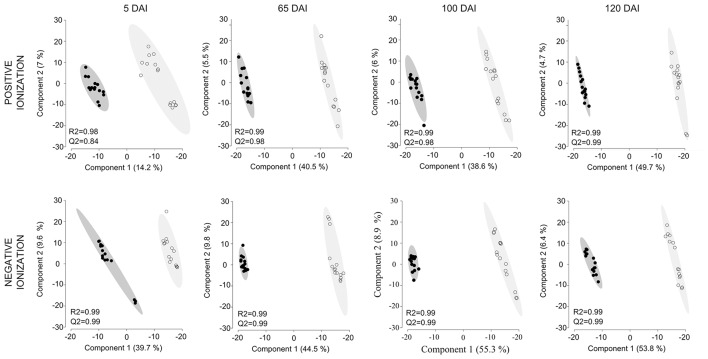
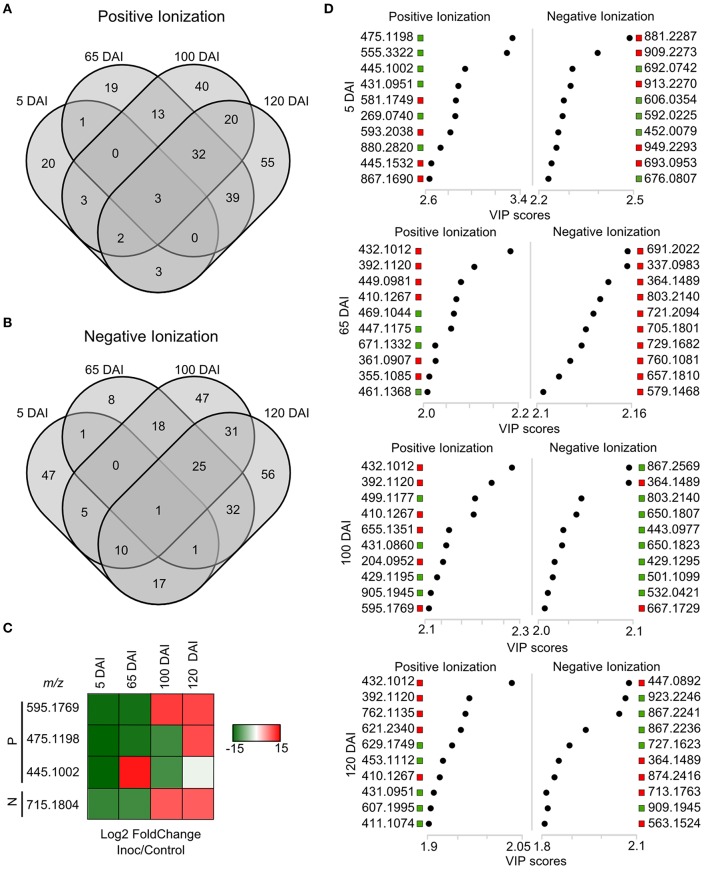
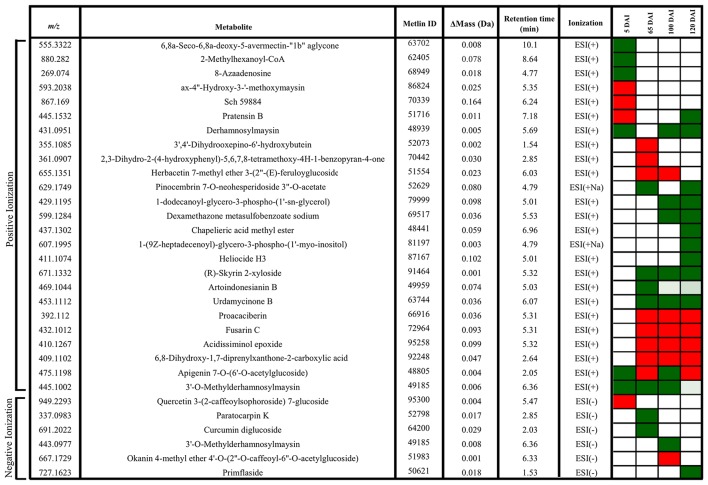
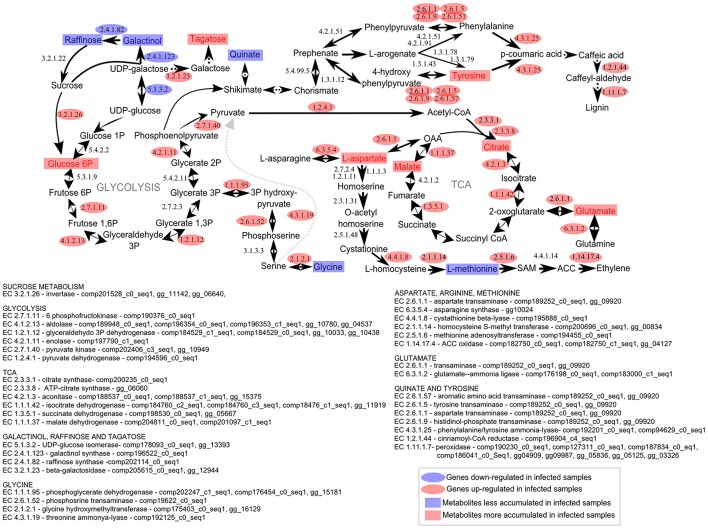
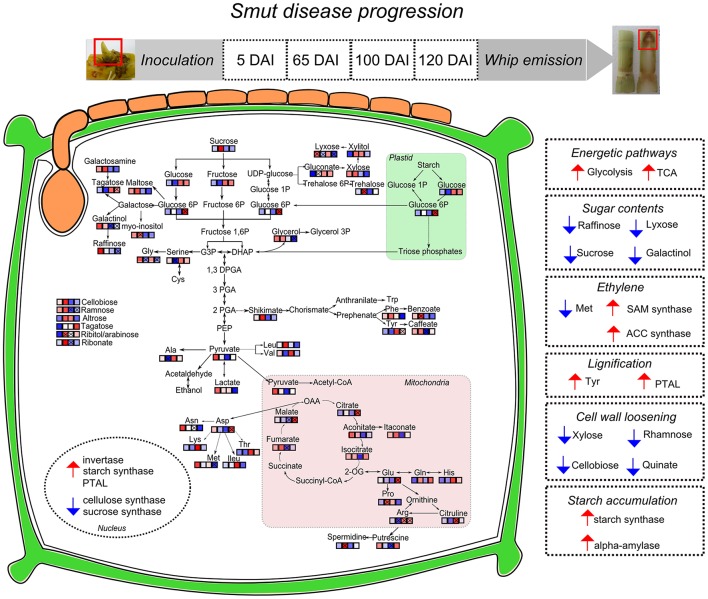
Sugarcane smut disease, caused by the biotrophic fungus Sporisorium scitamineum, is characterized by the development of a whip-like structure from the plant meristem. The disease causes negative effects on sucrose accumulation, fiber content and juice quality. The aim of this study was to exam whether the transcriptomic changes already described during the infection of sugarcane by S. scitamineum result in changes at the metabolomic level. To address this question, an analysis was conducted during the initial stage of the interaction and through disease progression in a susceptible sugarcane genotype. GC-TOF-MS allowed the identification of 73 primary metabolites. A set of these compounds was quantitatively altered at each analyzed point as compared with healthy plants. The results revealed that energetic pathways and amino acid pools were affected throughout the interaction. Raffinose levels increased shortly after infection but decreased remarkably after whip emission. Changes related to cell wall biosynthesis were characteristic of disease progression and suggested a loosening of its structure to allow whip growth. Lignin biosynthesis related to whip formation may rely on Tyr metabolism through the overexpression of a bifunctional PTAL. The altered levels of Met residues along with overexpression of SAM synthetase and ACC synthase genes suggested a role for ethylene in whip emission. Moreover, unique secondary metabolites antifungal-related were identified using LC-ESI-MS approach, which may have potential biomarker applications. Lastly, a putative toxin was the most important fungal metabolite identified whose role during infection remains to be established.

Keywords: fungal pathogen; meristem; metabolomics; plant–microbe interactions; sugarcane smut.


Figures

Figure 1
Figure 1
Sporisorium scitamineum DNA quantification assay in sugarcane shoot apical meristem region. Real-time qPCR analysis in samples used to obtain metabolomic data. Quantities are relative to 100 ng of total DNA. “a” and “b” represent statistical significance (t-test, p < 0.05). Standard curves and amplification efficiency were used as described by Peters (2016).
Figure 2
Figure 2
Metabolites of sugarcane shoot apical meristem region identified in GC-TOF-MS analysis. Heatmap was built using Log2 Fold Change (Inoculated/Control) of relativized medians using gplots (Warnes et al., 2013) for R (R Core Team, 2015). Blue scale indicates low concentration in infected samples, and red scale indicates high concentration in infected samples. Squares “*” marked represent metabolites showing statistical significance comparing infected vs. control (t-test, p < 0.05).
Figure 3
Figure 3
Gene expression profiles in sugarcane shoot apical meristem region. RT-qPCR analysis of key sugarcane genes related to smut disease. “*”: indicates significant changes of transcripts in infected plants compared to control ones (t-test, p = 0.05). Genes: acid invertase, starch synthase, xylan 1,4 beta xylosidase, cellulose synthase, sucrose synthase. Data are presented as Log2 Fold Change of infected/control samples.
Figure 4
Figure 4
Starch accumulation after whip emission. Potassium iodide-iodine reaction (I2KI) staining was used to detect starch by light microscopy in different fresh sections of sugarcane tissues. (A) Internal view of sugarcane whip; (B,C) whip region with intense sporulation; (D,E) basis of whip; (F,G) primary meristem; (H,I) stem. Scale bars = 10 μm.
Figure 5
Figure 5
Sequence analysis of PAL and PTAL proteins. Phylogenetic tree of PTAL and PAL in plants and fungi, and TAL, tyrosine ammonia-mutase (TAM) and histidine ammonia-lyase (HAL) in bacteria. Multiple sequence alignments obtained in ClustalW implemented in MEGA 6.06 Software (Tamura et al., 2013) with default settings. Maximum-likelihood algorithm was used to build the phylogenetic tree with the following settings: JTT model, 1,000 replicates of bootstrap analyses, with the best network-network interface (NNI) topology search. Protein sequences were obtained from Uniprot and GenBank (Supporting Information File S1). Black circles: sugarcane genes encoding the enzymes up-regulated in plants after whip development (Schaker et al., 2016); Gray circle: sugarcane protein identified exclusively in sugarcane plants after whip development (Barnabas et al., 2016); Yellow circles: previously reported PTAL proteins (Barros et al., ; Maeda, 2016).
Figure 6
Figure 6
Secondary metabolites differentiating infected and non-infected plants in sugarcane shoot apical meristem region. PLS-DA plots obtained in Metaboanalyst software using LC-ESI-MS metabolome profile from positive and negative ionization in 5, 65, 100, and 120 DAI samples. Black dots represent biological and technical replicates of control plants, empty dots represent infected plants. Ellipses indicates the 95% confidence region. R2 and Q2 values obtained by cross-validation using three components.
Figure 7
Figure 7
LC-ESI-MS metabolomics analysis in sugarcane-smut interaction. Four-way Venn diagram representing differentially accumulated (FDR ≤ 0.05) non-redundant m/z of each time point analyzed among infected and control plants of the same age using (A) positive and (B) negative ionizations. (C) Heatmap shows the dynamics of these metabolites during the progression of sugarcane smut disease. It was obtained with gplots (Warnes et al., 2013) for R (R Core Team, 2015) with Log2 Fold Change (inoculated/control) values of shared differentially accumulated m/z from Venn diagrams. “P”: Positive ionization, “N”: negative ionization. (D) Top 10 m/z based on VIP scores from PLS-DA for each time point analyzed in positive and negative ionization. These m/z were submitted to LC-ESI-MS/MS analysis to confirm their identity. The x-axis shows the correlation scores and y-axis corresponds to LC-ESI-MS m/z. Distribution of each m/z in inoculated plants compared to controls is represented as colored squares. Red squares represent those exclusively identified in inoculated samples, green squares represent m/z identified exclusively identified in control samples.
Figure 8
Figure 8
Metabolites of sugarcane shoot apical meristem region identified in LC-ESI-MS/MS analysis. ACD/Labs software was used to theoretical fragmentation of structures from Metlin database (https://metlin.scripps.edu/index.php). Green filled squares represent metabolites detected only in control samples; red filled squares represent metabolites identified only in infected samples.
Figure 9
Figure 9
Metabolomic and transcriptomic responses in sugarcane shoot apical meristem region related to whip emission 120 DAI of S. scitamineum. Transcriptomic data were obtained from a previous experiment using the same sugarcane genotype and experimental design (Schaker et al., 2016). Rectangles represent metabolites and ovals represent enzyme-encoded by genes detected previously (Schaker et al., 2016) within the same metabolic pathway. Red and Blue represent up or down regulation in infected plants, respectively.
Figure 10
Figure 10
Sugarcane responses to S. scitamineum colonization during disease progression and whip emission. Identified metabolites in GC-MS analysis were incorporated in pathways and each square represent the sampling days after inoculation (5, 65, 100, and 120 DAI). “x” assigned represent significant regulation (p < 0.05), blue squares represent metabolites less accumulated and red represent more accumulated in infected samples. Nuclear compartment represents genes with differential expression in RT-qPCR analysis. Right squares in dotted lines summarize the hypotheses built on metabolomics and previous transcriptomics analysis of sugarcane-smut interaction as discussed in the main text. Smut-infected plants increase energetic demands to feed whip development, along with changes in several sugars, which may involve changes in plant signaling. Hormonal imbalance in infected plants is exemplified by ethylene biosynthesis pathway regulated in both metabolites and gene expression assays. Phenylpropanoid pathway is activated in meristems of infected plants probably through activation of a bifunctional PTAL and Tyr accumulation. Conversely, metabolites and genes related to precursors of plant cell wall are less accumulated in meristem of infected samples, indicating that cell wall loosening occurs to allow whip emission. Whip growth as well as pathogen sporulation may be fed by the starch accumulated in meristems of infected plants.

References

    1. Abdallah M., Krska R., Sulyok M. (2016). Mycotoxin contamination in sugarcane grass and juice: first report on detection of multiple mycotoxins and exposure assessment for aflatoxins B1 and G1 in humans. Toxins (Basel). 8:343 10.3390/toxins8110343 - DOI - PMC - PubMed
    1. Allwood J. W., Ellis D. I., Goodacre R. (2008). Metabolomic technologies and their application to the study of plants and plant–host interactions. Physiol. Plant. 132, 117–135. 10.1111/j.1399-3054.2007.01001.x - DOI - PubMed
    1. Allwood J. W., Heald J., Lloyd A. J., Goodacre R., Mur L. A. J. (2012). Separating the inseparable: the metabolomic analysis of plant-pathogen interactions. Methods Mol. Biol. 860, 31–49. 10.1007/978-1-61779-594-7_3 - DOI - PubMed
    1. Barnabas L., Ashwin N. M. R., Kaverinathan K., Trentin A. R., Pivato M., Sundar A. R., et al. (2016). Proteomic analysis of a compatible interaction between sugarcane and Sporisorium scitamineum. Proteomics 16, 1111–1122. 10.1002/pmic.201500245 - DOI - PubMed
    1. Barros J., Serrani-yarce J. C., Chen F., Baxter D., Venables B. J., Dixon R. A., et al. (2016). Role of bifunctional ammonia-lyase in grass cell wall biosynthesis. Nat. Plants 2, 1–9. 10.1038/nplants.2016.50 - DOI - PubMed

LinkOut - more resources