. 2017 Dec;5(4):435-447.
doi: 10.1002/iid3.181. Epub 2017 Jun 16.

Depletion of FoxP3+ Tregs improves control of larval Echinococcus multilocularis infection by promoting co-stimulation and Th1/17 immunity

Affiliations

Depletion of FoxP3+ Tregs improves control of larval Echinococcus multilocularis infection by promoting co-stimulation and Th1/17 immunity

Junhua Wang et al. Immun Inflamm Dis. 2017 Dec.

Abstract

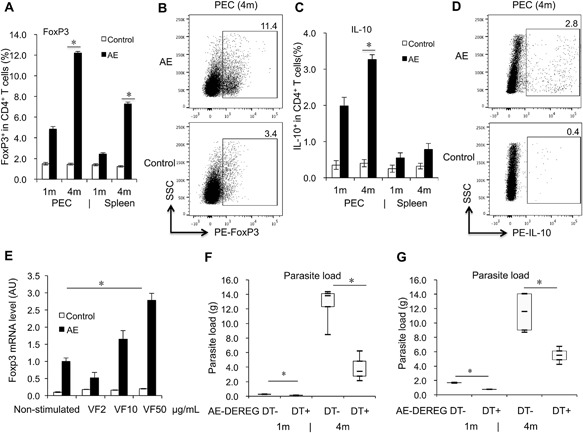
Introduction: The growth potential of the tumor-like Echinococcus multilocularis metacestode (causing alveolar echinococcosis, AE) is directly linked to the nature/function of the periparasitic host immune-mediated processes. Previous studies had shown that regulatory T cells (Tregs) become gradually up-regulated in the course of both chronic human and murine AE. Thus we now tackled the role of FoxP3+ Tregs and FoxP3+ -Treg-regulated immune response in contributing to the control of this helminthic infection.

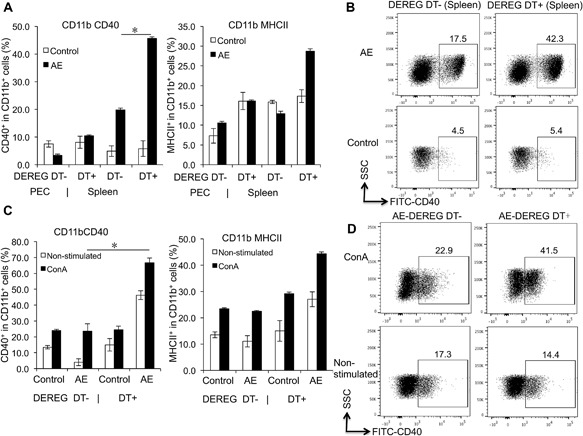
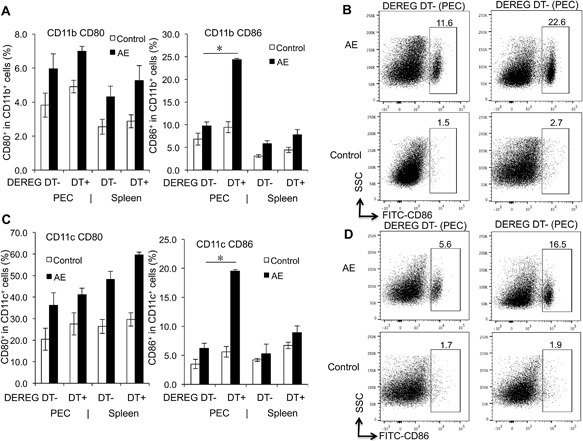
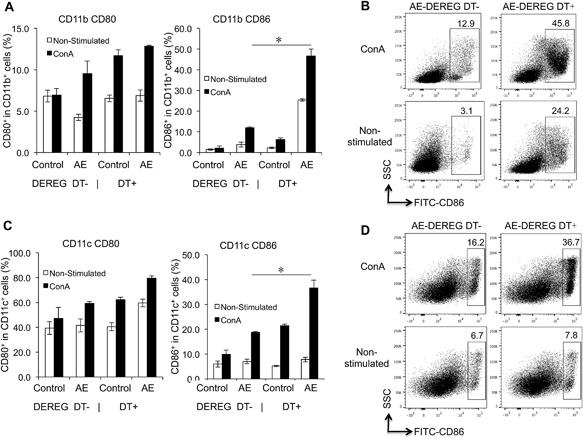
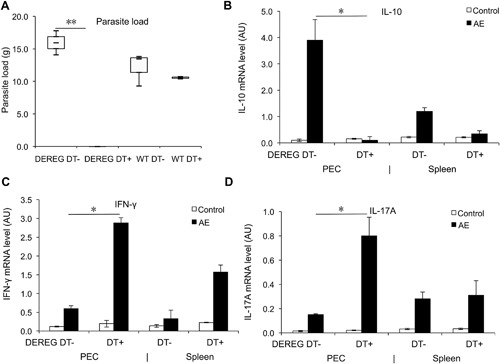
Methods: The infection outcome in E. multilocularis-infected DEREG mice was measured upon determining parasite load (wet weight of parasitic metacestode tissue). Flow cytometry and qRT-PCR were used to assess Treg, Th17-, Th1-, Th2-type immune responses and antigen presenting cell activation.

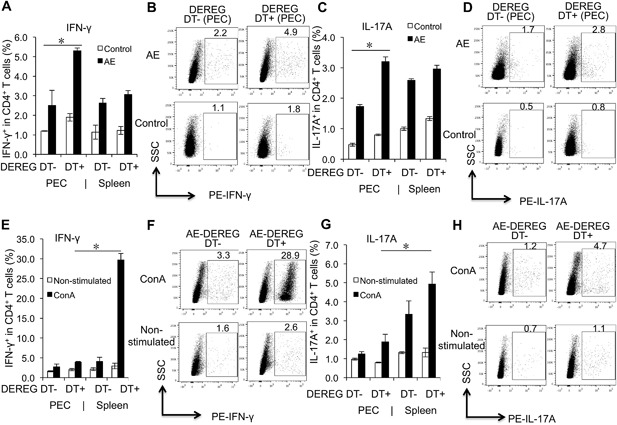
Results: We showed that E. multilocularis-infected DEREG-mice treated with DT (as compared to infected control DEREG-mice without DT application) exhibited a significantly lower parasite load, associated with a persisting capacity of co-stimulation, and an increased Th1/Th17-polarization.

Conclusions: FoxP3+ Tregs appear as one of the key players in immune regulatory processes favoring (i) metacestode survival by inhibiting the maturation potential of co-stimulatory activity and (ii) T cell exhaustion (suppressing Th1/Th17-type immune responses). We showed as well that prospectively, targeting FoxP3+ Tregs could be an option to develop an immunotherapy against AE.

Keywords: CD4+ CD25+ Treg; Echinococcus multilocularis; Foxp3; Th1/Th17 immunity; co-stimulation.


Figures

Figure 1
Figure 1
FoxP3‐ and IL‐10‐levels affected by E. multilocularis infection, and association between FoxP3 and metabolites, parasite load development in E. multilocularis‐infected mice. (A) Frequency of FoxP3+ T cells within CD4+ T cells in PECs and spleen cells from AE‐WT and Control‐WT mice at 1 month and 4 months post‐infection. (B) Representative images of FoxP3+ T cells within CD4+ T cells in PECs from both AE‐WT and Control‐WT mice at 4 months post‐infection. (C) Frequency of IL‐10+ T cells within CD4+ T cells in PECs and spleen cells from AE‐WT and Control‐WT mice at 1 month and 4 months post‐infection. (D) Representative images of IL‐10+ T cells within CD4+ T cells in PECs from both AE‐WT and Control‐WT mice at 4 months post‐infection. Comparison between groups was performed using a one‐way ANOVA with Bonferroni's multiple comparison post‐test for statistical analysis. *p < 0.006 (E) foxp3 gene expression in spleen cells from AE‐WT and Control‐WT mice, co‐cultured with 2, 10, 50 µg/mL E. multilocularivesicle fluid (VF) (measured by qRT‐PCR). The same cell reactions performed without VF were used as non‐stimulated controls. *p < 0.05. AU: arbitrary units. (F) Parasite load in AE‐DEREG DT‐ and AE‐DEREG DT+ mice assessed by wet weight measurement at 1 month and 4 months post‐ infection. DT application with 110 ng/injection/mouse started 1 day before infection and was maintained for 4 months (three times/week). (G) Parasite load in AE‐DEREG DT‐ and AE‐DEREG DT+ mice assessed by wet weight measurement at 1 month and 4 months post‐ infection. DT application with 110 ng/injection/mouse (three times/week) started 1 day before infection and was maintained for 1 month. Data represent mean ± SD of three independent experiments of a total of 8–10 mice in each group (4–5 mice per group in each independent experiment). Comparison between groups was performed using a one‐way ANOVA for statistical analysis. *p < 0.05. “DEREG DT‐,” foxp3 inducible knock‐down mice (DEREG mice) without DT application; “DEREG DT+,” DEREG mice with DT application; “AE‐ DEREG DT‐,” E. multilocularis‐infected DEREG without DT application; “AE‐ DEREG DT+,” E. multilocularis‐infected DEREG mice with DT application. “Control,” non‐infected mice; “1 m,” 1‐month p.i.; “4 m,” 4 months p.i. “PEC,” peritoneal exudate cells; “Spleen,” spleen cells.
Figure 2
Figure 2
CD40 and MHCII expression levels in both CD11b+ APCs in both AE‐DEREG DT‐ and AE‐DEREG DT+ mice at 1 month post‐infection, and in response to ConA. (A) Frequency of co‐stimulation markers CD40 and MHCII within CD11b+ APCs in peritoneal and spleen cells from AE‐DEREG DT‐ and AE‐DEREG DT+ mice 1 month post infection. (B) Representative images of CD40+ cells within CD11b+ APCs in spleen cells from both AE‐DEREG DT‐ and AE‐DEREG DT+ mice at 1 month post‐infection, non‐infected mice as Control mice. (C) Frequency of co‐stimulation markers CD40 and MHCII within CD11b+ APCs in spleen cells from AE‐DEREG DT‐ and AE‐DEREG DT+ mice, co‐cultured with 2 µg/mL ConA. (D) Representative images of CD40+ cells within CD11b+ APCs in spleen cells from both AE‐DEREG DT‐ and AE‐DEREG DT+ mice at 1 month post‐infection (non‐infected mice as Control mice), co‐cultured with 2 µg/mL ConA. The same cell reactions performed without ConA were used as non‐stimulated controls. DT application with 110 ng/in jection/mouse started 1 day before infection and was maintained for 4 months (three times/week). Data represent mean ± SD of three independent experiments of a total of 8–10 mice in each group (4–5 mice per group in each independent experiment). Comparison between groups was performed using a one‐way ANOVA with Bonferroni's multiple comparison post‐test for statistical analysis. *p < 0.01. “DEREG DT‐,” foxp3 inducible knock‐down mice (DEREG mice) without DT application; “DEREG DT+,” DEREG mice with DT application; “AE‐ DEREG DT‐,” E. multilocularis‐infected DEREG without DT application; “AE‐ DEREG DT+,” E. multilocularis‐infected DEREG mice with DT application. “Control,” non‐infected mice; “1 m,” 1‐month p.i.; “4 m,” 4 months p.i.. “PEC,” peritoneal exudate cells; “Spleen,” spleen cells.
Figure 3
Figure 3
CD80 and CD86 expression levels in both CD11b+ and CD11c+ APCs, in both AE‐DEREG DT‐ and AE‐DEREG DT+ mice at 1 month post‐infection. (A) Frequency of CD80 and CD86 within CD11b+ APCs in peritoneal and spleen cells from AE‐DEREG DT‐ and AE‐DEREG DT+ mice 1 month post infection. (B) Representative images of CD86+ cells within CD11b+ cells in PECs from both AE‐DEREG DT‐ and AE‐DEREG DT+ mice at 1 month post‐infection, non‐infected mice as Control mice. (C) Frequency of CD80 and CD86 within CD11c+ APCs in peritoneal and spleen cells from AE‐DEREG DT‐ and AE‐DEREG DT+ mice 1 month post infection. (D) Representative images of CD86+ cells within CD11c+ APCs in PECs from both AE‐DEREG DT‐ and AE‐DEREG DT+ mice at 1 month post‐infection, non‐infected mice as Control mice. DT application with 110 ng/injection/mouse started 1 day before infection and was maintained for 4 months (three times/week). Data represent mean ± SD of three independent experiments of a total of 8–10 mice in each group (4–5 mice per group in each independent experiment). Comparison between groups was performed using a one‐way ANOVA with Bonferroni's multiple comparison post‐test for statistical analysis. *p < 0.01. “DEREG DT‐,” foxp3 inducible knock‐down mice (DEREG mice) without DT application; “DEREG DT + ”, DEREG mice with DT application; “AE‐ DEREG DT‐,” E. multilocularis‐infected DEREG without DT application; “AE‐ DEREG DT+,” E. multilocularis‐infected DEREG mice with DT application. “Control,” non‐infected mice; “1 m,” 1‐month p.i.; “4 m,” 4 months p.i.. “PEC,” peritoneal exudate cells; “Spleen,” spleen cells.
Figure 4
Figure 4
CD80 and CD86 expression levels in both CD11b+ and CD11c+ APCs, in response to ConA in both AE‐DEREG DT‐ and AE‐DEREG DT+ mice at 1 month post‐infection. (A) Frequency of CD80 and CD86 within CD11b+ APCs in spleen cells from AE‐DEREG DT‐ and AE‐DEREG DT+ mice 1 month post infection, co‐cultured with 2 µg/mL ConA. (B) Representative images of CD86+ cells within CD11b+ APCs in spleen cells from both AE‐DEREG DT‐ and AE‐DEREG DT+ mice at 1 month post‐infection (non‐infected mice as Control mice), co‐cultured with 2 µg/mL ConA. (C) Frequency of CD80 and CD86 within CD11c+ APCs in spleen cells from AE‐DEREG DT‐ and AE‐DEREG DT+ mice 1 month post infection, co‐cultured with 2 µg/mL ConA. (D) Representative images of CD86+ cells within CD11c+ APCs in spleen cells from both AE‐DEREG DT‐ and AE‐DEREG DT+ mice at 1 month post‐infection (non‐infected mice as Control mice), co‐cultured with 2 µg/mL ConA. The same cell reactions performed without ConA were used as non‐stimulated controls. DT application with 110 ng/injection/mouse started 1 day before infection and was maintained for 4 months (three times/week). Data represent mean ± SD of three independent experiments of a total of 8–10 mice in each group (4–5 mice per group in each independent experiment). Comparison between groups was performed using a one‐way ANOVA with Bonferroni's multiple comparison post‐test for statistical analysis. *p < 0.01. “DEREG DT‐,” foxp3 inducible knock‐down mice (DEREG mice) without DT application; “DEREG DT+,” DEREG mice with DT application; “AE‐ DEREG DT‐,” E. multilocularis‐infected DEREG without DT application; “AE‐ DEREG DT+,” E. multilocularis‐infected DEREG mice with DT application. “Control,” non‐infected mice; “1 m,” 1‐month p.i.; “4 m,” 4 months p.i.
Figure 5
Figure 5
Th1/Th17 cell related cytokine expression in both AE‐DEREG DT‐ and AE‐DEREG DT+ mice at 1 month post‐infection, and in response to ConA. (A) Frequency of IFN‐γ+ within CD4+ T cells in peritoneal and spleen cells from AE‐DEREG DT‐ and AE‐DEREG DT+ mice at 1 month post infection, non‐infected mice as control mice. (B) Representative images of IFN‐γ+ cells within CD4+ T cells in PECs from both AE‐DEREG DT‐ and AE‐DEREG DT+ mice at 1 month post‐infection, non‐infected mice as control mice. (C) Frequency of IL‐17A+ within CD4+ T cells in peritoneal and spleen cells from AE‐DEREG DT‐ and AE‐DEREG DT+ mice at 1 month post infection, non‐infected mice as control mice. (D) Representative images of IL‐17A+ cells within CD4+ T cells in PECs from both AE‐DEREG DT‐ and AE‐DEREG DT+ mice at 1 month post‐infection, non‐infected mice as control mice. (E) Frequency of IFN‐γ+ within CD4+ T cells in peritoneal and spleen cells from AE‐DEREG DT‐ and AE‐DEREG DT+ mice (non‐infected mice as Control mice), co‐cultured with 2 µg/mL ConA. (F) Representative images of IFN‐γ+ cells within CD4+ T cells in spleen cells from both AE‐DEREG DT‐ and AE‐DEREG DT+ mice at 1 month post‐infection (non‐infected mice as Control mice), co‐cultured with 2 µg/mL ConA. (G) Frequency of IL‐17A+ within CD4+ T cells in peritoneal and spleen cells fromAE‐DEREG DT‐ and AE‐DEREG DT+ mice (non‐infected mice as Control mice), co‐cultured with 2 µg/mL ConA. (H) Representative images of IL‐17A+ cells within CD4+ T cells in spleen cells from both AE‐DEREG DT‐ and AE‐DEREG DT+ mice at 1 month post‐infection (non‐infected mice as Control mice), co‐cultured with 2 µg/mL ConA. The same cell reactions performed without ConA were used as non‐stimulated controls. DT application with 110 ng/injection/mouse started 1 day before infection and was maintained for 4 months (three times/week). Data represent mean ± SD of three independent experiments of a total of 8–10 mice in each group (4–5 mice per group in each independent experiment). Comparison between groups was performed using a one‐way ANOVA with Bonferroni's multiple comparison post‐test for statistical analysis. *p < 0.0125. “DEREG DT‐,” foxp3 inducible knock‐down mice (DEREG mice) without DT application; “DEREG DT+,” DEREG mice with DT application; “AE‐ DEREG DT‐,” E. multilocularis‐infected DEREG without DT application; “AE‐ DEREG DT+,” E. multilocularis‐infected DEREG mice with DT application. “Control,” non‐infected mice; “1 m,” 1‐month p.i.; “4 m,” 4 months p.i.. “PEC,” peritoneal exudate cells; “Spleen,” spleen cells.
Figure 6
Figure 6
Effects of FoxP3 as a post‐infection treatment target, assessed upon parasite load in E. multilocularis infected mice, and related T cell cytokine expression measured by qRT‐PCR. (A) Parasite load in AE‐DEREG DT‐ and AE‐DEREG DT+ mice assessed by wet weight measurement at 4 months post‐infection. DT application with 110 ng/mouse (three times/week) started 6 weeks post infection and was maintained until 4 months. (B) Il‐10 gene expression level in peritoneal and spleen cells from AE‐DEREG DT‐ and AE‐DEREG DT+ mice at 4 months post infection. (C) Ifn‐γ gene expression level in peritoneal and spleen cells from AE‐DEREG DT‐ and AE‐DEREG DT+ mice at 4 months post infection. (D) Il‐17a gene expression level in peritoneal and spleen cells from AE‐DEREG DT‐ and AE‐DEREG DT+ mice at 4 months post infection. Data represent mean ± SD of two independent experiments of a total of 8–10 mice in each group (4–5 mice per group in each independent experiment). Comparison between groups was performed using a one‐way ANOVA with Bonferroni's multiple comparison post‐test for statistical analysis. *p < 0.017. “WT,” wild type; “DEREG DT‐,” foxp3 inducible knock‐down mice (DEREG mice) without DT application; “DEREG DT+,” DEREG mice with DT application; “AE‐WT,” E. multilocularis‐infected wild type mice; “AE‐DEREG DT+,” E. multilocularis‐infected DEREG mice with DT application. “Control,” non‐infected mice; “1 m,” 1 month p.i.; “4 m,” 4 months p.i.. AU: arbitrary units.

Similar articles

Cited by

References

    1. Torgerson, P. R. , Keller K., Magnotta M., and Ragland N.. 2010. The global burden of alveolar echinococcosis. PLoS Negl. Trop. Dis. 4:e722. - PMC - PubMed
    1. Vuitton, D. A. 2003. The ambiguous role of immunity in echinococcosis: protection of the host or of the parasite? Acta. Trop. 85:119–132. - PubMed
    1. Vuitton, D. A. , Zhang S. L., Yang Y., Godot V., Beurton I., Mantion G., and Bresson‐Hadni S.. 2006. Survival strategy of Echinococcus multilocularis in the human host. Parasitol. Int. 55(Suppl):S51–S55. - PubMed
    1. Wang, J. , Lin R., Zhang W., Li L., Gottstein B., Blagosklonov O., Lu G., Zhang C., Lu X., Vuitton D. A., et al. 2014. Transcriptional profiles of cytokine/chemokine factors of immune cell‐homing to the parasitic lesions: a comprehensive one‐year course study in the liver of E. multilocularis‐infected mice. PLoS ONE 9:e91638. - PMC - PubMed
    1. Tuxun, T. , Wang J. H., Lin R. Y., Shan J. Y., Tai Q. W., Li T., Zhang J. H., Zhao J. M., and Wen H.. 2012. Th17/Treg imbalance in patients with liver cystic echinococcosis. Parasite. Immunol. 34:520–527. - PubMed

Publication types

MeSH terms