. 2017 Aug;27(8):967-988.
doi: 10.1038/cr.2017.82. Epub 2017 Jun 16.

Single-cell multi-omics sequencing of mouse early embryos and embryonic stem cells

Affiliations

Single-cell multi-omics sequencing of mouse early embryos and embryonic stem cells

Fan Guo et al. Cell Res. 2017 Aug.

Abstract

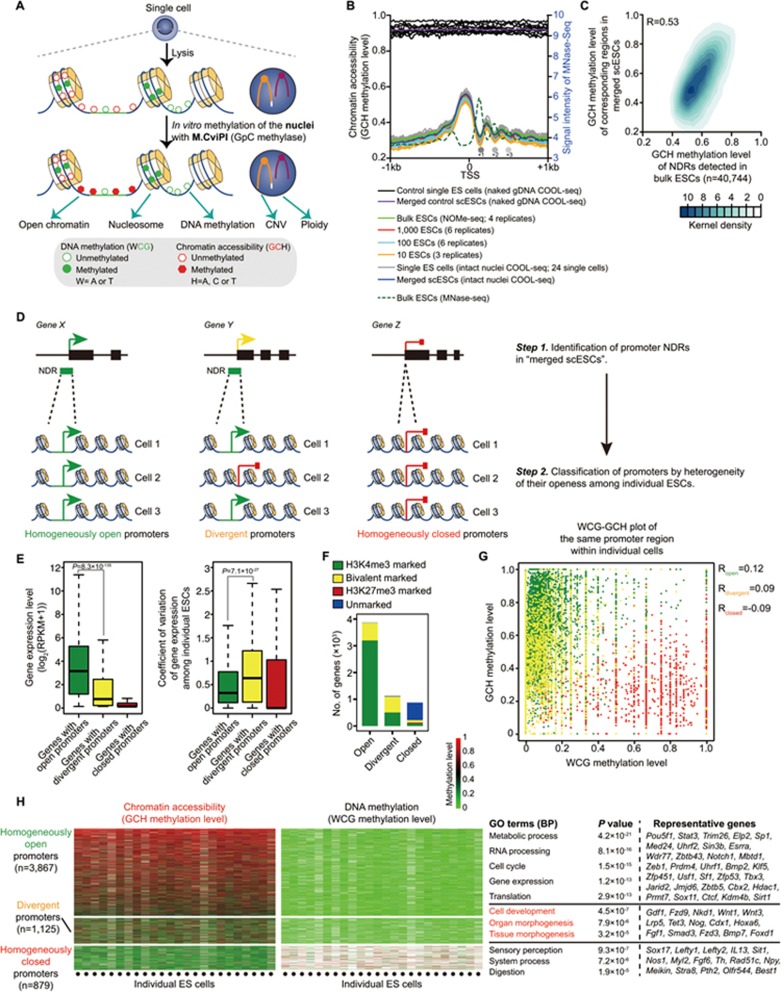
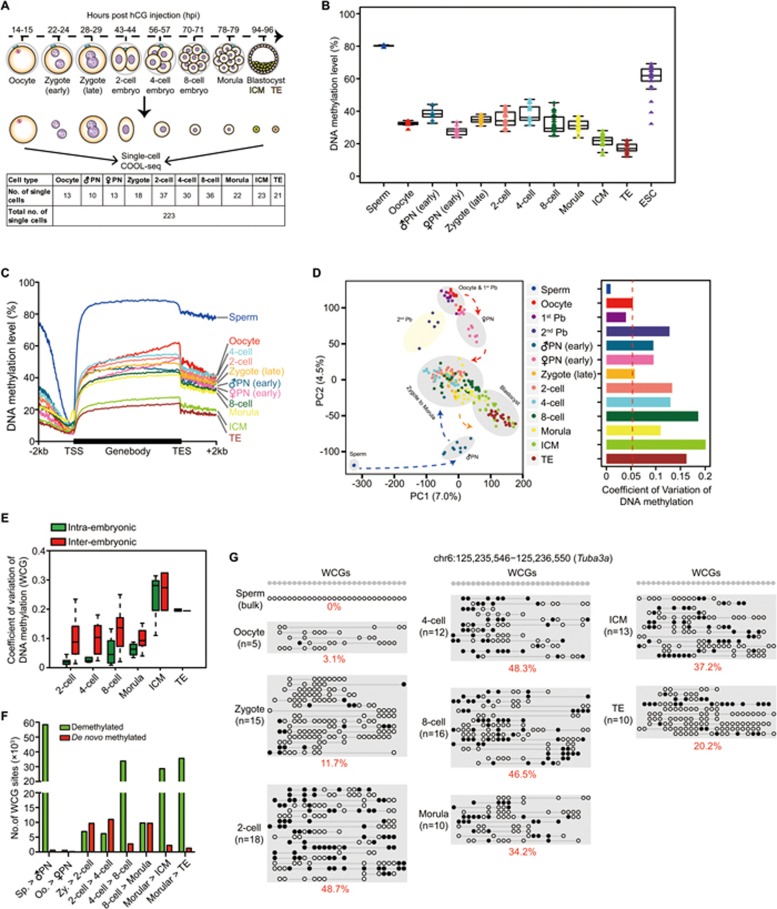
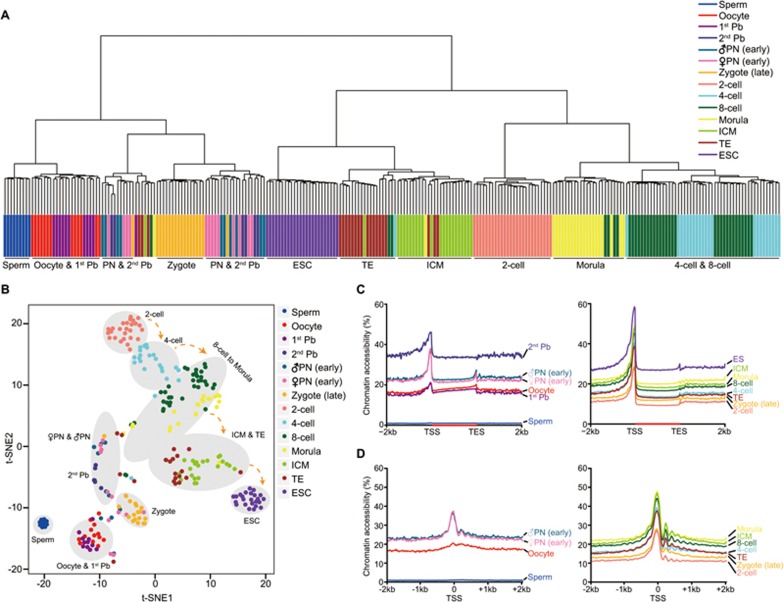
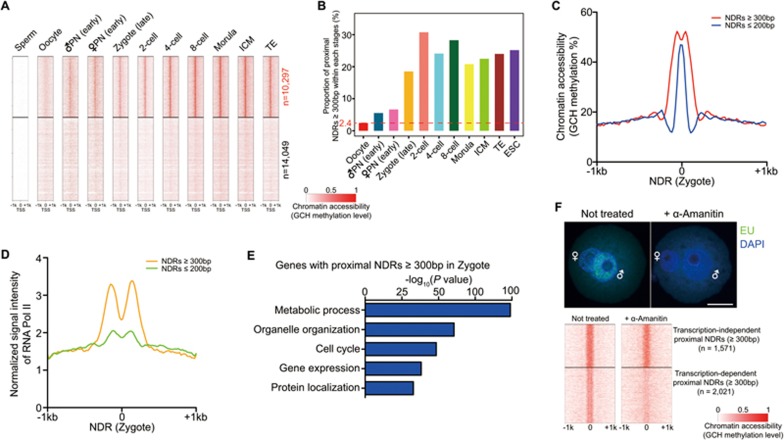
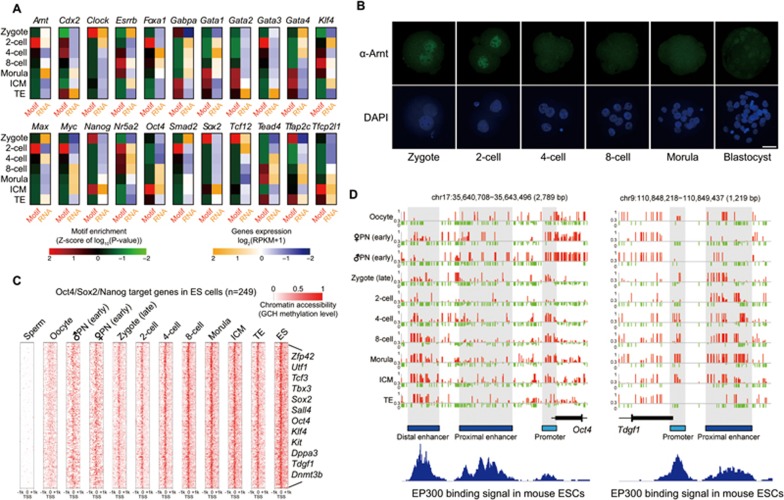
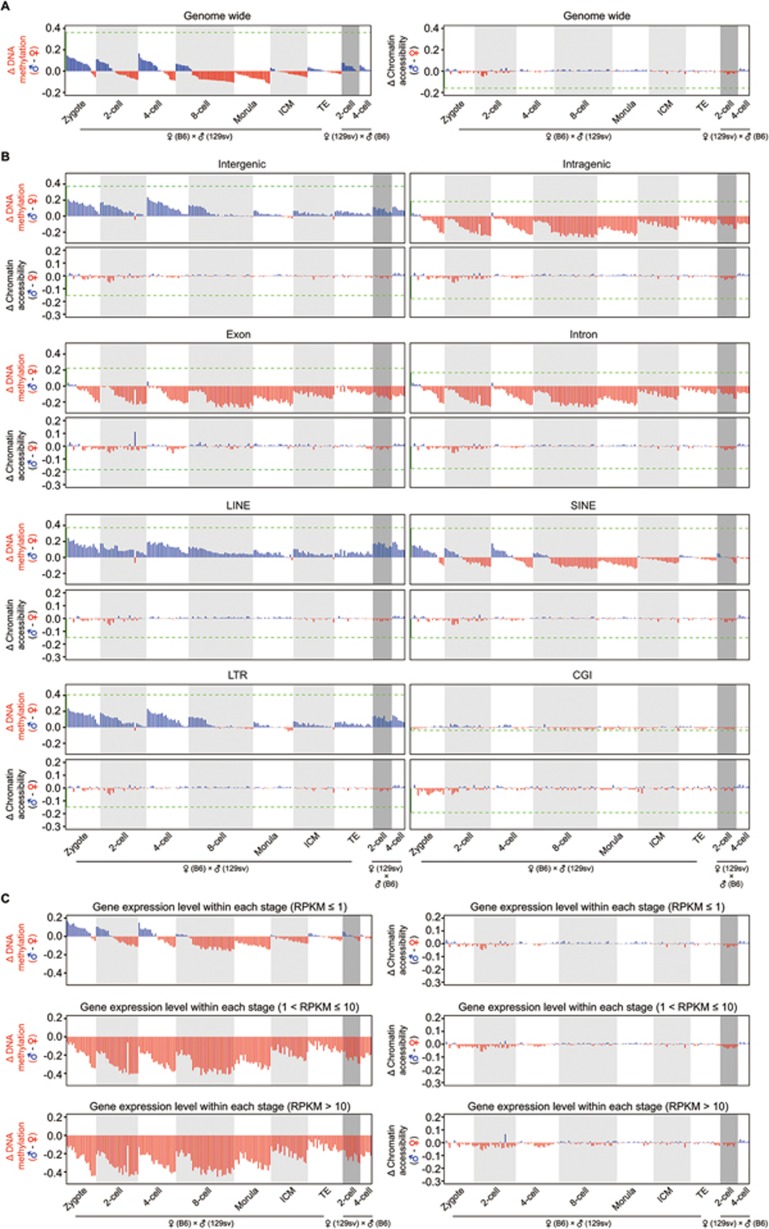
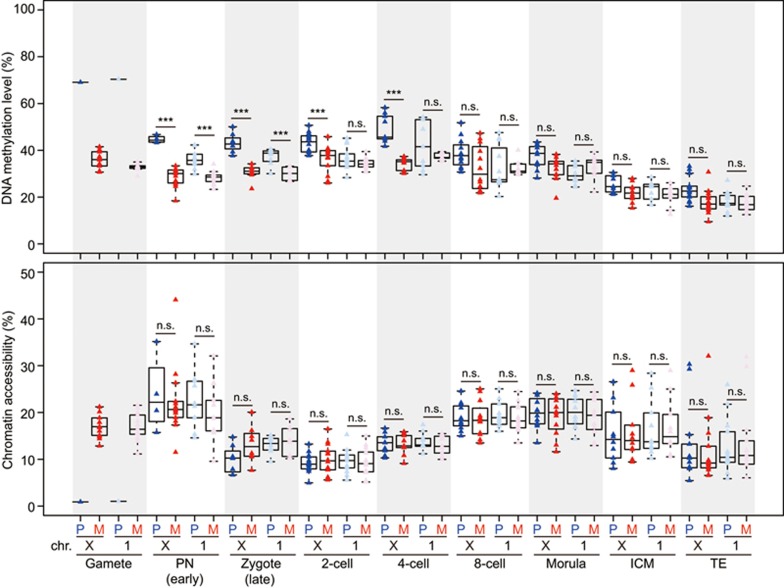
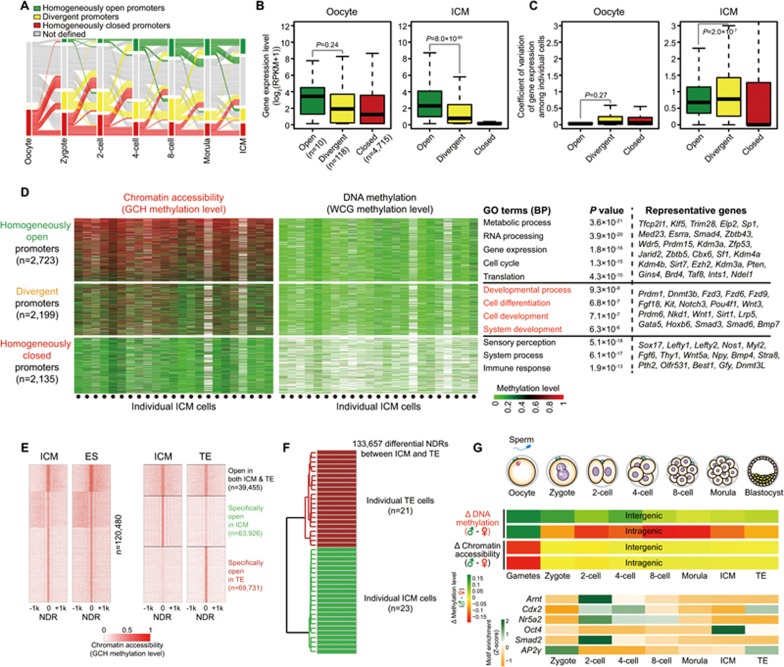
Single-cell epigenome sequencing techniques have recently been developed. However, the combination of different layers of epigenome sequencing in an individual cell has not yet been achieved. Here, we developed a single-cell multi-omics sequencing technology (single-cell COOL-seq) that can analyze the chromatin state/nucleosome positioning, DNA methylation, copy number variation and ploidy simultaneously from the same individual mammalian cell. We used this method to analyze the reprogramming of the chromatin state and DNA methylation in mouse preimplantation embryos. We found that within < 12 h of fertilization, each individual cell undergoes global genome demethylation together with the rapid and global reprogramming of both maternal and paternal genomes to a highly opened chromatin state. This was followed by decreased openness after the late zygote stage. Furthermore, from the late zygote to the 4-cell stage, the residual DNA methylation is preferentially preserved on intergenic regions of the paternal alleles and intragenic regions of maternal alleles in each individual blastomere. However, chromatin accessibility is similar between paternal and maternal alleles in each individual cell from the late zygote to the blastocyst stage. The binding motifs of several pluripotency regulators are enriched at distal nucleosome depleted regions from as early as the 2-cell stage. This indicates that the cis-regulatory elements of such target genes have been primed to an open state from the 2-cell stage onward, long before pluripotency is eventually established in the ICM of the blastocyst. Genes may be classified into homogeneously open, homogeneously closed and divergent states based on the chromatin accessibility of their promoter regions among individual cells. This can be traced to step-wise transitions during preimplantation development. Our study offers the first single-cell and parental allele-specific analysis of the genome-scale chromatin state and DNA methylation dynamics at single-base resolution in early mouse embryos and provides new insights into the heterogeneous yet highly ordered features of epigenomic reprogramming during this process.


Figures

Figure 1
Figure 1
Establishment of single-cell COOL-seq in mouse embryonic stem cells. (A) Diagram of the single-cell COOL-seq method. (B) Chromatin accessibility of individual mouse ES cells around the transcription start site (TSS) revealed by single-cell COOL-seq. Average GCH methylation levels, which reflect the chromatin openness of bulk (marked with green), titration series (from 1 000 cells to 10 cells) or single ES cells (marked with gray), are marked with solid lines. The dashed curve represents the signal intensity of the nucleosome positioning in bulk mouse ES cells from published MNase-seq data. As a control, we also detected in vitro DNA methylation of naked genomic DNA of individual ES cells (marked with black). Note that the solid circles (+1, +2 and +3) represent the first three common strongly positioned nucleosomes downstream of the TSS identified by both scCOOL-seq and bulk cell MNase-seq. (C) Correlation of global chromatin accessibility profiles between scCOOL-seq and bulk NOMe-seq data. A total number of 40 744 of NDRs found in the bulk NOMe-seq data was used, these regions were detected in our merged scCOOL-seq containing at least five GCH sites, which were ≥ 5× sequencing depth. (D) Classification of genes promoters into homogeneously open, homogeneously closed and divergent groups. 9 685 promoter NDRs identified in merged ES cells were used. (E) Gene expression and coefficient of variation of the corresponding genes with homogeneously open promoters, homogeneously closed promoters and divergent promoters among individual ES cells. (F) The number of genes within each category that had either H3K4me3 or H3K27me3 marks in mouse ES cells was calculated. (G) Dot plot of WCG methylation (endogenous DNA methylation) and GCH methylation (chromatin accessibility) level of the same promoter regions within individual cells. (H) Chromatin accessibility and DNA methylation level of homogeneously open promoters, homogeneously closed promoters and divergent promoters of individual ES cells. Right panel represents the GO terms for each group of genes.
Figure 2
Figure 2
DNA methylation dynamics of mouse preimplantation embryos revealed by single-cell COOL-seq analysis. (A) Numbers of individual oocytes and blastomeres analyzed using the single-cell COOL-seq technique. Note that all the samples in the relevant stages used in this study were carefully examined to remove contaminated polar bodies. (B) Boxplot of average DNA methylation level in each single blastomere. The mean methylation level of all the detected WCG sites (≥ 2× depth) in a single cell was calculated (shown as a triangle), and cells at the same developmental stage were plotted together in the same box. The bottom and top of the boxes indicate the first and third quartiles, respectively, and the lines inside the boxes indicate the medians of the data. Note that the sperm DNA data were from bulk samples. (C) The average DNA methylation levels (WCG methylation level) along the gene bodies, 2 kb upstream of the TSS and 2 kb downstream of the transcription end sites (TES) of all the RefSeq genes across different developmental stages. (D) Principle component analysis of the DNA methylome (methylation levels of WCG sites in 5 kb windows) of the gametes, polar bodies, pronuclei and cleavage stage embryos (222 single cells and 9 bulk sperm samples). Right panel represents the coefficient of variance of DNA methylation within each stage. (E) Coefficient of variation (CV) of DNA methylation among single blastomeres. (F) Number of demethylated and de novo methylated WCG sites after fertilization. A WCG site with an over 0.75 methylation level at one developmental stage and with an at least 0.3 methylation level decreases at the following stage was defined as a demethylated WCG site (Benjamini-Hochberg's FDR < 0.05). A WCG site with < 0.25 methylation level at one developmental stage and with an at least 0.3 methylation level increases at the next stage was defined as a de novo methylated WCG site (Benjamini-Hochberg's FDR < 0.05). (G) Representative de novo methylated locus in early mouse embryos. The open white and filled black circles indicate the unmethylated and methylated WCG sites, respectively. The circles on the same line indicate the DNA methylation state in one single cell. Note that the DNA methylation state in the bulk sperm sample was the mean methylation state at each WCG sites.
Figure 3
Figure 3
Chromatin accessibility dynamics of mouse preimplantation embryos revealed by single-cell COOL-seq analysis. (A) Unsupervised hierarchical clustering of mouse preimplantation embryos based on the averaged GCH methylation level of proximal NDRs (58 677 proximal NDRs) detected in all of the preimplantation stages. (B) t-SNE (t-Distributed Stochastic Neighbor Embedding) analysis of mouse preimplantation embryos based on the averaged GCH methylation level of proximal NDRs detected in all the stages. (C) The chromatin accessibility along the gene bodies, 2 kb upstream of the TSS and 2 kb downstream of the TES of all the RefSeq genes across different developmental stages. (D) The chromatin accessibility around TSS across all the preimplantation stages. See the legend for Figure 1B for more information.
Figure 4
Figure 4
Chromatin remodeling dynamics of promoter regions during mouse preimplantation development. (A) Dynamics of chromatin accessibility around TSS of 24 346 RefSeq genes during mouse preimplantation development. Blastomeres within each stage were merged together and averaged GCH methylation level was calculated for this analysis. (B) Bar plot of the proportion of proximal NDRs with over 300 bp width during preimplantation development. (C) Averaged GCH methylation level around NDRs with distinct width in the zygote. (D) Presumptive binding of RNA Pol II around NDRs with distinct width in the zygote. Published RNA Pol II binding information of mouse ES cells by ChIP-seq was used for this analysis. (E) GO analysis of corresponding genes with their proximal NDRs over 300 bp in width. (F) Inhibition of transcriptional activity in mouse zygote and identification of transcription-dependent wider proximal NDRs after fertilization. Scale bar, 25 μm.
Figure 5
Figure 5
Chromatin remodeling dynamics of putative distal regulatory regions during mouse preimplantation development. (A) Motif enrichment analysis of distal NDRs detected in preimplantation embryos. The z-score of P-value of corresponding gene motifs and their RNA expression levels are given. (B) Fluorescence immunostaining of Arnt in mouse preimplantation embryos. Scale bar, 25 μm. (C) Dynamics of chromatin accessibility around TSS of 249 Oct4/Sox2/Nanog target genes that were open in mouse ES cells during preimplantation development. (D) Representative of Oct4 gene and Tdgf1 gene show the chromatin accessibility (GCH methylation level at single-base resolution) at their corresponding cis regulatory elements (promoters and enhancers) during preimplantation development.
Figure 6
Figure 6
Asymmetry of DNA methylation between parental genomes within each individual blastomere during preimplantation development. (A) Differences of global DNA methylation level and chromatin accessibility between paternal and maternal genomes in each individual cell of mouse early embryos. The green dashed line indicates the difference of global DNA methylation level or chromatin accessibility between sperm and oocytes. The numbers of individual blastomeres from C57BL/6J female mated with 129sv male within each stage were: n = 18 for zygote, n = 26 for 2-cell, n = 23 for 4-cell, n = 36 for 8-cell, n = 22 for morula, n = 23 for ICM and n = 21 for TE. The numbers of blastomeres from 129sv female mated with C57BL/6J male within each stage were: n = 11 for 2-cell and n = 7 for 4-cell. (B) Differences of DNA methylation level and chromatin accessibility between paternal and maternal genomes at indicated genomic regions/elements in each individual cell across preimplantation development. (C) Differences of DNA methylation level and chromatin accessibility between paternal and maternal genomes at intragenic regions (gene body) of corresponding genes classified by their RNA expression level. Numbers of genes with their RPKM ≤ 1 analyzed in each stage were 13 547 in zygote, 13 435 in 2-cell, 13 603 in 4-cell, 13 982 in 8-cell, 13 996 in morula, 13 398 in ICM and 13 500 in TE. Numbers of genes with their 1 < RPKM ≤ 10 analyzed in each stage were 5 014 in zygote, 5 607 in 2-cell, 5 104 in 4-cell, 5 010 in 8-cell, 4 865 in morula, 5 099 in ICM and 5 029 in TE. Numbers of genes with their RPKM > 10 analyzed in each stage were 4 487 in zygote, 4 006 in 2-cell, 4 341 in 4-cell, 4 056 in 8-cell, 4 187 in morula, 4 551 in ICM and 4 519 in TE.
Figure 7
Figure 7
DNA methylation and chromatin accessibility dynamics of parental X chromosomes within each individual cell during preimplantation development. Dynamic DNA methylation and chromatin accessibility of paternal and maternal X chromosome within individual blastomeres from female mouse early embryos. The male and female blastomeres were distinguished by analyzing the ratio of the total reads from the X chromosome to those from chromosome 1. The mean DNA methylation levels of the X chromosome and chromosome 1 were calculated in each single cell and are shown as boxplots. A two-tailed t-test was used to calculate the statistical significance. ***P < 0.001. ns, not significant.
Figure 8
Figure 8
Heterogeneity of chromatin states of the promoter regions in mouse early embryos. (A) Alluvial plots of the dynamics of homogeneously open, homogeneously closed and divergent promoters during early embryonic development. Each line represents a gene's promoter and shows the chromatin state of genes in each stage, but lines cannot be traced for they represent different promoters during transition, and the total promoters were those classified as one of the three states in at least one analyzed stage (16 097 promoters analyzed in total). (B) Boxplots of RNA expression levels of genes with homogeneously open, homogeneously closed and divergent promoters in oocytes and ICM cells. (C) Boxplots of coefficient of variance (CV) of RNA expression levels of genes with homogeneously open, homogeneously closed and divergent promoters in oocytes and ICM cells. (D) Chromatin accessibility and DNA methylation level of homogeneously open promoters, homogeneously closed promoters and divergent promoters of individual ICM cells. (E) Comparison of global NDRs among ES cells, ICM and TE cells. NDRs from merged single cells were used for this analysis. (F) Unsupervised clustering of individual ICM and TE cells by differential NDRs identified between merged ICM and merged TE. (G) Sketch of dynamic features of DNA methylation and chromatin accessibility at single-cell and single-base resolution.

References

    1. Gawad C, Koh W, Quake SR. Single-cell genome sequencing: current state of the science. Nat Rev Genet 2016; 17:175–188. - PubMed
    1. Huang L, Ma F, Chapman A, Lu S, Xie XS. Single-cell whole-genome amplification and sequencing: methodology and applications. Annu Rev Genomics Hum Genet 2015; 16:79–102. - PubMed
    1. Junker JP, van Oudenaarden A. Single-cell transcriptomics enters the age of mass production. Mol Cell 2015; 58:563–564. - PubMed
    1. Kolodziejczyk AA, Kim JK, Svensson V, Marioni JC, Teichmann SA. The technology and biology of single-cell RNA sequencing. Mol Cell 2015; 58:610–620. - PubMed
    1. Lu S, Zong C, Fan W, et al. Probing meiotic recombination and aneuploidy of single sperm cells by whole-genome sequencing. Science 2012; 338:1627–1630. - PMC - PubMed