

Acute Effect of Metformin on Postprandial Hypertriglyceridemia through Delayed Gastric Emptying
- PMID: 28621714
- PMCID: PMC5486104
- DOI: 10.3390/ijms18061282
Acute Effect of Metformin on Postprandial Hypertriglyceridemia through Delayed Gastric Emptying
Abstract
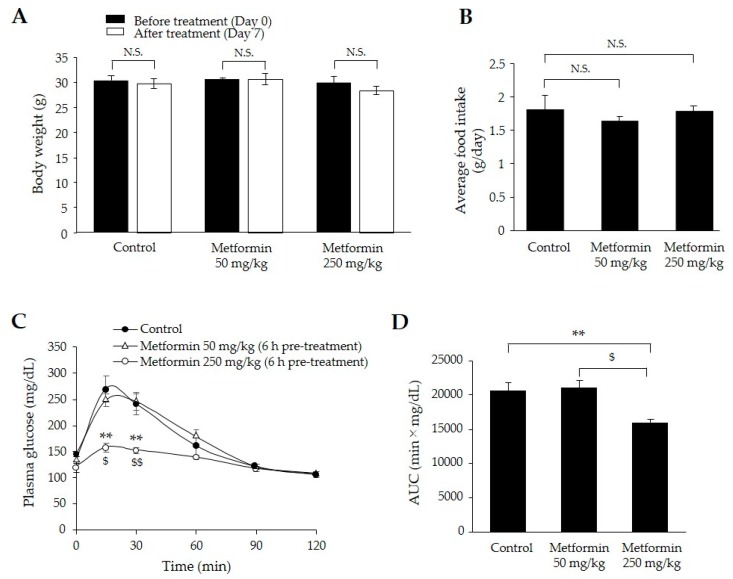
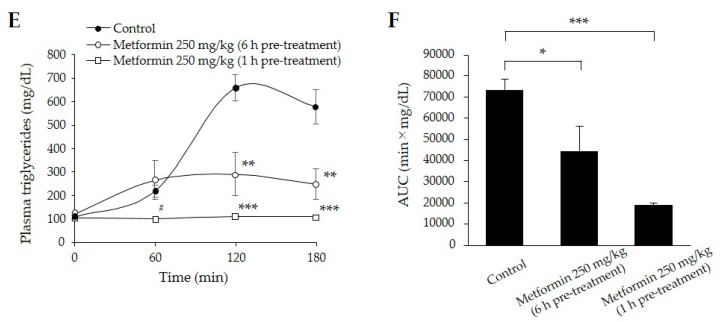
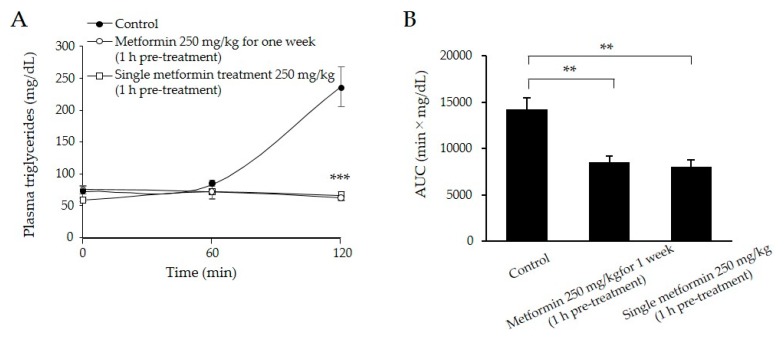
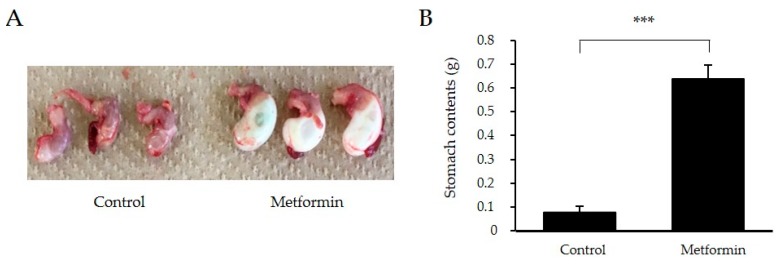
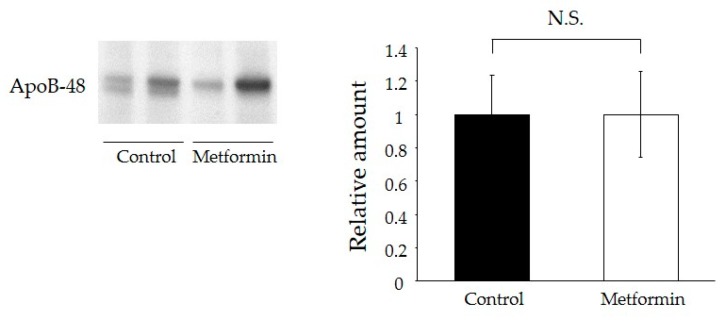
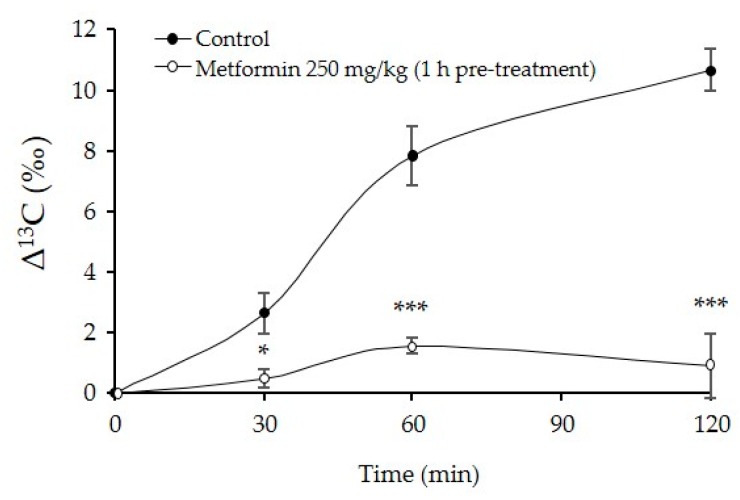
Postprandial hypertriglyceridemia is a potential target for cardiovascular disease prevention in patients with diabetic dyslipidemia. Metformin has been reported to reduce plasma triglyceride concentrations in the postprandial states. However, little is known about the mechanisms underlying the triglyceride-lowering effect of metformin. Here, we examined the effects of metformin on lipid metabolism after olive oil-loading in 129S mice fed a high fat diet for three weeks. Metformin administration (250 mg/kg) for one week decreased postprandial plasma triglycerides. Pre-administration (250 mg/kg) of metformin resulted in a stronger triglyceride-lowering effect (approximately 45% lower area under the curve) than post-administration. A single administration (250 mg/kg) of metformin lowered plasma postprandial triglycerides comparably to administration for one week, suggesting an acute effect of metformin on postprandial hypertriglyceridemia. To explore whole body lipid metabolism after fat-loading, stomach size, fat absorption in the intestine, and fat oxidation (13C/12C ratio in expired CO₂ after administration of glyceryl-1-13C tripalmitate) were measured with and without metformin (250 mg/kg) pre-treatment. In metformin-treated mice, larger stomach size, lower fat oxidation, and no change in lipid absorption were observed. In conclusion, metformin administration before fat loading reduced postprandial hypertriglyceridemia, most likely by delaying gastric emptying.
Keywords: Metformin; gastric emptying; postprandial hypertriglyceridemia.
Conflict of interest statement
This study was funded by the Shiga University of Medical Science. The Department of Medicine, Shiga University of Medical Science, has received research promotion grants (Shogaku Kifukin) from Astellas, Boehringer-Ingelheim, Daiichi-Sankyo, Kowa Pharmaceuticals, Kyowa-hakko-Kirin, Mitsubishi Tanabe, MSD, Nipro, Ono Pharmaceutical, Pfizer, Sanofi, Sanwa Kagaku Kenkyusho, Shionogi, Taisho-Toyama, Takeda and Teijin Pharma. However, the research topics of these donation grants are not restricted.
Figures
Similar articles
-
Efficacy of metformin on postprandial plasma triglyceride concentration by administration timing in patients with type 2 diabetes mellitus: A randomized cross-over pilot study.J Diabetes Investig. 2019 Sep;10(5):1284-1290. doi: 10.1111/jdi.13016. Epub 2019 Feb 22. J Diabetes Investig. 2019. PMID: 30688410 Free PMC article. Clinical Trial.
-
Metformin treatment of rats with diet-induced overweight and hypertriglyceridemia decreases plasma triglyceride concentrations, while decreasing triglyceride and increasing ketone body output by the isolated perfused liver.Acta Diabetol. 2008 Sep;45(3):143-5. doi: 10.1007/s00592-008-0032-0. Epub 2008 Mar 21. Acta Diabetol. 2008. PMID: 18357405
-
Inulin Improves Postprandial Hypertriglyceridemia by Modulating Gene Expression in the Small Intestine.Nutrients. 2018 Apr 25;10(5):532. doi: 10.3390/nu10050532. Nutrients. 2018. PMID: 29693598 Free PMC article.
-
Postprandial dysmetabolism: Too early or too late?Hormones (Athens). 2016 Jul;15(3):321-344. doi: 10.14310/horm.2002.1697. Hormones (Athens). 2016. PMID: 27838603 Review.
-
Role of Fluid Milk in Attenuating Postprandial Hyperglycemia and Hypertriglyceridemia.Nutrients. 2020 Dec 11;12(12):3806. doi: 10.3390/nu12123806. Nutrients. 2020. PMID: 33322540 Free PMC article. Review.
Cited by
-
Metformin acutely lowers blood glucose levels by inhibition of intestinal glucose transport.Sci Rep. 2019 Apr 16;9(1):6156. doi: 10.1038/s41598-019-42531-0. Sci Rep. 2019. PMID: 30992489 Free PMC article.
-
Data-dependent and -independent acquisition lipidomics analysis reveals the tissue-dependent effect of metformin on lipid metabolism.Metabolomics. 2024 May 9;20(3):53. doi: 10.1007/s11306-024-02113-2. Metabolomics. 2024. PMID: 38722395 Free PMC article.
-
Gastrointestinal Mechanisms Underlying the Cardiovascular Effect of Metformin.Pharmaceuticals (Basel). 2020 Nov 22;13(11):410. doi: 10.3390/ph13110410. Pharmaceuticals (Basel). 2020. PMID: 33266396 Free PMC article. Review.
-
Oral metformin transiently lowers post-prandial glucose response by reducing the apical expression of sodium-glucose co-transporter 1 in enterocytes.iScience. 2023 Jan 25;26(4):106057. doi: 10.1016/j.isci.2023.106057. eCollection 2023 Apr 21. iScience. 2023. PMID: 36942050 Free PMC article.
-
Efficacy of metformin on postprandial plasma triglyceride concentration by administration timing in patients with type 2 diabetes mellitus: A randomized cross-over pilot study.J Diabetes Investig. 2019 Sep;10(5):1284-1290. doi: 10.1111/jdi.13016. Epub 2019 Feb 22. J Diabetes Investig. 2019. PMID: 30688410 Free PMC article. Clinical Trial.
References
-
- Maeda E., Yoshino G., Kasuga M. Diabetes mellitus as a risk factor for arteriosclerosis. Nihon Rinsho. 1993;51:2170–2176. - PubMed
-
- Mero N., Malmström R., Steiner G., Taskinen M.R., Syvänne M. Postprandial metabolism of apolipoprotein B-48- and B-100-containing particles in type 2 diabetes mellitus: Relations to angiographically verified severity of coronary artery disease. Atherosclerosis. 2000;150:167–177. doi: 10.1016/S0021-9150(99)00364-0. - DOI - PubMed
MeSH terms
Substances
LinkOut - more resources
Full Text Sources
Other Literature Sources
Medical
