. 2017 Jun 16;12(6):e0179648.
doi: 10.1371/journal.pone.0179648. eCollection 2017.

Aerobic exercise protects against pressure overload-induced cardiac dysfunction and hypertrophy via β3-AR-nNOS-NO activation

Affiliations

Aerobic exercise protects against pressure overload-induced cardiac dysfunction and hypertrophy via β3-AR-nNOS-NO activation

Bin Wang et al. PLoS One. .

Abstract

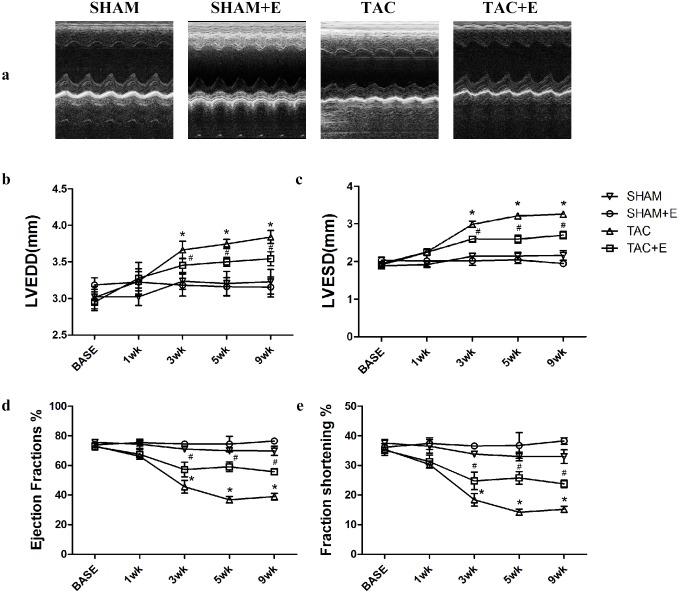
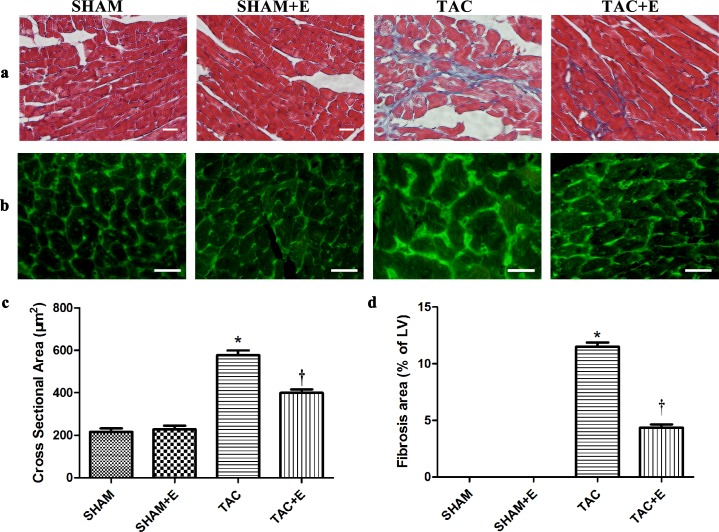
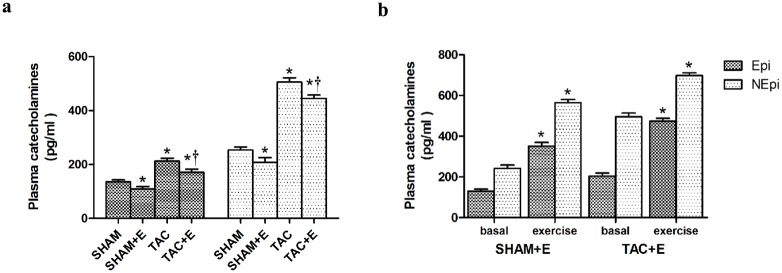
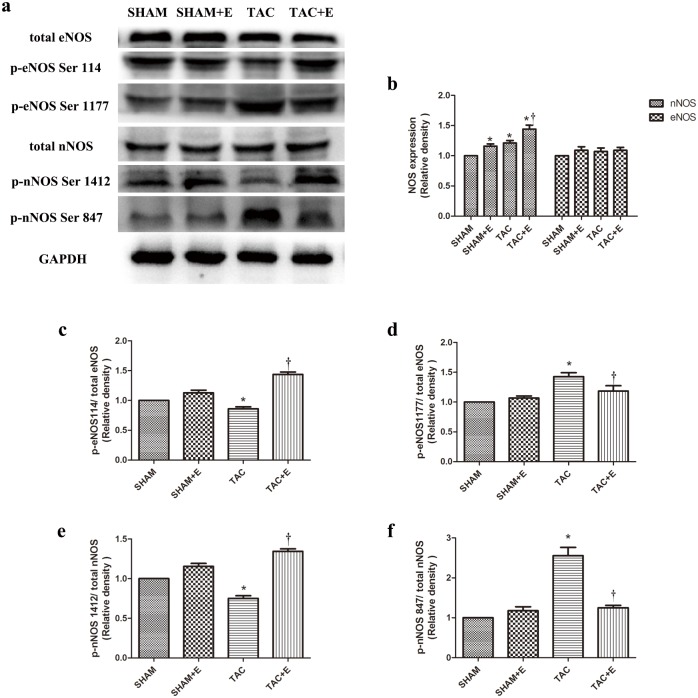
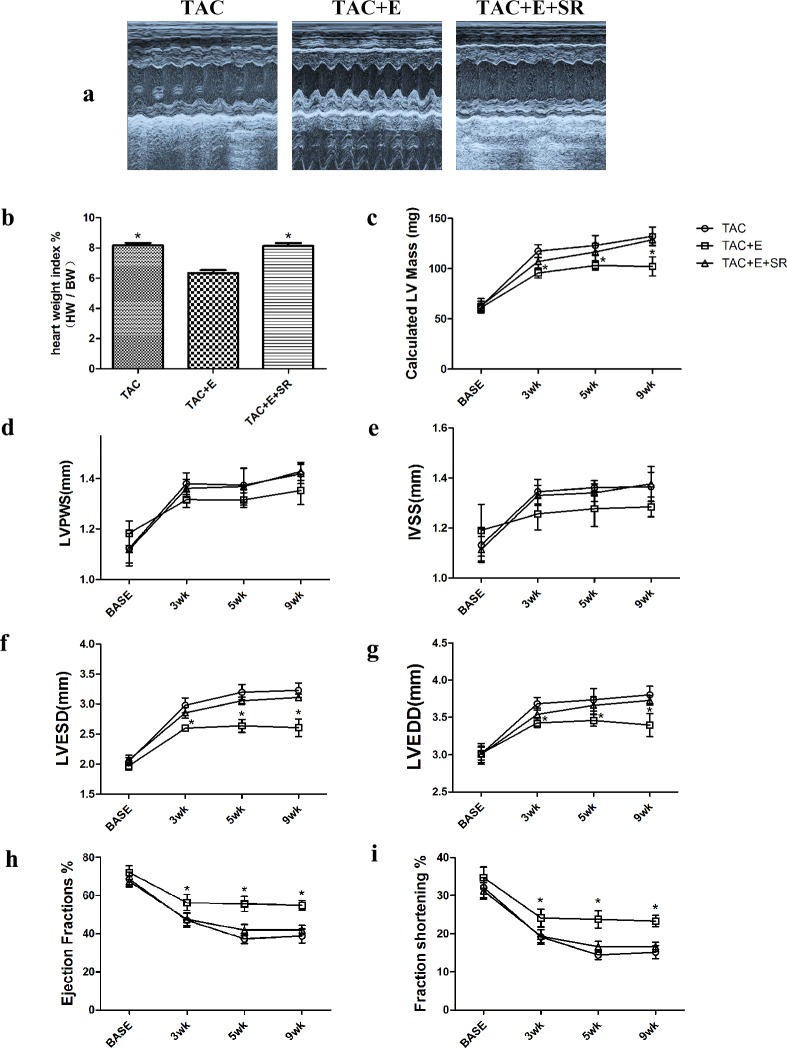
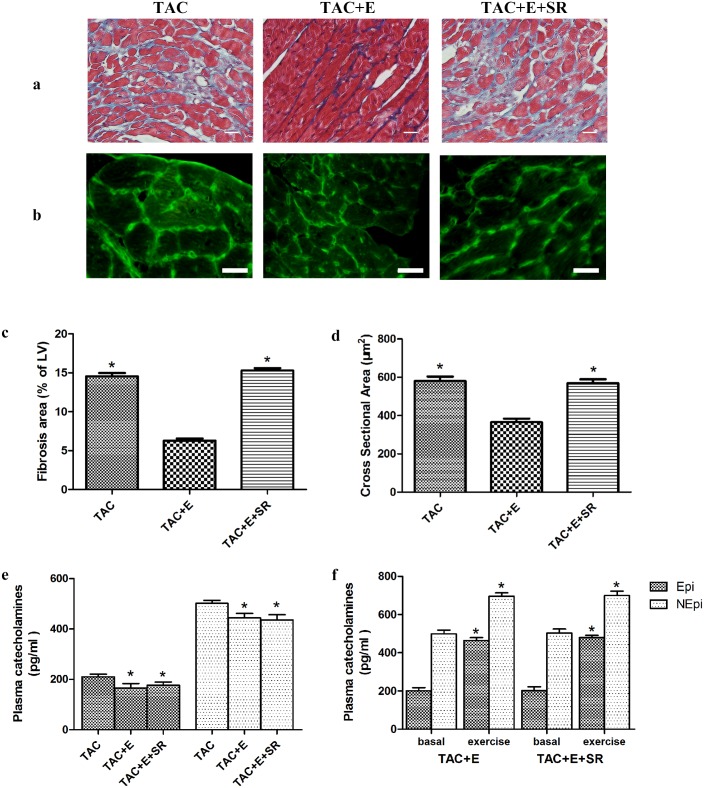
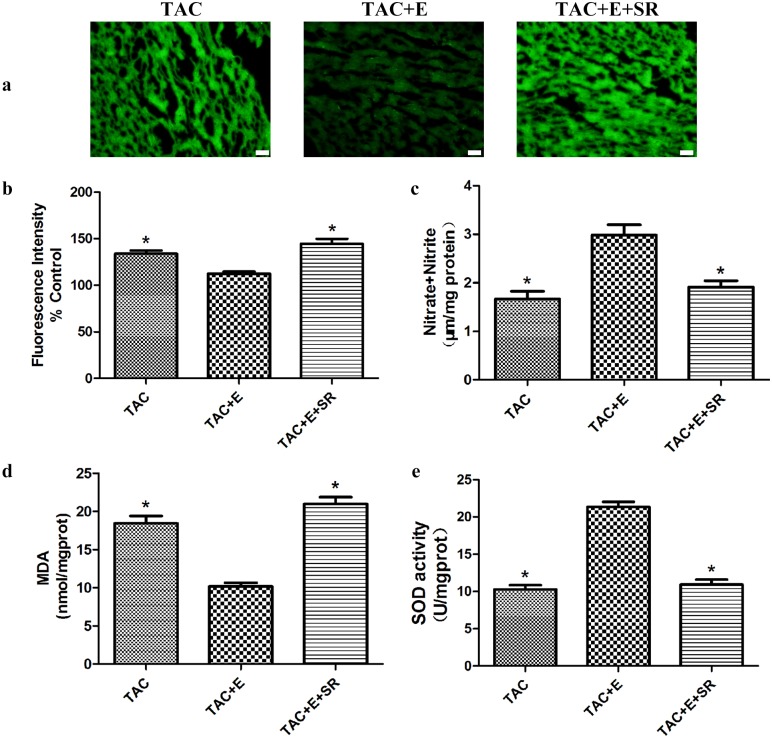
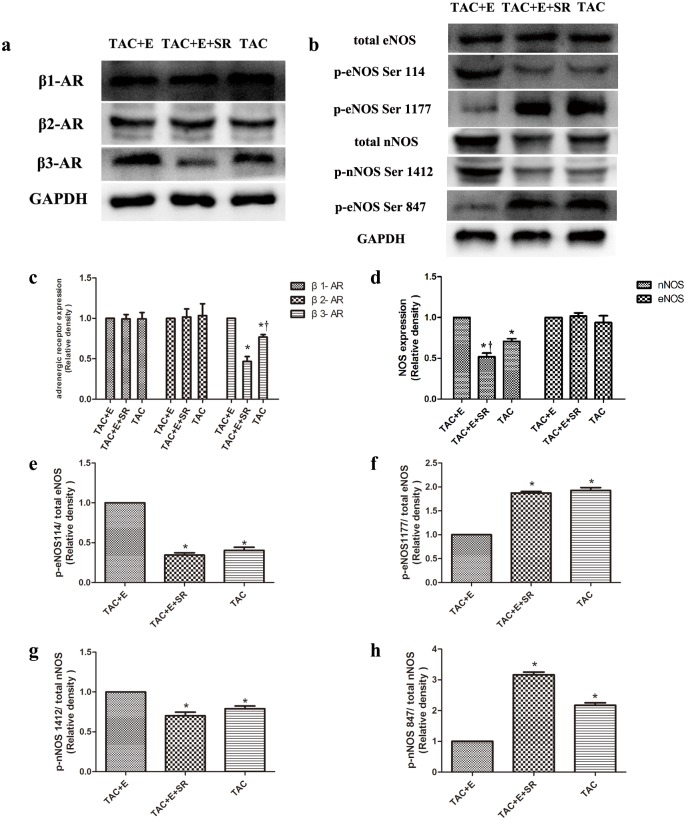
Aerobic exercise confers sustainable protection against cardiac hypertrophy and heart failure (HF). Nitric oxide synthase (NOS) and nitric oxide (NO) are known to play an important role in exercise-mediated cardioprotection, but the mechanism of NOS/NO stimulation during exercise remains unclear. The aim of this study is to determine the role of β3-adrenergic receptors (β3-ARs), NOS activation, and NO metabolites (nitrite and nitrosothiols) in the sustained cardioprotective effects of aerobic exercise. An HF model was constructed by transverse aortic constriction (TAC). Animals were treated with either moderate aerobic exercise by swimming for 9 weeks and/or the β3-AR-specific inhibitor SR59230A at 0.1 mg/kg/hour one day after TAC operation. Myocardial fibrosis, myocyte size, plasma catecholamine (CA) level, cardiac function and geometry were assessed using Masson's trichrome staining, FITC-labeled wheat germ agglutinin staining, enzyme-linked immuno sorbent assay (ELISA) and echocardiography, respectively. Western blot analysis was performed to elucidate the expression of target proteins. The concentration of myocardial NO production was evaluated using the nitrate reductase method. Myocardial oxidative stress was assessed by detecting the concentration of myocardial super oxidative dismutase (SOD), malonyldialdehyde (MDA), and reactive oxygen species (ROS). Aerobic exercise training improved dilated left ventricular function and partially attenuated the degree of cardiac hypertrophy and fibrosis in TAC mice. Moreover, the increased expression of β3-AR, activation of neuronal NOS (nNOS), and production of NO were detected after aerobic exercise training in TAC mice. However, selective inhibition of β3-AR by SR59230A abolished the upregulation and activation of nNOS induced NO production. Furthermore, aerobic exercise training decreased the myocardial ROS and MDA contents and increased myocardial levels of SOD; both effects were partially attenuated by SR59230A. Our study suggested that aerobic exercise training could improve cardiac systolic function and alleviate LV chamber dilation, cardiac fibrosis and hypertrophy in HF mice. The mechanism responsible for the protective effects of aerobic exercise is associated with the activation of the β3-AR-nNOS-NO pathway.


Conflict of interest statement

Competing Interests: The authors have declared that no competing interests exist.

Figures

Fig 1
Fig 1. Effects of aerobic exercise on LV dilation and LV systolic function after TAC.
(a) Representative M-mode echocardiographic images were taken at the level of the papillary muscle, where left ventricular diameters can be measured. Quantification of the left ventricular end diastolic diameter (LVEDd) (b), left ventricular end systolic diameter (LVESd) (c), left ventricular ejection fraction (EF) (d) and fractional shortening (FS) (e) 10 weeks after TAC. (b) (c) (d) (e) (n = 12 per group. *P<0.05 vs. SHAM. #P<0.05 vs. SHAM and TAC).
Fig 2
Fig 2. Effects of aerobic exercise on cardiomyocyte cross sectional area and fibrosis induced by TAC.
(a) Representative Masson’s trichrome staining revealed left ventricular fibrosis 9 weeks after exercise training. Red indicates viable myocardium; blue indicates fibrosis. Scale bar represents 20 μm. (b) Representative WGA staining revealed cardiomyocyte cross sectional area. Green fluorescence delineate cardiomyocyte membranes (c) Quantitative analysis of cardiomyocyte cross sectional area (n = 100 per group. *P<0.05 vs. SHAM and TAC+E. P<0.05 vs. SHAM). (d) Quantitative analysis of the fibrotic area (n = 20 per group.*P<0.05 vs. SHAM and TAC+E. P<0.05 vs. SHAM).
Fig 3
Fig 3. Effect of aerobic exercise on cardiac hypertrophy after TAC.
(a) Representative heart weight to body weight ratio 10 weeks after TAC. (n = 12 per group. *P<0.05 vs. SHAM and TAC+E. †P<0.05 vs. SHAM). Quantification of calculated left ventricular mass (LVM) (b), left ventricular end systolic posterior wall (LVPWS) (c), and interventricular septum end systolic thickness (IVSS) (d) 10 weeks after TAC. (b) (c) (d) (n = 12 per group. *P<0.05 vs. SHAM. #P<0.05 vs. TAC and SHAM).
Fig 4
Fig 4. Effect of aerobic exercise on catecholamine levels after TAC.
The plasma catecholamine levels determined by enzyme-linked immunosorbent assay (ELISA). (a) Quantitative of the plasma catecholamine levels at basal. (n = 5 per group. *P<0.05 vs. SHAM. P <0.05 vs. TAC) (b) Quantification analysis of the plasma catecholamine levels right after exercise. (n = 5 per group. *P<0.05 vs. basal).
Fig 5
Fig 5. Effects of aerobic exercise on the expression of β-AR subtypes after TAC.
(a) Representative immunoblots of β1-AR, β2-AR and β3-AR in the SHAM, SHAM+E, TAC and TAC+E groups. (b) Semiquantitative analysis of β1-AR, β2-AR and β3-AR expression (n = 6 per group. *P<0.05 vs. SHAM and TAC+E. P<0.05 vs. SHAM).
Fig 6
Fig 6. Aerobic exercise increases cardiac NO production and decreases oxidative stress after TAC.
(a) Representative images of heart sections fluorescently stained for ROS from the SHAM, SHAM+E, TAC and TAC+E groups. Green fluorescence indicates ROS production. Scale bar represents 50 μm. (b) Quantitative analysis of the ROS levels (n = 10 per group. *P<0.05 vs. SHAM and TAC+E. P<0.05 vs. SHAM). (c) Quantitative analysis of NO production assessed using the nitrate reductase method 10 weeks after TAC. (d) Quantitative analysis of MDA levels assessed using the TBA method. (e) Quantitative analysis of SOD levels assessed using the hydroxylamine method. (c) (d) (e) (n = 8 per group. *P<0.05 vs. SHAM and TAC+E. P<0.05 vs. SHAM).
Fig 7
Fig 7. Effects of aerobic exercise on the expression and phosphorylation status of eNOS and nNOS after TAC.
(a) Representative immunoblots of p-eNOS (Ser1177/Ser114), total eNOS, p-nNOS (Ser1412/Ser847) and total nNOS in the SHAM, SHAM+E, TAC and TAC+E groups. Semiquantitative analysis of eNOS and nNOS expression (b) (n = 6 per group. *P<0.05 vs. SHAM. P<0.05 vs. TAC). Semiquantitative analysis of p-eNOS Ser114 (c), p-eNOS Ser1177 (d), p-nNOS Ser1412 (e), and p-nNOS Ser847 expression (f) (n = 6 per group. *P<0.05 vs. SHAM and TAC+E. P<0.05 vs. SHAM).
Fig 8
Fig 8. Cardioprotective effects of aerobic exercise was abolished by β3-AR antagonism.
(a) Representative M-mode echocardiographic images were taken at the level of the papillary muscle, where left ventricular diameters can be measured. (b) Representative heart weight to body weight ratio. (n = 12 per group. *P<0.05 vs. TAC+E). (c) Quantification of calculated left ventricular mass (LVM). Quantification of calculated left ventricular end systolic posterior wall (LVPWS) (d), interventricular septum end systolic thickness (IVSS) (e). (c) (d) (e) (n = 12 per group. *P<0.05 vs. TAC and TAC+E+SR). Quantification of the left ventricular end systolic diameter (LVESd) (f), left ventricular end diastolic diameter (LVEDd) (g), left ventricular ejection fraction (EF) (h) and fractional shortening (FS) (i). (f) (g) (h) (i) (n = 12 per group. *P<0.05 vs. TAC and TAC+E+SR).
Fig 9
Fig 9. Effects of β3-AR antagonism on myocyte hypertrophy, fibrosis and catecholamine levels.
(a) Representative Masson’s trichrome staining revealed left ventricular fibrosis 9 weeks after exercise training. Red indicates viable myocardium; blue indicates fibrosis. Scale bar represents 20 μm. (b) Representative WGA staining revealed cardiomyocyte cross sectional area. Green fluorescence delineate cardiomyocyte membranes. Scale bar represents 20 μm. (c) Quantitative analysis of the fibrotic area (n = 20 per group. *P<0.05 vs. TAC+E). (d) Quantitative analysis of cardiomyocyte cross sectional area (n = 100 per group. *P<0.05 TAC+E). (e) Quantitative of the plasma catecholamine levels at basal. (n = 5 per group. *P<0.05 vs. TAC) (f) Quantification analysis of the plasma catecholamine levels right after exercise. (n = 5 per group. *P<0.05 vs. basal).
Fig 10
Fig 10. Effects of SR59230A on cardiac NO production and oxidative stress after aerobic exercise.
(a) Representative images of heart sections fluorescently stained for ROS from the TAC, TAC+E and TAC+E+SR groups. Green fluorescence indicates ROS production. Scale bar represents 50 μm. (b) Quantitative analysis of the ROS levels (n = 10 per group. *P<0.05 vs. TAC+E). (c) Quantitative analysis of NO production assessed using the nitrate reductase method (n = 8 per group. *P<0.05 vs. TAC+E). (d) Quantitative analysis of MDA levels assessed using the TBA method (n = 8 per group. *P<0.05 vs. TAC+E). (e) Quantitative analysis of SOD levels assessed using the hydroxylamine method (n = 8 per group. *P<0.05 vs. TAC+E).
Fig 11
Fig 11. Aerobic exercise induced β3-AR signaling activation was abolished by SR59230A.
(a) Representative immunoblots of β1-AR, β2-AR and β3-AR in the TAC, TAC+E+SR and TAC+E groups. (b) Representative immunoblots of p-eNOS (Ser1177 /Ser114), total eNOS, p-nNOS (Ser1412/Ser847) and total nNOS levels in the TAC, TAC+E+SR and TAC+E groups. (c) Semiquantitative analysis of β1-AR, β2-AR and β3-AR expression (n = 6 per group. *P<0.05 vs. TAC+E. P<0.05 vs. TAC+E+SR). (d)Semiquantitative analysis of eNOS and nNOS expression (n = 6 per group. *P<0.05 vs. TAC+E. P<0.05 vs. TAC). Semiquantitative analysis of p-eNOS Ser114(e), p-eNOS Ser1177 (f), p-nNOS Ser1412 (g) and p-nNOS Ser847 (h) (n = 6 per group. *P<0.05 vs. TAC+E).

References

    1. Orso F, Fabbri G, Maggioni AP. Epidemiology of Heart Failure. Handb Exp Pharmacol. 2016. doi: 10.1007/164_2016_74 - DOI - PubMed
    1. Braunwald E. Heart failure. JACC Heart Fail. 2013;1: 1–20. doi: 10.1016/j.jchf.2012.10.002 - DOI - PubMed
    1. Roof SR, Tang L, Ostler JE, Periasamy M, Gyorke S, Billman GE, et al. Neuronal nitric oxide synthase is indispensable for the cardiac adaptive effects of exercise. Basic Res Cardiol. 2013;108: 332 doi: 10.1007/s00395-013-0332-6 - DOI - PMC - PubMed
    1. Piepoli MF, Davos C, Francis DP, Coats AJ, ExTraMATCH Collaborative. Exercise training meta-analysis of trials in patients with chronic heart failure (ExTraMATCH). BMJ. 2004;328: 189 doi: 10.1136/bmj.37938.645220.EE - DOI - PMC - PubMed
    1. Brown DA, Chicco AJ, Jew KN, Johnson MS, Lynch JM, Watson PA, et al. Cardioprotection afforded by chronic exercise is mediated by the sarcolemmal, and not the mitochondrial, isoform of the KATP channel in the rat. J Physiol. 2005;569: 913–924. doi: 10.1113/jphysiol.2005.095729 - DOI - PMC - PubMed

MeSH terms

Substances