. 2017 Sep;36(9):1979-1991.
doi: 10.1109/TMI.2017.2714901. Epub 2017 Jun 13.

Adaptive Clutter Demodulation for Non-Contrast Ultrasound Perfusion Imaging

Adaptive Clutter Demodulation for Non-Contrast Ultrasound Perfusion Imaging

Jaime Tierney et al. IEEE Trans Med Imaging. 2017 Sep.

Abstract

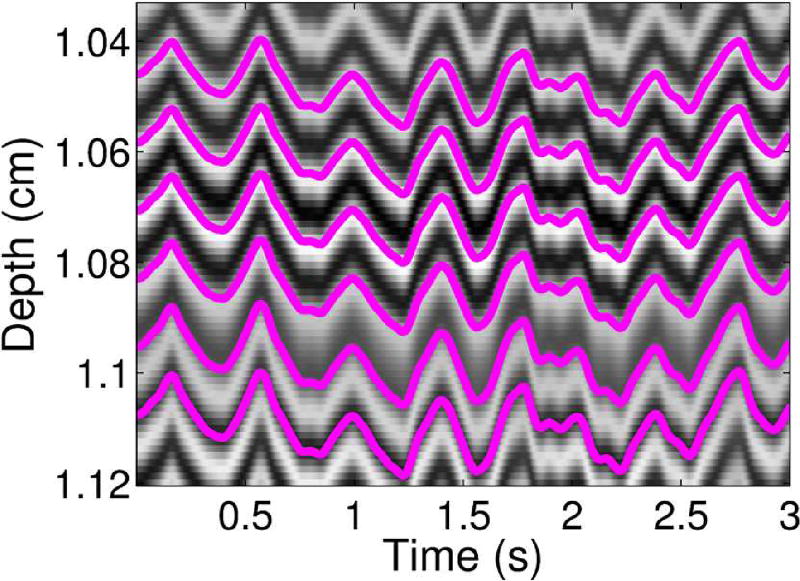
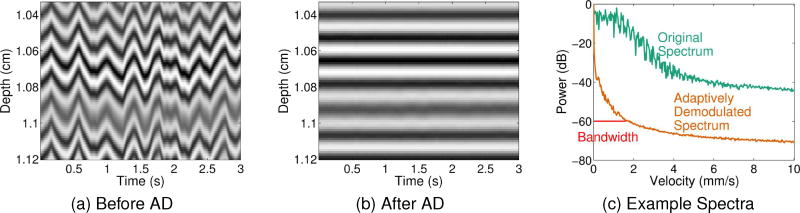
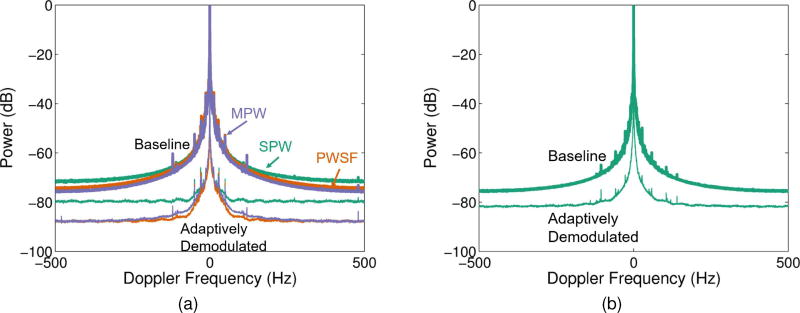
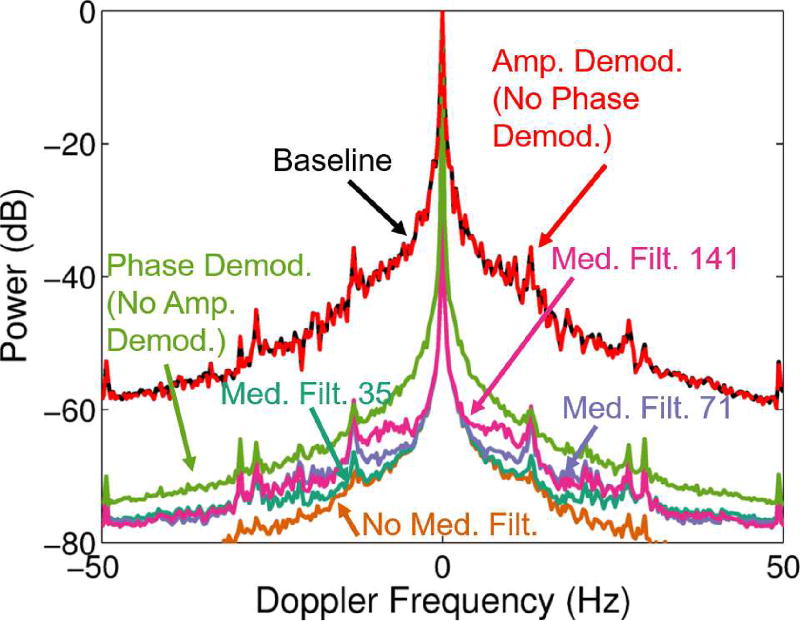
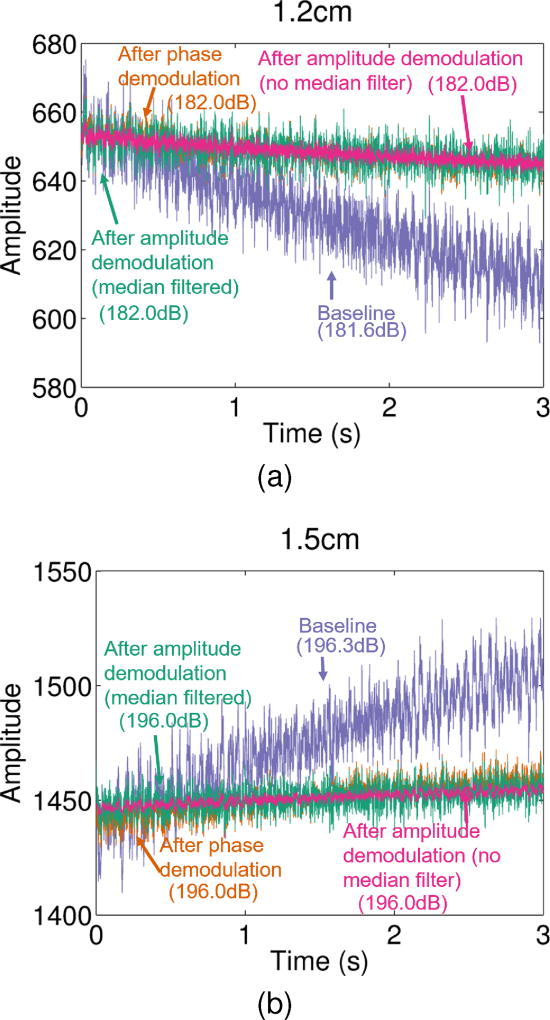
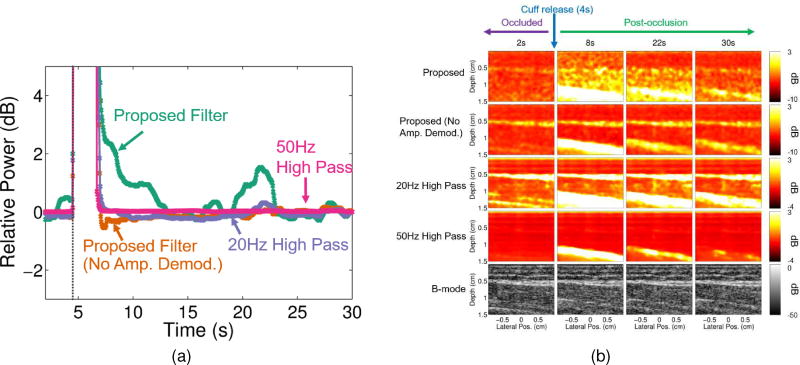
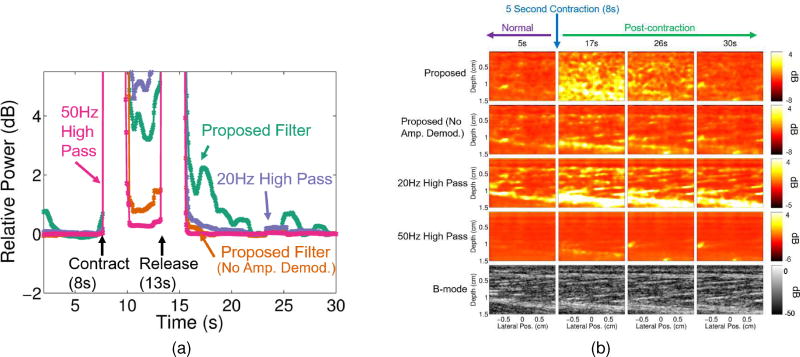
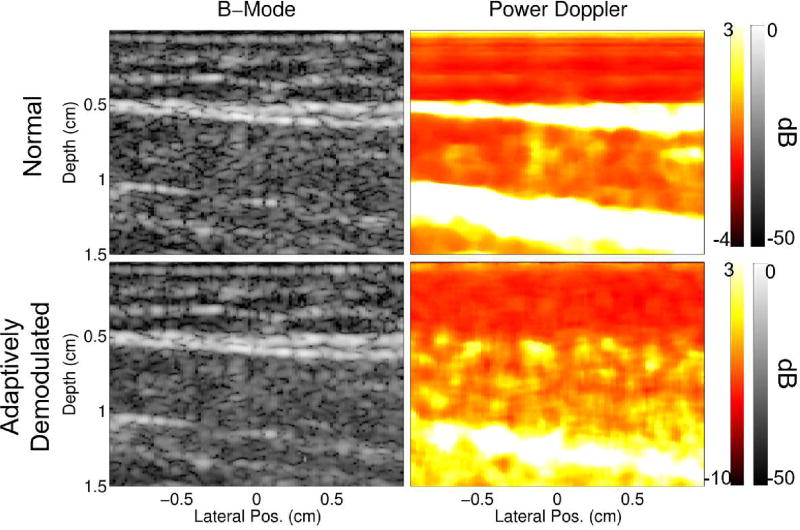
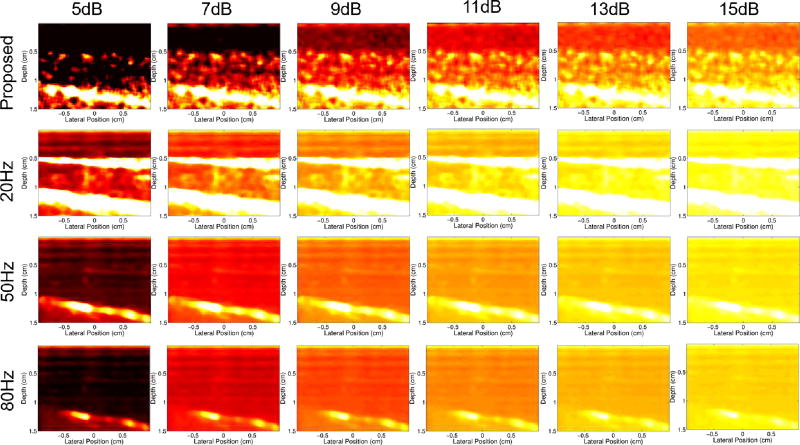
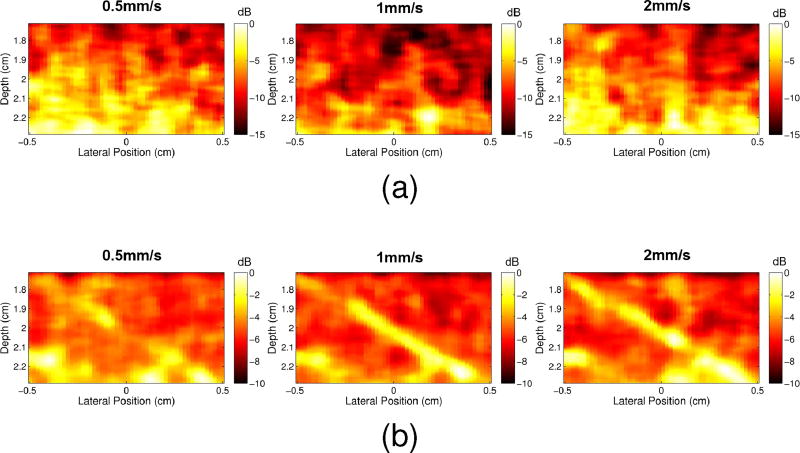
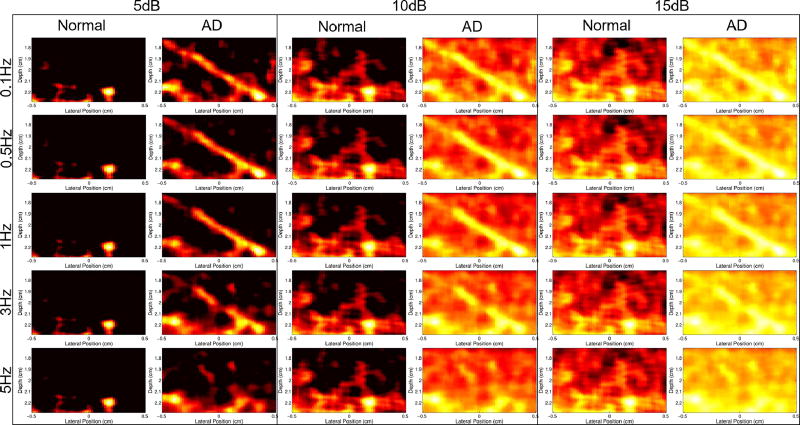
Conventional Doppler ultrasound is useful for visualizing fast blood flow in large resolvable vessels. However, frame rate and tissue clutter caused by movement of the patient or sonographer make visualizing slow flow with ultrasound difficult. Patient and sonographer motion causes spectral broadening of the clutter signal, which limits ultrasound's sensitivity to velocities greater than 5-10 mm/s for typical clinical imaging frequencies. To address this, we propose a clutter filtering technique that may increase the sensitivity of Doppler measurements to at least as low as 0.52 mm/s. The proposed technique uses plane wave imaging and an adaptive frequency and amplitude demodulation scheme to decrease the bandwidth of tissue clutter. To test the performance of the adaptive demodulation method at suppressing tissue clutter bandwidths due to sonographer hand motion alone, six volunteer subjects acquired data from a stationary phantom. Additionally, to test in vivo feasibility, arterial occlusion and muscle contraction studies were performed to assess the efficiency of the proposed filter at preserving signals from blood velocities 2 mm/s or greater at a 7.8 MHz center frequency. The hand motion study resulted in initial average bandwidths of 175 Hz (8.60mm/s), which were decreased to 10.5 Hz (0.52 mm/s) at -60 dB using our approach. The in vivo power Doppler studies resulted in 4.73 dB and 4.80 dB dynamic ranges of the blood flow with the proposed filter and 0.15 dB and 0.16 dB dynamic ranges of the blood flow with a conventional 50 Hz high-pass filter for the occlusion and contraction studies, respectively.


Figures

Fig. 1
Fig. 1
Displacement profiles in pink superimposed on top of corresponding RF lines through slow-time are shown for several depths.
Fig. 2
Fig. 2
(a) Example M-mode data before adaptive demodulation. (b) Example M-mode data after adaptive demodulation. (c) The average spectrum through slow-time before adaptive demodulation is shown in teal. The average spectrum through slow-time after adaptive demodulation is shown in orange. Example half-width bandwidth estimate at −60dB is shown in red.
Fig. 3
Fig. 3
Average spectra through depth and across subjects are shown for (a) three beamforming methods, SPW (teal), PWSF (orange), and MPW (purple), before (thick) and after (thin) adaptive demodulation for the data acquired with the L12-5 probe (7.8MHz imaging frequency, imaging cases 1–3) and (b) the SPW beamforming method before (thick) and after (thin) adaptive demodulation for the data acquired with the C5-2 probe (3.1MHz imaging frequency, imaging case 4). A 35 sample median filter was used for the adaptive demodulation for both cases.
Fig. 4
Fig. 4
Average spectra through depth across subjects are shown for the data acquired with the L12-5 probe and SPW acquisition method (7.8MHz imaging frequency, imaging case 2) for different steps of the adaptive demodulation scheme. The frequency axis is cropped to highlight differences at −60dB. Spectra are shown for baseline (black), after amplitude demodulation (red), after phase demodulation (green), and after phase & amplitude demodulation with median filter sizes of 141 (pink), 71 (purple), 35 (teal), and no median filter (orange).
Fig. 5
Fig. 5
Amplitude through slow-time is shown for two example depths. For each depth, amplitude is shown for the raw RF data (purple), phase demodulated RF data (orange), and phase & amplitude demodulated RF data with (teal) and without (pink) median filtering. Individual power estimates in dB for each line are shown next to corresponding labels.
Fig. 6
Fig. 6
(a) Median relative power with respect to the last in vivo arterial occlusion time point (for each filtering method) is plotted for every 50ms for each filtering case: proposed filter (teal), proposed filter with no amplitude demodulation (orange), 20Hz high pass (purple), and 50Hz high pass (pink). The time point at which the cuff was released is marked by the dark gray vertical dotted line (at about 4s). (b) Power Doppler and corresponding B-mode images (bottom row) are shown for 2, 8, 22, and 30 second time points of the in vivo arterial occlusion scan for each filtering case: proposed filter (first row), proposed filter with no amplitude demodulation (second row), 20Hz high pass (third row), and 50Hz high pass (fourth row).
Fig. 7
Fig. 7
(a) Median relative power with respect to the last in vivo muscle contraction time point (for each filtering method) is plotted for every 50ms for each filtering case: proposed filter (teal), proposed filter with no amplitude demodulation (orange), 20Hz high pass (purple), and 50Hz high pass (pink). The time points at which the muscle contracted and released are marked with arrows (at about 8s and 13s, respectively). (b) Power Doppler and corresponding B-mode images (bottom row) are shown for 5, 17, 26, and 30 second time points of the in vivo muscle contraction scan for each filtering case: proposed filter (first row), proposed filter with no amplitude demodulation (second row), 20Hz high pass (third row), and 50Hz high pass (fourth row).
Fig. 8
Fig. 8
Power Doppler images are shown for the 22 and 17 second time points of the (a) in vivo arterial occlusion and (b) muscle contraction scans, respectively, for data processed with no median filter (first column), with median filters of size 35 (second column), 71 (third column), 141 (fourth column), and with no amplitude demodulation (fifth column). The corresponding B-mode images are shown in the last column.
Fig. 9
Fig. 9
B-mode and power Doppler images before and after adaptive demodulation (using a median filter of 35 samples for the amplitude demodulation) are shown for the 22s time point of the textitin vivo occlusion scan.
Fig. 10
Fig. 10
Power Doppler images made from the 22s time point of the occlusion scan for the proposed filter (first row) and conventional filter with 20Hz (second row), 50Hz (third row), and 80Hz (bottom row) filter cutoffs. Dynamic ranges between 5 and 15dB are compared. The maximum in all images is 3dB.
Fig. 11
Fig. 11
Power Doppler images are shown for 0.5mm/s, 1mm/s, and 2mm/s parabolic blood scatterer velocities for (a) normal data and (b) adaptively demodulated data.
Fig. 12
Fig. 12
Power Doppler images of the 1mm/s peak velocity simulation with and without adaptive demodulation (AD) (left and right in each column, respectively) are shown for dynamic ranges between 5 and 15dB (columns) with filter cutoffs between 0.1Hz and 5Hz (rows).

References

    1. Tremblay-Darveau C, Williams R, Milot L, Bruce M, Burns PN. Combined perfusion and doppler imaging using plane-wave nonlinear detection and microbubble contrast agents. IEEE Transactions on Ultrasonics, Ferroelectrics and Frequency Control. 2014;61:1988–2000. - PubMed
    1. Jensen JA. Estimation of Blood Velocities Using Ultrasound: A Signal Processing Approach. Cambridge: Cambridge UP; 1996.
    1. Bjaerum S, Torp H, Kristoffersen K. Clutter filters adapted to tissue motion in ultrasound color flow imaging. IEEE Transactions on Ultrasonics, Ferroelectrics, and Frequency Control. 2002;49:693–704. - PubMed
    1. Heimdal A, Torp H. Ultrasound doppler measurements of low velocity blood flow: limitations due to clutter signals from vibrating muscles. IEEE Transactions on Ultrasonics, Ferroelectrics and Frequency Control. 1997;44:873–881.
    1. Bjaerum S, Torp H, Kristoffersen K. Clutter filter design for ultrasound color flow imaging. IEEE Transactions on Ultrasonics, Ferroelectrics, and Frequency Control. 2002;49:204–216. - PubMed