. 2017 Dec;36(12):2524-2535.
doi: 10.1109/TMI.2017.2715284. Epub 2017 Jun 13.

Low-Dose CT With a Residual Encoder-Decoder Convolutional Neural Network

Low-Dose CT With a Residual Encoder-Decoder Convolutional Neural Network

Hu Chen et al. IEEE Trans Med Imaging. 2017 Dec.

Abstract

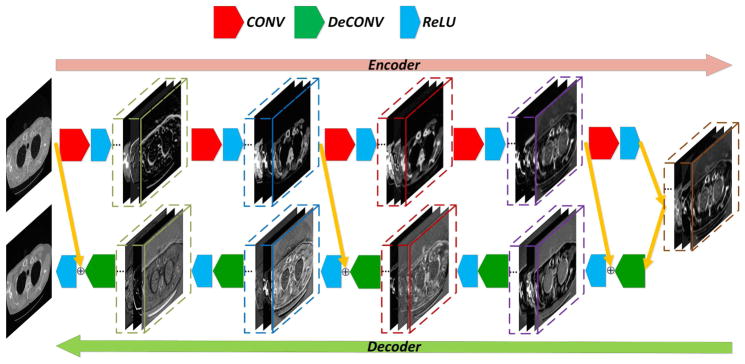
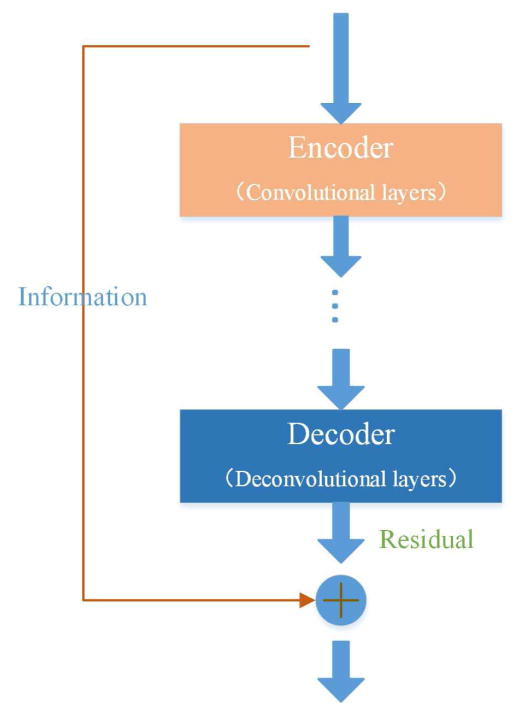
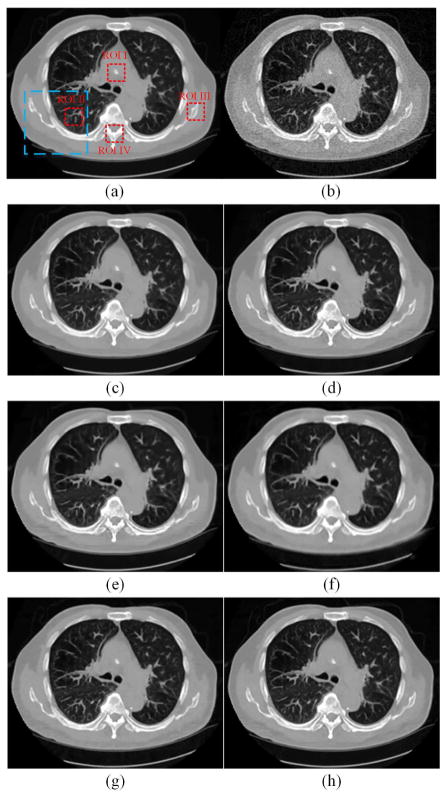
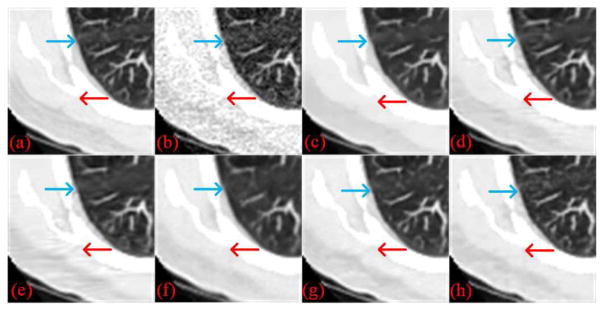
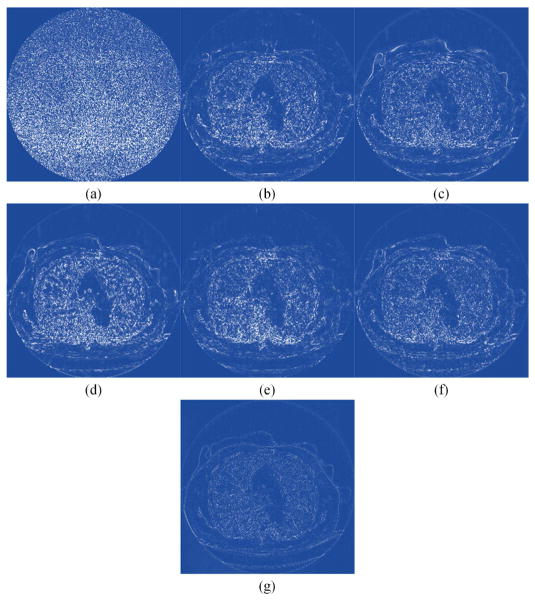
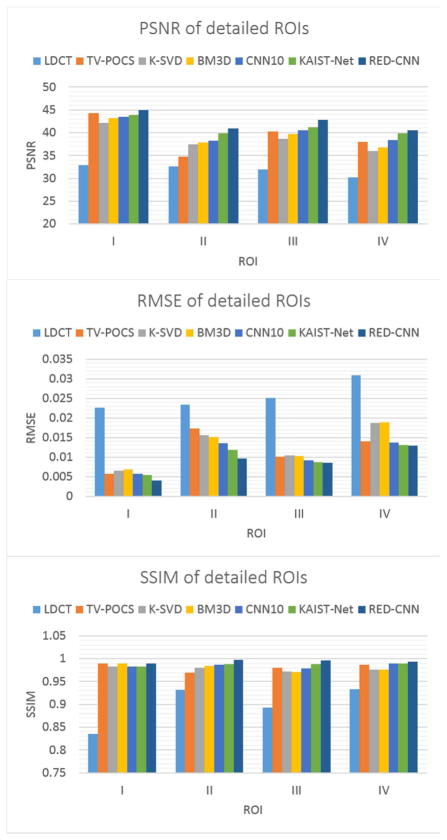
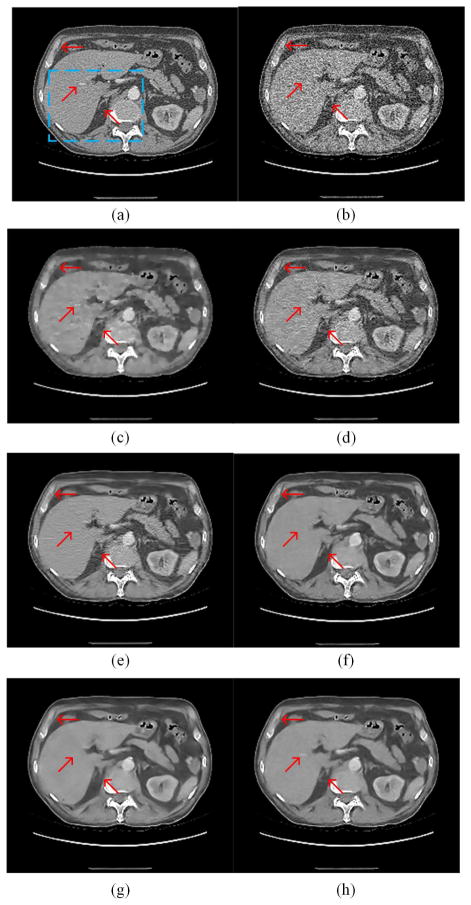
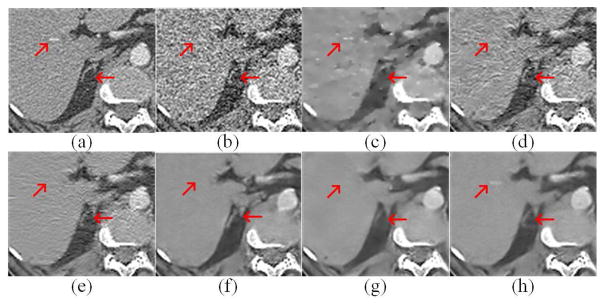
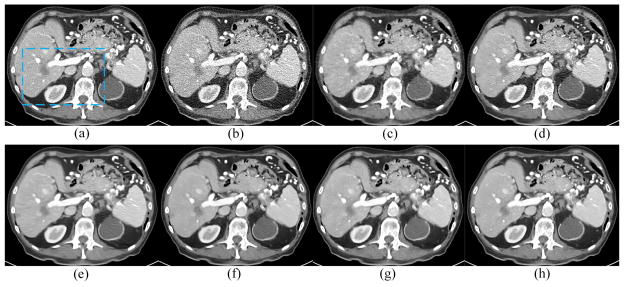
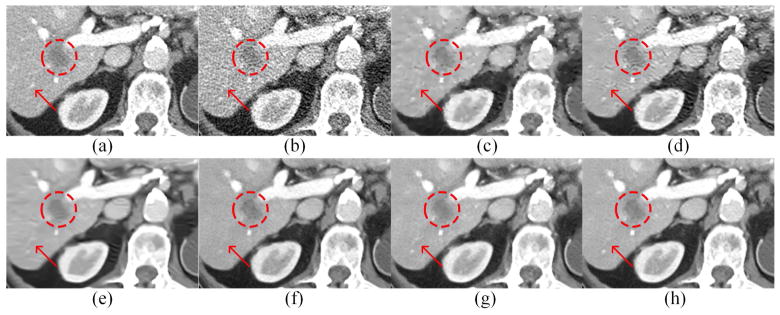
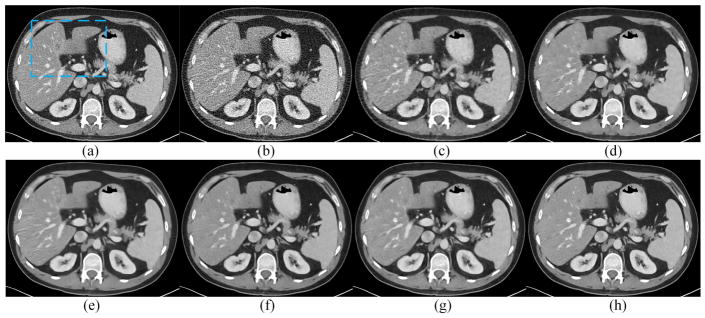
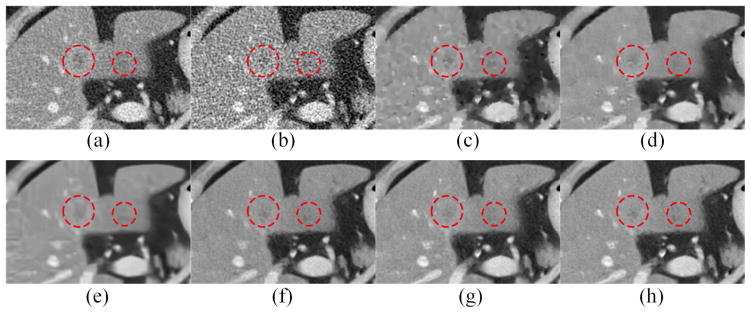
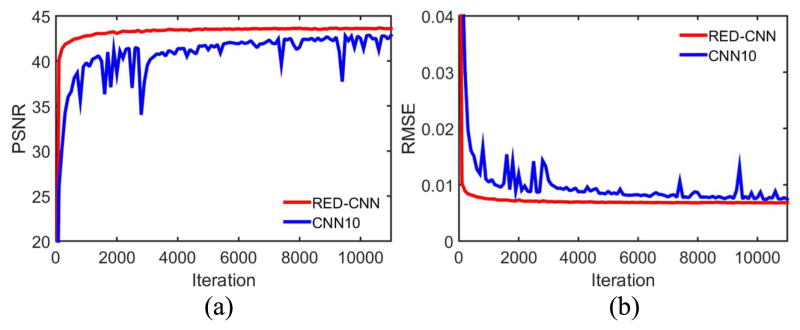
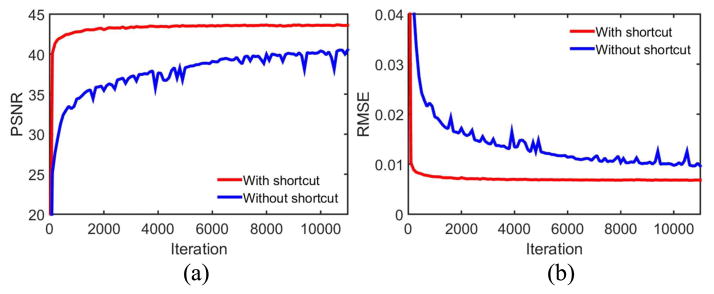
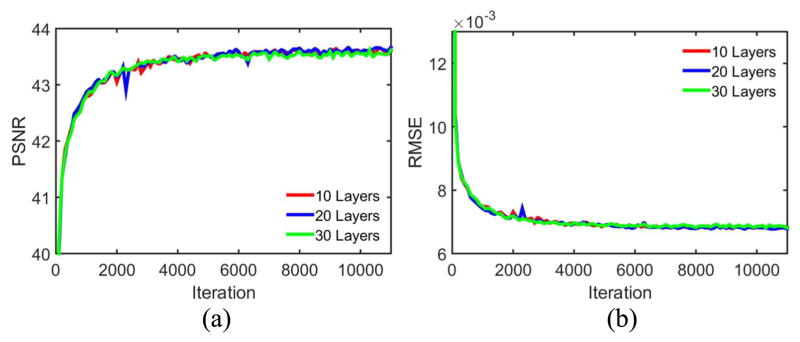
Given the potential risk of X-ray radiation to the patient, low-dose CT has attracted a considerable interest in the medical imaging field. Currently, the main stream low-dose CT methods include vendor-specific sinogram domain filtration and iterative reconstruction algorithms, but they need to access raw data, whose formats are not transparent to most users. Due to the difficulty of modeling the statistical characteristics in the image domain, the existing methods for directly processing reconstructed images cannot eliminate image noise very well while keeping structural details. Inspired by the idea of deep learning, here we combine the autoencoder, deconvolution network, and shortcut connections into the residual encoder-decoder convolutional neural network (RED-CNN) for low-dose CT imaging. After patch-based training, the proposed RED-CNN achieves a competitive performance relative to the-state-of-art methods in both simulated and clinical cases. Especially, our method has been favorably evaluated in terms of noise suppression, structural preservation, and lesion detection.


Figures

Fig. 1
Fig. 1
Overall architecture of our proposed RED-CNN network.
Fig. 2
Fig. 2
Shortcut in the residual compensation structure.
Fig. 3
Fig. 3
Examples from the normal-dose CT image dataset.
Fig. 4
Fig. 4
Results from the chest image for comparison. (a) NDCT, (b) LDCT, (c) TV-POCS, (d) K-SVD, (e) BM3D, (f) CNN10, (g) KAIST-Net, and (h) RED-CNN. The blue box indicates the region zoomed in Fig. 5. The red dotted boxes define several ROIs.
Fig. 5
Fig. 5
Zoomed parts over the region of interest (ROI) marked by the blue box in Fig. 4(a). (a) NDCT, (b) LDCT, (c) TV-POCS, (d) K-SVD, (e) BM3D, (f) CNN10, (g) KAIST-Net, and (h) RED-CNN ((a)–(h) from Fig. 4(a)–(h)). The arrows indicate two regions for visual differences.
Fig. 6
Fig. 6
Absolute difference images relative to the NDCT image. (a) LDCT, (b) TV-POCS, (c) K-SVD, (d) BM3D, (e) CNN10, (f) KAIST-Net, and (g) RED-CNN.
Fig. 7
Fig. 7
Performance comparison of the six algorithms over the ROIs marked in Fig. 4(a) in terms of the selected metrics.
Fig. 8
Fig. 8
Results from the abdominal image for comparison. (a) NDCT, (b) LDCT, (c) TV-POCS, (d) K-SVD, (e) BM3D, (f) CNN10, (g) KAIST-Net, and (h) RED-CNN. The arrows indicate three regions to observe the visual effects.
Fig. 9
Fig. 9
Zoomed ROI images from Fig. 8. (a) NDCT, (b) LDCT, (c) TV-POCS, (d) K-SVD, (e) BM3D, (f) CNN10, (g) KAIST-Net, and (h) RED-CNN ((a)–(h) from Fig. 8(a)–(h)). The arrows indicate two regions containing features revealed differently by the competing algorithms.
Fig. 10
Fig. 10
Results from the abdominal image with a metastasis in the liver for comparison. (a) NDCT, (b) LDCT, (c) TV-POCS; (d) K-SVD, (e) BM3D, (f) CNN10, (g) KAIST-Net, and (h) RED-CNN.
Fig. 11
Fig. 11
Zoomed parts from Fig. 10. (a) NDCT, (b) LDCT, (c) TV-POCS, (d) K-SVD, (e) BM3D, (f) CNN10, (g) KAIST-Net, and (h) RED-CNN. The circle indicates the lesion while the arrow points to the contrast enhanced blood vessel.
Fig. 12
Fig. 12
Results from the abdominal image with two focal fatty sparings in the liver for comparison. (a) NDCT, (b) LDCT, (c) TV-POCS, (d) K-SVD, (e) BM3D, (f) CNN10, (g) KAIST-Net, and (h) RED-CNN.
Fig. 13
Fig. 13
Zoomed parts from Fig. 12. (a) NDCT, (b) LDCT, (c) TV-POCS, (d) K-SVD, (e) BM3D, (f) CNN10, (g) KAIST-Net, and (h) RED-CNN.
Fig. 14
Fig. 14
PSNR and RMSE values on the testing dataset during training. Our network exhibits a better performance than CNN10. The display ranges of PSNR and RMSE are [20 45] and [0 0.04] respectively.
Fig. 15
Fig. 15
PSNR and RMSE values on the testing dataset during training. Our network with shortcut connections exhibits a better performance than the one without shortcuts. The display ranges of PSNR and RMSE are [20 45] and [0 0.04] respectively.
Fig. 16
Fig. 16
PSNR and RMSE values on the testing dataset during training based on different numbers of layers. The display ranges of PSNR and RMSE are [40 44] and [0.006 0.013] respectively.
Fig. 17
Fig. 17
PSNR and RMSE values on the testing dataset during training based on different patch sizes. The display ranges of PSNR and RMSE are [40 44] and [0.006 0.013] respectively.

References

    1. Brenner DJ, Hall EJ. Computed tomography-An increasing source of radiation exposure. New Eng J Med. 2007;357(22):2277–2284. - PubMed
    1. Balda M, Hornegger J, Heismann B. Ray contribution masks for structure adaptive sinogram filtering. IEEE Trans Med Imaging. 2011;30(5):1116–1128. - PubMed
    1. Manduca A, Yu L, Trzasko JD, Khaylova N, Kofler JM, McCollough CM, Fletcher JG. Projection space denoising with bilateral filtering and CT noise modeling for dose reduction in CT. Med Phys. 2009;36(11):4911–4919. - PMC - PubMed
    1. Wang J, Li T, Lu H, Liang Z. Penalized weighted least-squares approach to sinogram noise reduction and image reconstruction for low dose X-ray computed tomography. IEEE Trans Med Imaging. 2006;25(10):1272–1283. - PMC - PubMed
    1. Donoho DL. Compressed sensing. IEEE Trans Inf Theory. 2006;52(4):1289–1306.

MeSH terms