. 2017 Jun 20;46(6):983-991.e4.
doi: 10.1016/j.immuni.2017.05.005. Epub 2017 Jun 13.

The Transcription Factor T-bet Limits Amplification of Type I IFN Transcriptome and Circuitry in T Helper 1 Cells

Affiliations

The Transcription Factor T-bet Limits Amplification of Type I IFN Transcriptome and Circuitry in T Helper 1 Cells

Shigeru Iwata et al. Immunity. .

Abstract

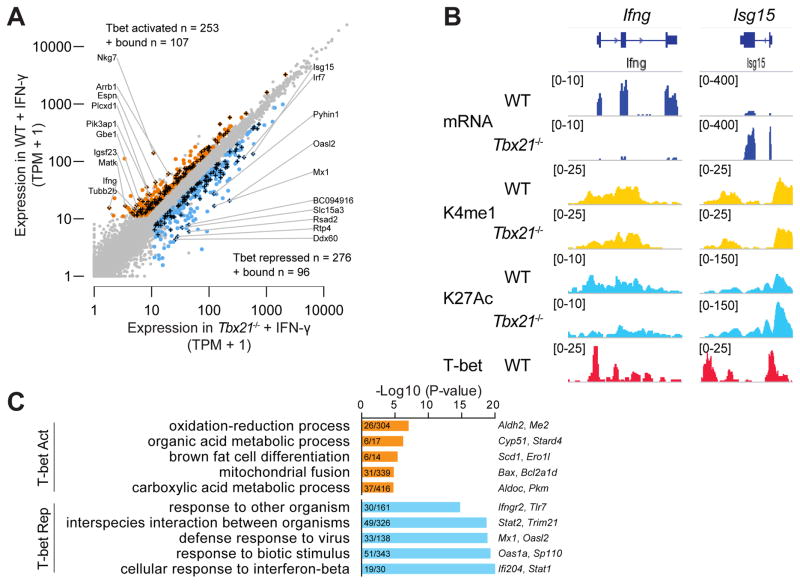
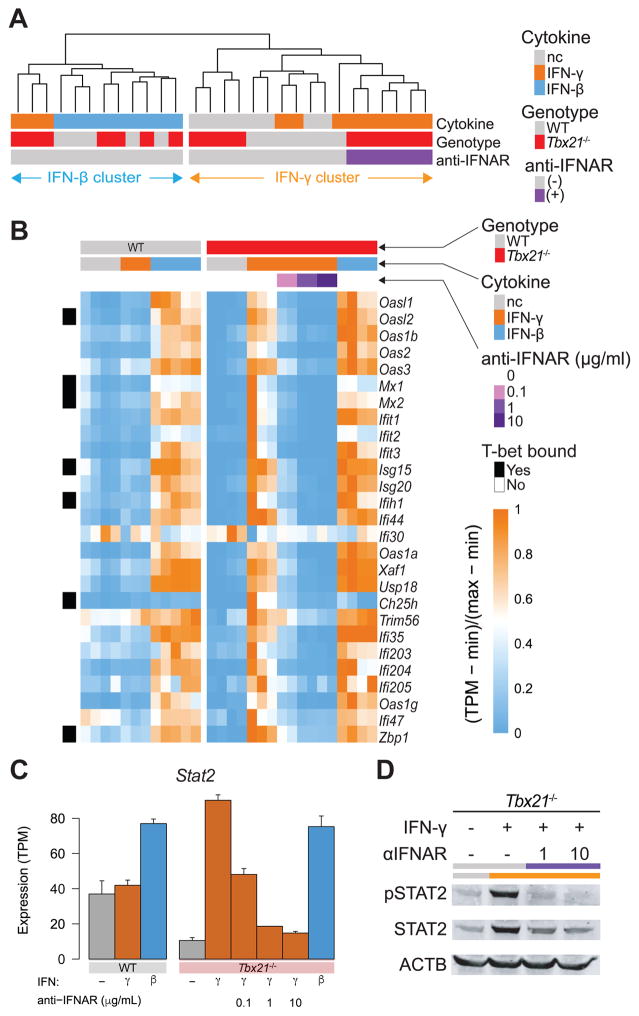
Host defense requires the specification of CD4+ helper T (Th) cells into distinct fates, including Th1 cells that preferentially produce interferon-γ (IFN-γ). IFN-γ, a member of a large family of anti-pathogenic and anti-tumor IFNs, induces T-bet, a lineage-defining transcription factor for Th1 cells, which in turn supports IFN-γ production in a feed-forward manner. Herein, we show that a cell-intrinsic role of T-bet influences how T cells perceive their secreted product in the environment. In the absence of T-bet, IFN-γ aberrantly induced a type I IFN transcriptomic program. T-bet preferentially repressed genes and pathways ordinarily activated by type I IFNs to ensure that its transcriptional response did not evoke an aberrant amplification of type I IFN signaling circuitry, otherwise triggered by its own product. Thus, in addition to promoting Th1 effector commitment, T-bet acts as a repressor in differentiated Th1 cells to prevent abberant autocrine type I IFN and downstream signaling.

Keywords: ChIP-seq; JAK-STAT pathway; RNA-seq; STAT; T helper cells; T-bet; immunoregulation; interferon gamma; signal transducer and activator of transcription; transcription; type I interferons.


Conflict of interest statement

Competing financial interests. The authors declare no competing financial interests.

Figures

Figure 1
Figure 1. T-bet represses type I IFN signature genes in IFN-γ-exposed CD4 T cells
Naïve T cells were activated by CD3+CD28 plus IFN-γ (100 ng/ml) for 3 days and subjected to mRNA-seq and ChIP-seq (T-bet, H3K4m1, H3K27Ac). (A) Direct T-bet targets are both positively and negatively regulated by T-bet. Scatter plot of gene expression by RNA-seq comparing WT and Tbx21−/− CD4+ T cells. mRNA-seq (n=3 per genotype) were used to identify differentially expressed genes by using the sleuth R package with cut-off of q-value <0.05, fold change >1.5 and >10TPM in at least one condition. T-bet activated- (orange), repressed- (blue), and bound (+) (detected by T-bet ChIP-seq) genes are depicted. See also Table S1. (B) Gene tracks of a T-bet activated (Ifng) and a repressed (Isg15) gene showing expression, enhancer marks (H3K4me1, H3K27Ac) and T-bet binding. For each mark, WT and Tbx21−/− cells are compared. (C) Gene Ontology analysis of T-bet activated and repressed genes defined in Fig. 1A. The top 5 pathways are listed for activated (orange) and repressed (blue) genes with enrichment p-value, number of genes per pathways and names of representative genes.
Figure 2
Figure 2. The distinctive transcriptome induced by IFN-γ in the absence of T-bet approximates an IFN-β-induced transcriptome
(A) Scatter plots of gene expression induced by IFN-β versus IFN-γ in WT cells at 6 hours (IFN-β (n=2), IFN-γ (n=2), 24 hours (IFN-β (n=2), IFN-γ (n=2), and 72 hours (IFN-β (n=5), IFN-γ (n=3)). See also Figure S2A and Table S2. Canonical interferon stimulated genes (ISGs) are marked in yellow, and metabolic genes are denoted as blue; all other genes are marked as gray. (B) Scatter plots showing the effect of T-bet on differential IFN response. In order to depict differential expression between IFN-β and IFN-γ, fold changes (IFN-β/IFN-γ) in WT (X-axis) and Tbx21−/− cells (Y-axis) are compared. (C) Correlation heatmap of transcriptomes induced by IFN-β or IFN-γ of WT and Tbx21−/− cells at 72 hours of IFN exposure. The number of repeats for each condition: WT (no cytokine n=4, IFN-β n=5, IFN-γ n=3), Tbx21−/− (no cytokine n=4, IFN-β n=4, IFN-γ n=3).
Figure 3
Figure 3. Aberrant STAT2 activation in IFN-γ-activated T-bet-deficient cells
(A) Western blot analysis of phospho-STAT2, total STAT2 and β-actin comparing WT and T-bet−/− cells. For each genotype, 3 conditions were tested (no cytokine, IFN-β, IFN-γ). (B) Overlapping and unique STAT2 binding peaks between WT and T-bet−/− cells treated with IFN-γ. (C) Average STAT2 ChIP binding intensity (top panels) and H3K27Ac intensity (bottom panels) centered at STAT2 peaks of ISGs (27 genes). For WT (left panels) and T-bet−/− (right panels), 3 conditions are compared (no cytokines, IFN-γ, IFN-β). (D) Transcription factor binding to T-bet-activated and -repressed genes (as defined in Fig. 1A) is shown. Genes exhibiting transcription factor binding within 50 kb of TSS or TES or inside their gene bodies are counted as direct targets, and percentage of direct targets was calculated for T-bet-activated and -repressed genes. Transcription factors shown include T-bet, STAT1, STAT2 in IFN-γ treated T cells and IRF7 in macrophage (Cohen et al., 2014). See also Figure S3A. (E) Distribution of transcription factor binding to T-bet activated versus T-bet repressed genes. The analysis in (D) was expanded to include multiple transcription factors and conditions some available from public database (Garber et al., 2012; Hirahara et al., 2015; Roychoudhuri et al., 2013; Vahedi et al., 2012; Wei et al., 2010; Yang et al., 2011) (dataset sources are listed in Table S3). Grey bars represent the 95% confidence intervals and median biases expected by chance (also see methods for details). The biases observed in the top four rows were outside of median biases expected by chance and therefore are considered statistically significant (empirical p-values < 1E-4). Two lanes of IFN-γ-induced STAT1 binding are highlighted for comparison, showing differential distribution in the presence (WT) or absence (Tbx21−/−) of T-bet.
Figure 4
Figure 4. Blocking autocrine type I IFNs restores normal IFN-γ transcriptomic response in T-bet deficient T cells
(A) Unbiased hierarchical clustering of 29 transcriptomes derived from WT and Tbx21−/− cells cultured with or without IFN-γ or IFN-β, with or without anti-IFNAR antibody. The resultant dendrogram is shown and samples are color-coded in the legend for: 1. Type of cytokine treatment (no cytokine, nc – gray, IFN-γ – orange, and IFN-β – blue), 2. Cell genotype (WT - gray, Tbx21−/− - red), 3. Anti-IFNAR antibody treatment (no antibody – gray, with antibody – purple). Numbers of repeats included in analysis: WT (no cytokine n=4, IFN-β n=5, IFN-γ n=3), Tbx21−/− (no cytokine n=4, IFN-β n=4, IFN-γ n=3, IFN-γ+anti-IFNAR n=6). (B) Heatmap showing relative gene expression of ISGs comparing WT and Tbx21−/− cells. Numbers of repeats included in analysis and color-codes for samples are the same as in (A). For anti-IFNAR treatment, 3 different doses were tested and samples were acquired in duplicates per dose. Presence or absence of T-bet binding on each gene is shown on the left. See also Figure S4. (C) Absolute gene expression (TPM) of STAT2 in 9 different conditions is shown. (D) Western blot analysis of pSTAT2 and total STAT2 protein in IFN-γ-treated Tbx21−/− cells with or without anti-IFNAR antibody is shown.
Figure 5
Figure 5. T-bet selectively constrains type I IFN transcription factors and represses type I IFN circuitry in vivo
(A) Experimental design of Toxoplasma infection study. (B) Unbiased clustering of transcriptomic data derived from 24 samples including native uninfected cells (Tn) and infected cells (all others). Each sample is color-coded for 1. Cell genotype (WT - gray, Tbx21−/− - red), 2. Type of infection and tissue location (uninfected naïve T cells – black, LCMV Armstrong infected splenic T cells – brown, LCMV clone 13 infected splenic T cells – yellow, Toxoplasma infected splenic T cells – blue, Toxoplasma infected peritoneal exudate cells – purple). Numbers of repeats included in analysis are the same for both WT and Tbx21−/−: (naive n=2, LCMV-Cl13 n=3, LCMV-Arm n=3, Toxoplasma spleen n=2, toxoplasma PEC n=2). (C) Heatmap showing relative gene expression of STAT and IRF family transcription factors. Each sample is color-coded for; 1. Type of infection and tissue location (no infection, naïve T – black, LCMV Armstrong infected splenic T cells – brown, LCMV clone 13 infected splenic T cells – yellow, Toxoplasma infected splenic T cells – blue, Toxoplasma infected peritoneal exudate cells – purple), 2. Cell genotype (WT - grey, Tbx21−/− - red).

Comment in

  • T-bet Runs INTERFERence.
    Lazarevic V, Szabo S, Glimcher LH. Lazarevic V, et al. Immunity. 2017 Jun 20;46(6):968-970. doi: 10.1016/j.immuni.2017.05.010. Immunity. 2017. PMID: 28636963 Free PMC article.

References

    1. Arimoto KI, Löchte S, Stoner SA, Burkart C, Zhang Y, Miyauchi S, Wilmes S, Fan JB, Heinisch JJ, Li Z, et al. STAT2 is an essential adaptor in USP18-mediated suppression of type I interferon signaling. Nat Struct Mol Biol. 2017;24:279–289. - PMC - PubMed
    1. Boehm U, Klamp T, Groot M, Howard JC. Cellular responses to interferon-gamma. Annu Rev Immunol. 1997;15:749–795. - PubMed
    1. Bray NL, Pimentel H, Melsted P, Pachter L. Near-optimal probabilistic RNA-seq quantification. Nat Biotechnol. 2016;34:525–527. - PubMed
    1. Cohen M, Matcovitch O, David E, Barnett-Itzhaki Z, Keren-Shaul H, Blecher-Gonen R, Jaitin DA, Sica A, Amit I, Schwartz M. Chronic exposure to TGFbeta1 regulates myeloid cell inflammatory response in an IRF7-dependent manner. EMBO J. 2014;33:2906–2921. - PMC - PubMed
    1. Darnell JEJ, Kerr IM, Stark GR. Jak-STAT pathways and transcriptional activation in response to IFNs and other extracellular signaling proteins. Science. 1994;264:1415–1421. - PubMed

Publication types

MeSH terms