

A normal genetic variation modulates synaptic MMP-9 protein levels and the severity of schizophrenia symptoms
- PMID: 28623238
- PMCID: PMC5538295
- DOI: 10.15252/emmm.201707723
A normal genetic variation modulates synaptic MMP-9 protein levels and the severity of schizophrenia symptoms
Abstract
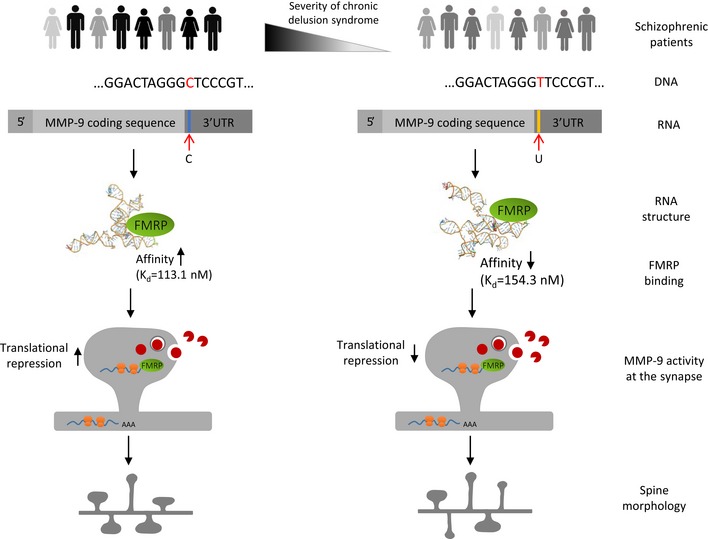
Matrix metalloproteinase 9 (MMP-9) has recently emerged as a molecule that contributes to pathological synaptic plasticity in schizophrenia, but explanation of the underlying mechanisms has been missing. In the present study, we performed a phenotype-based genetic association study (PGAS) in > 1,000 schizophrenia patients from the Göttingen Research Association for Schizophrenia (GRAS) data collection and found an association between the MMP-9 rs20544 C/T single-nucleotide polymorphism (SNP) located in the 3'untranslated region (UTR) and the severity of a chronic delusional syndrome. In cultured neurons, the rs20544 SNP influenced synaptic MMP-9 activity and the morphology of dendritic spines. We demonstrated that Fragile X mental retardation protein (FMRP) bound the MMP-9 3'UTR We also found dramatic changes in RNA structure folding and alterations in the affinity of FMRP for MMP-9 RNA, depending on the SNP variant. Finally, we observed greater sensitivity to psychosis-related locomotor hyperactivity in Mmp-9 heterozygous mice. We propose a novel mechanism that involves MMP-9-dependent changes in dendritic spine morphology and the pathophysiology of schizophrenia, providing the first mechanistic insights into the way in which the single base change in the MMP-9 gene (rs20544) influences gene function and results in phenotypic changes observed in schizophrenia patients.
Keywords: Fragile X mental retardation protein; dendritic spine morphology; matrix metalloproteinase 9; phenotype‐based genetic association study; single‐nucleotide polymorphism.
© 2017 The Authors. Published under the terms of the CC BY 4.0 license.
Figures
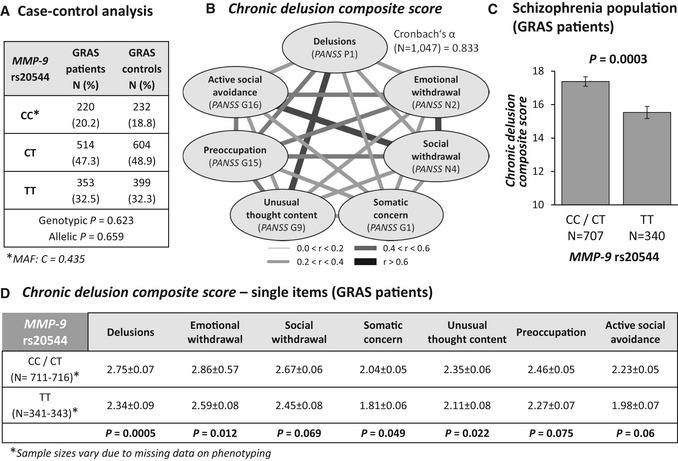
Case–control analysis reveals similar genotypic and allelic distributions of MMP‐9 rs20544 genotypes in patients and controls. MAF, minor allele frequency.
High intercorrelation of PANSS items that constitute the chronic delusion composite score (Spearman rank correlation coefficients), reflected by the high internal consistency of the scale (Cronbach's α = 0.833).
Genotype effect of MMP‐9 rs20544 on the chronic delusion composite score. C carriers (CC/CT) had a significantly higher score than TT carriers.
Association between rs20544 genotypes and subitems of the chronic delusion composite score.
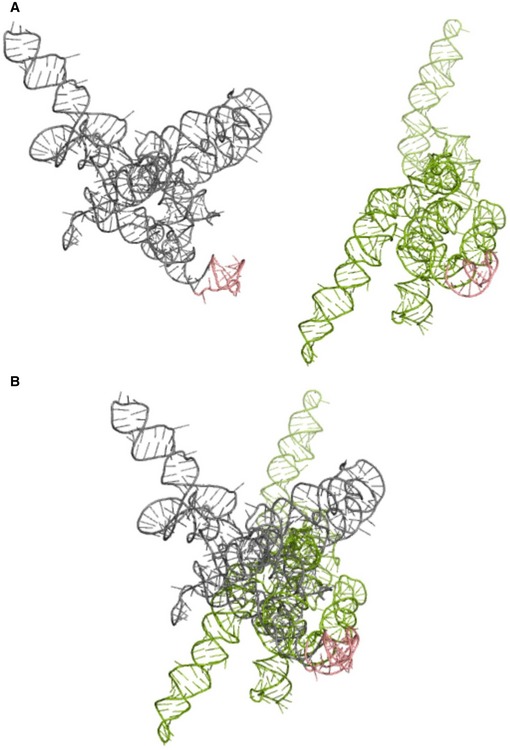
MMP‐9_C (gray) and MMP‐9_T (green) RNA structures predicted by RNAComposer based on the experimental data.
Superposition of the MMP‐9_C and MMP‐9_T RNA structures from (A). The hairpin implemented in FMRP binding is shown in pink. Structures are aligned according to the hairpin implemented in FMRP binding.
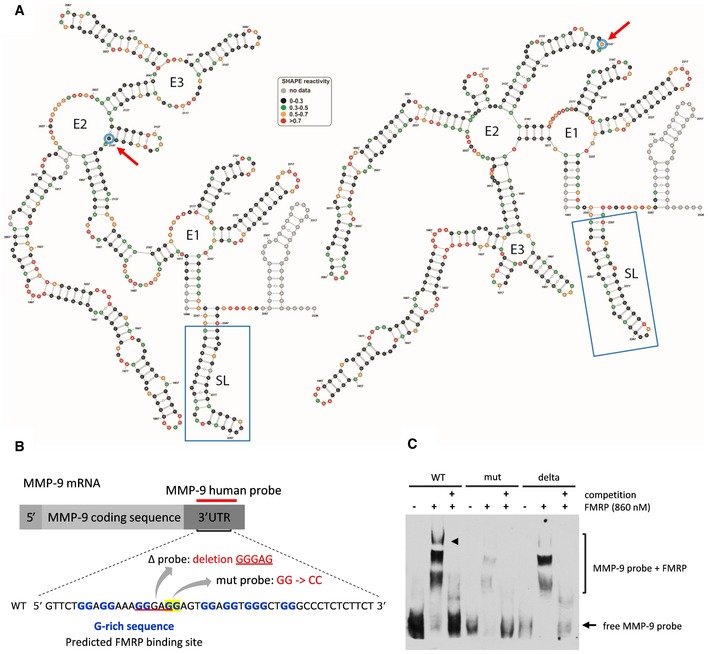
Secondary structure models of 469 nt at the 3′ end of MMP‐9 mRNA obtained by RNA structure probing in solution (SHAPE analysis). Blue circles and red arrows, rs20544 polymorphism; blue boxes, G‐rich region, predicted FMRP binding site.
Sequence of RNA probes that were used in the RNA electrophoretic mobility shift assay (REMSA). The location of the G‐rich sequence is indicated.
REMSA showing FMRP binding to probes described in (B). The arrowhead indicates the FMRP/MMP‐9 RNA complex band that is clearly visible for the human wild‐type probe but is hardly detectable for the probe that harbored a mutation or deletion. 100× molar excess of unlabeled probe was added as a competitor to confirm the specificity of the interaction. The figure shows a representative image from three independent experiments.
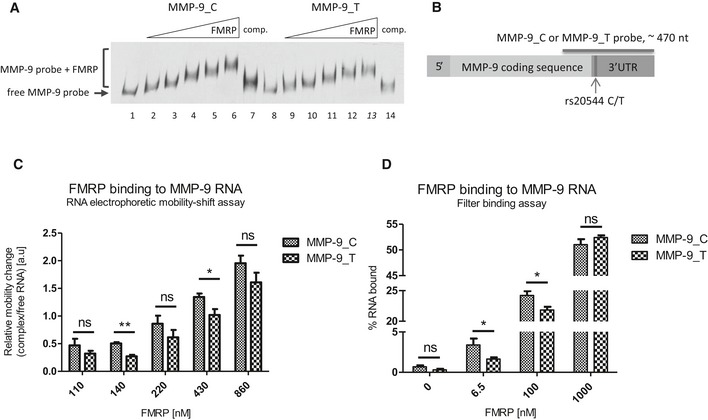
Representative RNA electrophoretic mobility shift assay (REMSA) results. Labeled MMP‐9 RNA probe was incubated in the absence (lanes 1 and 8) or presence of increasing amounts of purified FMRP (lanes 2–6 and 9–13). 20× molar excess of unlabeled probe was added as a competitor to confirm the specificity of the interaction (lanes 7 and 14).
Scheme of MMP‐9 mRNA indicating the location of the rs20544 polymorphism and part of the sequence that was used as a probe in the REMSA (A, C) and filter binding assay (D).
Quantification of REMSA experiments. The relative mobility change of the protein–RNA complexes from the corresponding free probe band was plotted against increasing FMRP concentrations. For each FMRP concentration, the average distance of the shifted complex/free probe band was calculated from at least three independent experiments.
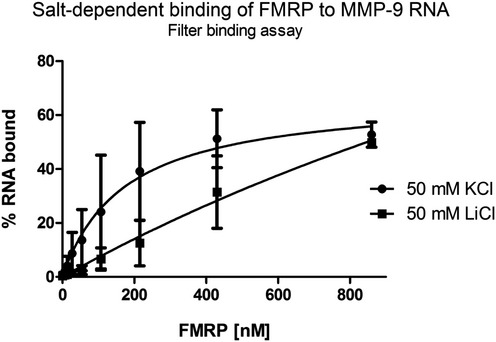
Quantification of filter binding assay. The fraction of bound RNA was plotted against increasing FMRP concentrations. The data are from five independent experiments. Each column represents the mean counted from range of concentrations (indicated in Materials and Methods), with the final concentration shown on the abscissa.
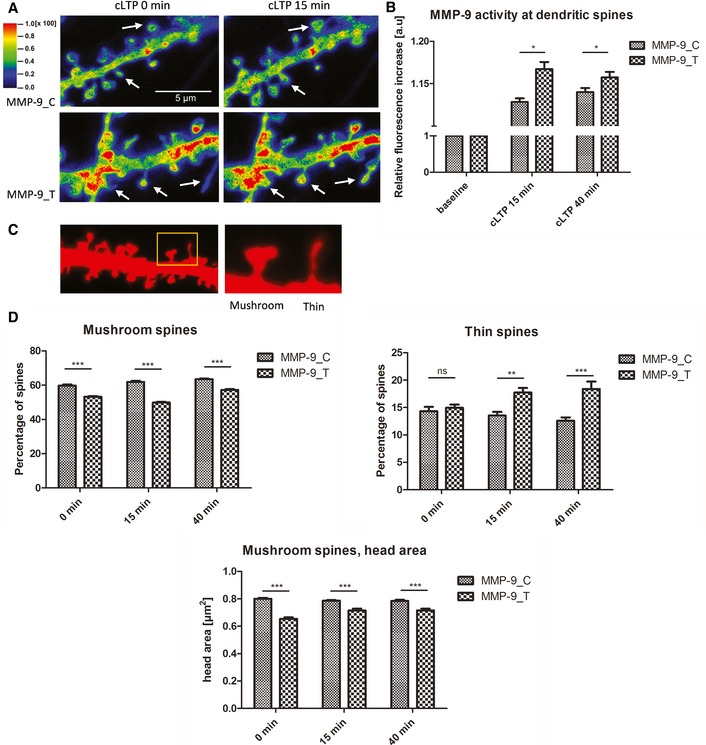
Exemplary images from FITC‐tagged gelatin (DQ‐gelatin) assay showing colocalization map of FITC fluorescence that corresponds to gelatinolytic activity. Red fluorescent protein was used to label cell morphology, showing a short stretch of dendrite that overexpressed either the MMP‐9_C or MMP‐9_T variant. Warmer colors correspond to higher gelatinolytic activity. Dendritic spines with an increase in gelatinolytic activity are marked with arrows.
Quantification of analyzed data from four separate experiments. The relative increase in fluorescence was measured for individual spines over time as a readout of MMP‐9 activity. A total of 17 cells (MMP‐9_C) or 13 cells (MMP‐9_T) were analyzed.
Image from morphological analysis of spines from primary rat hippocampal neurons showing example of mushroom and thin spine shapes.
The rs20544 polymorphism influenced the percent distribution of spine shape. Quantification of percent distribution of mushroom and thin spines from time‐lapse imaging from three separate experiments. Neurons that overexpressed MMP‐9_C had more mushroom spines and less thin spines than the MMP‐9_T variant. For each polymorphic variant, six cells were analyzed; the total number of spines analyzed was n spines = 419 for MMP‐9_C and n spines = 465 for MMP‐9_T.
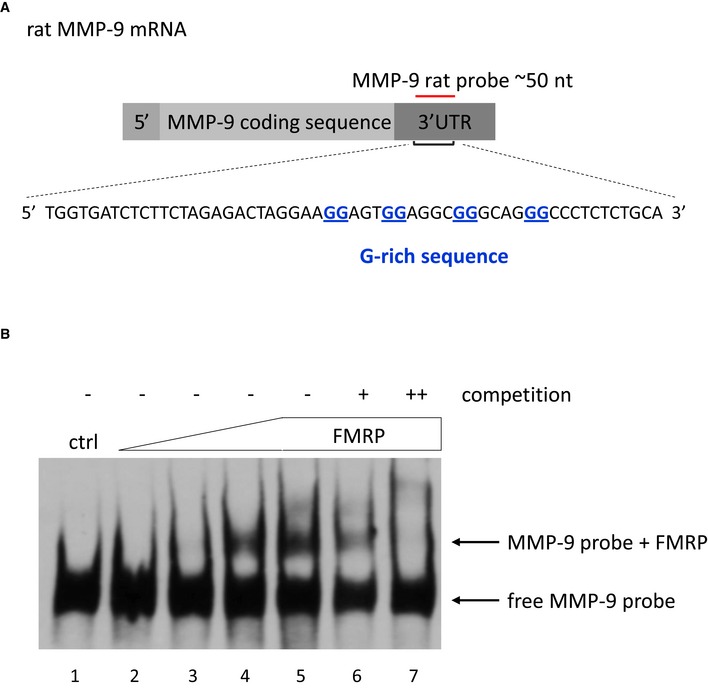
Sequence used to prepare the rat MMP‐9 RNA probe that was used in the RNA electrophoretic gel‐shift assay shown in (B).
The labeled MMP‐9 RNA probe was incubated in the absence (lane 1) or presence of increasing amounts of purified FMRP (70–860 nM, lanes 2–5). 20× and 200× molar excess of unlabeled probe was added as competitor to the reactions with 860 nM FMRP to confirm the specificity of the interaction (lanes 6–7, respectively). The figure shows a representative image from three independent experiments.
References
-
- Ali FT, Abd El‐Azeem EM, Hamed MA, Ali MAM, Abd Al‐Kader NM, Hassan EA (2017) Redox dysregulation, immuno‐inflammatory alterations and genetic variants of BDNF and MMP‐9 in schizophrenia: pathophysiological and phenotypic implications. Schizophr Res doi:10.1016/j.schres.2017.01.016 - DOI - PubMed
-
- American Psychiatric Association (2000) Diagnostic and statistical manual of mental disorders, 4th edn Washington, DC: American Psychiatric Press;
-
- Begemann M, Grube S, Papiol S, Malzahn D, Krampe H, Ribbe K, Friedrichs H, Radyushkin KA, El‐Kordi A, Benseler F et al (2010) Modification of cognitive performance in schizophrenia by complexin 2 gene polymorphisms. Arch Gen Psychiatry 67: 879–888 - PubMed
Publication types
MeSH terms
Substances
LinkOut - more resources
Full Text Sources
Other Literature Sources
Miscellaneous
