. 2017 Jun 16;7(1):3670.
doi: 10.1038/s41598-017-03953-w.

No-scanning 3D measurement method using ultrafast dimensional conversion with a chirped optical frequency comb

Affiliations

No-scanning 3D measurement method using ultrafast dimensional conversion with a chirped optical frequency comb

Takashi Kato et al. Sci Rep. .

Abstract

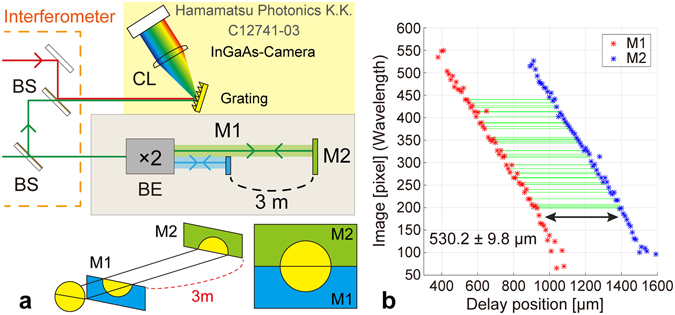
A simultaneously high-precision, wide-range, and ultrafast time-resolution one-shot 3D shape measurement method is presented. Simultaneous times of flight from multiple positions to a target encoded in a chirped optical frequency comb can be obtained from spectral interferometry. We experimentally demonstrate a one-shot imaging profile measurement of a known step height of 480 µm with µm-level accuracy. We further demonstrate the extension of the dynamic range by measuring in one shot a large step height of 3 m while maintaining high accuracy using the accurate pulse-to-pulse separation of the optical frequency comb. The proposed method with its large dynamic range and measurement versatility can be applied to a broad range of applications, including microscopic structures, objects with large size or aspect ratio, and ultrafast time-resolved imaging. This study provides a powerful and versatile tool for 3D measurement, where various ranges of measurement performances can be tailored to demand.


Conflict of interest statement

The authors declare that they have no competing interests.

Figures

Figure 1
Figure 1
Measurement principle based on spectral interferometry with chirped pulses. Spectral interferometry with a chirp-free reference pulse and (a) chirp-free and (cg) chirped probe pulses. (a and c) Space diagram of the pulses. (b and d) Schematics of interference fringe spectra. Minimum fringe frequency (MFF) indicates the region showing the broadest fringe. (e) Space diagram of reference and probe pulses reflected from a target. (f) Schematic of interference spectra. (g) Relation between wavelengths showing MFF and delay.
Figure 2
Figure 2
Schematic of the experimental setup. (a) Experimental setup for the position measurement. LD: laser diode, WDM: wavelength division multiplexing coupler, PQH: polarization controller, EDF: erbium-doped fibre, ND: neutral density filter, and BS: beam splitter with f rep: 51 MHz, central wavelength: 1.56 µm, and average power: 8 mW after EDFA. (b) The optical spectra and (c) autocorrelation traces for the reference and probe pulses.
Figure 3
Figure 3
Results of the position measurement. (a) False colour plot of spectral interference fringes obtained by changing delay positions. A series of data points corresponding to minimum fringe frequencies (MFFs) are plotted. The 33 yellow circles labelled ‘Spectrogram’ were obtained via FFT, while the blue circles labelled ‘Simplified analysis’ were obtained via the differentiation of the spectrum (bd). Details can be found in Methods section.
Figure 4
Figure 4
Schematic of the step measurement and captured images. (a) Experimental setup for the step measurement. Interferometer setup is shared with setup shown in Fig. 2a. BE: beam expander and CL: cylindrical lens. Grating: diffraction grating, 600 line/mm. (b) Captured spectral interferometric images by InGaAs camera at each delay position (number in each image, in µm unit). The images were processed so that the contrast was enhanced, and the horizontal and vertical directions of each image represent the wavelength and beam positions. Black dashed lines in each image are guide for eyes indicating area of steps A and B. (c) Zoomed image is at a delay position of 960 µm. To obtain longitudinal heights for steps A and B, 36 horizontal cross-sectional lines between upper and bottom white lines and central red dashed line were analysed. Horizontal yellow dashed lines indicate central area in the regions of steps A and B.
Figure 5
Figure 5
Results of the step measurement. (a) Series of MFFs corresponding to the central areas of steps A and B. (b) Series of MFFs for all 36 beam positions obtained by changing delay positions. Detailed explanations can be found in the text. (c) Profile for the step shape of gauge blocks obtained from one-shot imaging at a delay position of 960 µm (Fig. 4c). Overlapping regions between the areas A and B due to the diffraction of the edge are not shown and the edge position was determined based on the rough estimation of the irradiated beam position.
Figure 6
Figure 6
Schematic and results of the large step measurement. (a) Experimental setup for the large step measurement. The interferometer setup is same as that shown in Fig. 2a. (b) Series of minimum fringe frequencies obtained for the two m-sized separated mirrors.

References

    1. Dresel T, Häusler G, Venzke H. Three-dimensional sensing of rough surfaces by coherence radar. Appl. Opt. 1992;31(7):919–925. doi: 10.1364/AO.31.000919. - DOI - PubMed
    1. Carter W, et al. Airborne laser swath mapping shines new light on Earth’s topography. Eos, Trans. Am. Geophys. Union. 2001;82:549–549. doi: 10.1029/01EO00321. - DOI
    1. Omasa K, Hosoi F, Konishi A. 3D lidar imaging for detecting and understanding plant responses and canopy structure. J. Exp. Bot. 2006;58:881–898. doi: 10.1093/jxb/erl142. - DOI - PubMed
    1. Okutomi M, Kanade T. A mutiple-baseline stereo. IEEE Transactions on Pattern Analysis and Machine Intelligence. 1993;15(4):353–363. doi: 10.1109/34.206955. - DOI
    1. Huang D, et al. Optical coherence tomography. Science. 1991;254:1178–1181. doi: 10.1126/science.1957169. - DOI - PMC - PubMed

Publication types