. 2017 Jun 16;7(1):3688.
doi: 10.1038/s41598-017-03961-w.

Human bipedalism and body-mass index

Affiliations

Human bipedalism and body-mass index

Su Do Yi et al. Sci Rep. .

Abstract

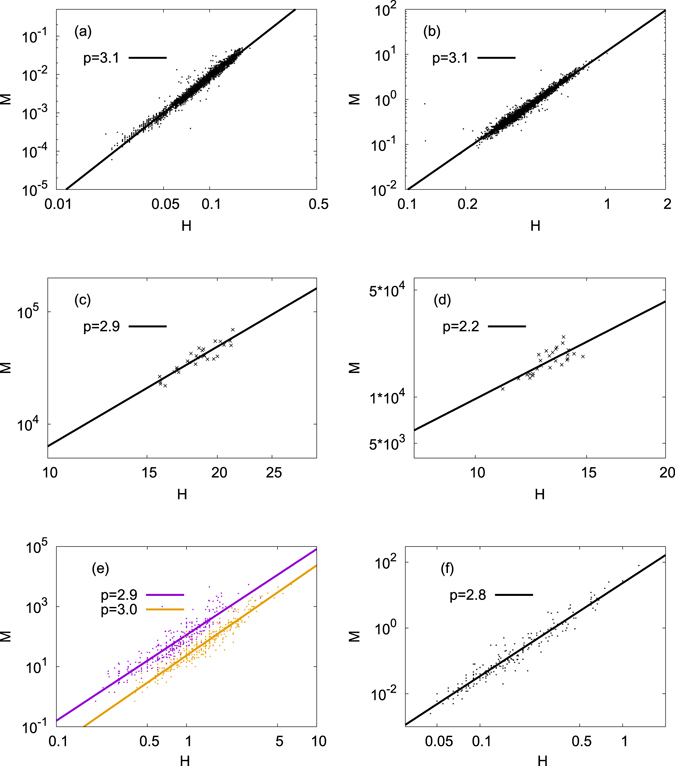
Body-mass index, abbreviated as BMI and given by M/H 2 with the mass M and the height H, has been widely used as a useful proxy to measure a general health status of a human individual. We generalise BMI in the form of M/H p and pursue to answer the question of the value of p for populations of animal species including human. We compare values of p for several different datasets for human populations with the ones obtained for other animal populations of fish, whales, and land mammals. All animal populations but humans analyzed in our work are shown to have p ≈ 3 unanimously. In contrast, human populations are different: As young infants grow to become toddlers and keep growing, the sudden change of p is observed at about one year after birth. Infants younger than one year old exhibit significantly larger value of p than two, while children between one and five years old show p ≈ 2, sharply different from other animal species. The observation implies the importance of the upright posture of human individuals. We also propose a simple mechanical model for a human body and suggest that standing and walking upright should put a clear division between bipedal human (p ≈ 2) and other animals (p ≈ 3).


Conflict of interest statement

The authors declare that they have no competing interests.

Figures

Figure 1
Figure 1
The mass M versus the linear body size H of animals: (a) Pale chub (Zacco platypus) (N = 3 163) and (b) Korean chub (Zacco koreanus) (N = 997) are for fishes, (c) Fin (N = 29) and (d) Sei (N = 27) are for whales, and (e) and (f) are for land mammals, respectively. The data file used for (e) contains all 325 lines of the mass, the body length, and the shoulder height information of many different species of land mammals, while the file used for (f) contains 205 lines of the mass and the body length of species in order Rodentia. In (e) two different ways to measure the linear size, the shoulder height (upper points) and the body length (lower points) are displayed. In all datasets in (a)–(f), we observe that the Benn index p ≈ 3, with (d) an exception, probably due to insufficient data size for Sei whales.
Figure 2
Figure 2
The mass M and the height H for humans: (a) and (b) for the data from Sweden, (c) from Korea, and (d) from WHO (see text for details of the used datasets). The linear regression for the entire data in (a) for Swedish children gives the Benn index p = 2.1. In (b), we divide all Swedish data into two groups depending on whether the child is younger or older than one year after birth. The left part of the data for children younger than one year old has p ≈ 2.8 while children older than one year (the right part of the data) has p ≈ 1.8. (c) Data for Korean children drawn in the same way as for (b), giving us p ≈ 2.5 and p ≈ 1.9 depending on the age group (younger and older than one year, respectively). (d) WHO data displayed in the same way. Again, we see the change of p value at around one year after birth. Although all data points in each dataset are used to perform the linear regressions in (a)–(c), we use only 10000 randomly chosen points in each scatter plot for (a)–(c), only for convenience of visibility.
Figure 3
Figure 3
(a) We assume that the human body is a uniform cylinder with the radius R and the height H. It is supported on a rigid substrate (a representation of human feet). Suppose that the human body cylinder is tilted forward as shown in (b) by a small angle θ. To achieve the stability of the tilted posture, two competitive torques, one from the skeletal muscle force F m and the other from the gravitational force F g, must be balanced. The gravitational torque is written as T g = F g(x/2) with x/2 being the shift of the horizontal position of the center of mass (CM). We assume that F m depends on the extension y of muscles as shown in (b). For the tilting angle θ, we get x=Hsinθ and y=Rsinθ=xR/H.

References

    1. Quetelet, M. A. A Treatise on Man and the Developments of his Faculties (Burt Franklin, New York, 1842). - PubMed
    1. Keys A, Fidanza F, Karvonen MJ, Kimura N, Taylor HL. Indices of relative weight and obesity. J. Chronic Dis. 1972;25:329. doi: 10.1016/0021-9681(72)90027-6. - DOI - PubMed
    1. Janssen I, Katzmarzyk PT, Ross R. Waist circumference and not body mass index explains obesity-related health risk. Am. J. Clin. Nutr. 2004;79:379. - PubMed
    1. Holland FJ, Stark O, Ades AE, Peckham CS. Birth weight and body mass index in childhood, adolescence, and adulthood as predictors of blood pressure at age 36. J. Epidemiol. Community Health. 1993;47:432. doi: 10.1136/jech.47.6.432. - DOI - PMC - PubMed
    1. Benn RT. Some mathematical properties of weight-for-height indices used as measures of adiposity. Brit. J. Prev. Soc. Med. 1971;25:42. - PMC - PubMed

Publication types