. 2017 Jun 16:7:127-139.
doi: 10.1016/j.omtn.2017.03.005. Epub 2017 Mar 29.

Mir30c Is Involved in Diabetic Cardiomyopathy through Regulation of Cardiac Autophagy via BECN1

Affiliations

Mir30c Is Involved in Diabetic Cardiomyopathy through Regulation of Cardiac Autophagy via BECN1

Chen Chen et al. Mol Ther Nucleic Acids. .

Abstract

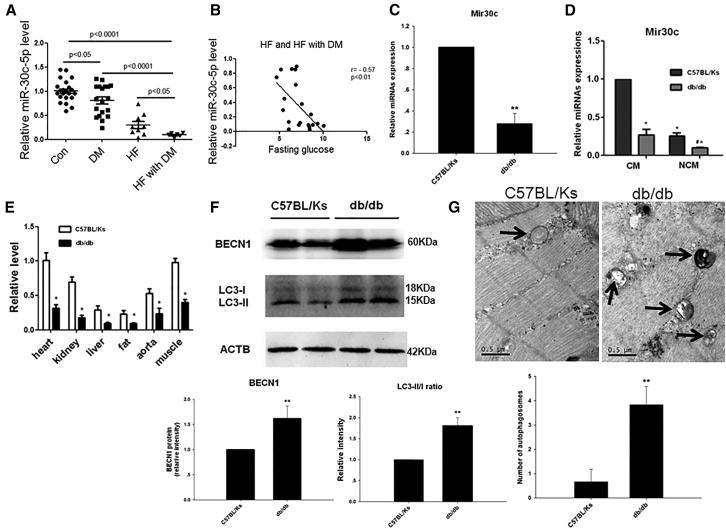
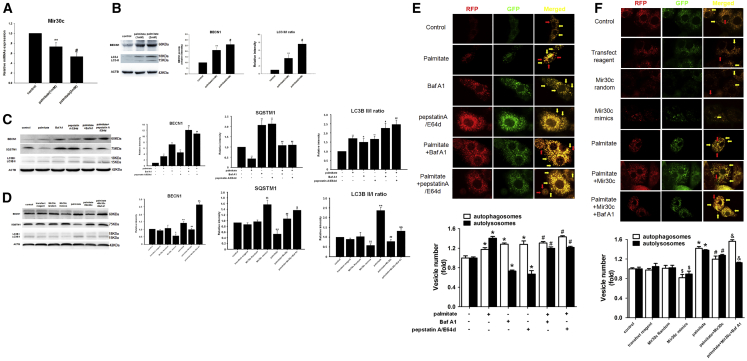
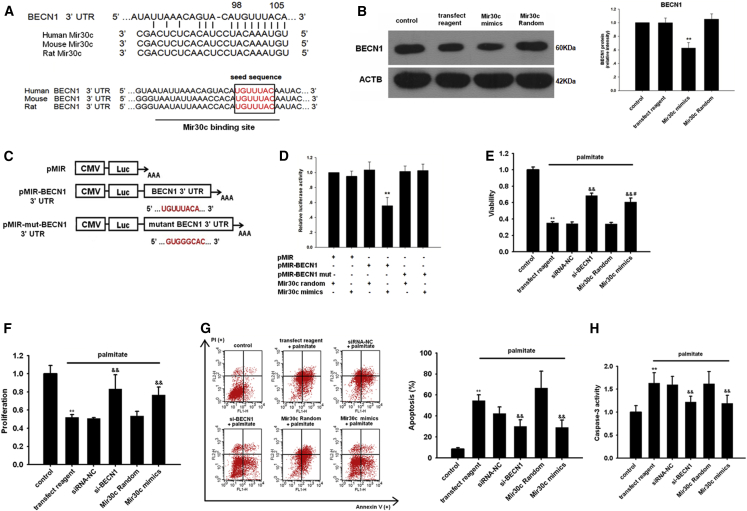
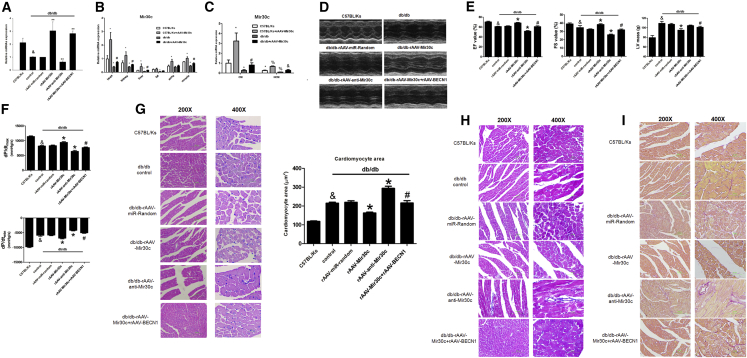
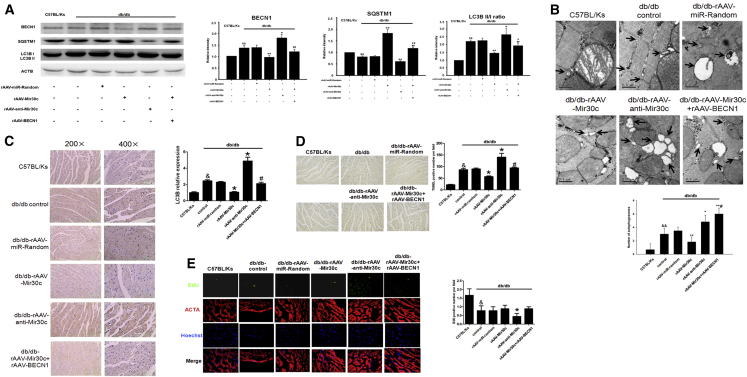
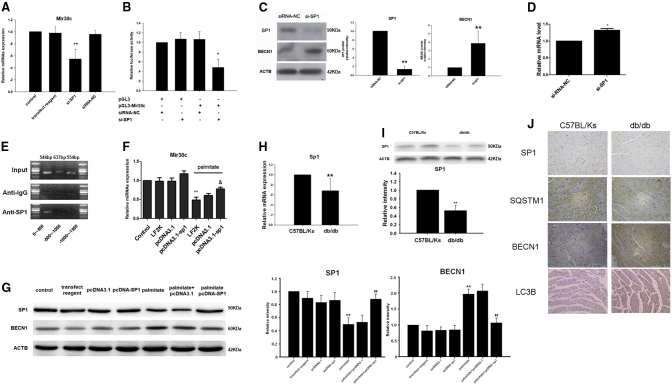
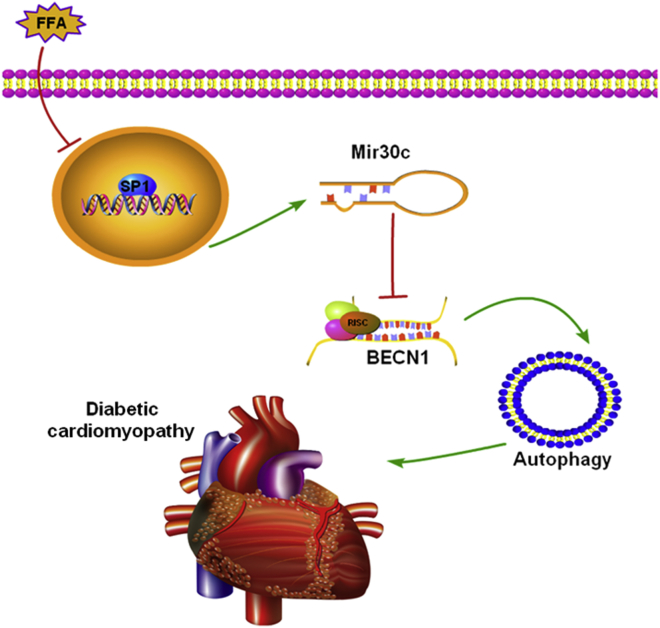
Multiple factors have been shown to promote the progression of diabetic cardiomyopathy. A link has previously been found between Mir30 and autophagy in cancer cells and in the heart, but the role of Mir30 in diabetic heart has not been studied. Using in vitro and in vivo approaches, we found that the depletion of Mir30c and induction of BECN1 enhanced autophagy in diabetic (db/db) hearts and in cardiomyocytes treated with the fatty acid palmitate. We verified that Mir30c repressed BECN1 expression by direct binding to the BECN1 3' UTRs. Mir30c overexpression inhibited the induction of BECN1 and subsequent autophagy in diabetic hearts and improved cardiac function and structure in diabetic mice. However, these effects were abrogated by BECN1 overexpression. Similarly, Mir30c knockdown resulted in increased BECN1 levels and autophagic flux, aggravating cardiac abnormalities. We also show that SP1, an important transcriptional factor in energy metabolism regulation, is a key upstream activator of Mir30c that binds the promoter region of Mir30c. Our findings indicate that downregulation of Mir30c and subsequent activation of BECN1 promotes autophagy, contributing to the pathogenesis of diabetic cardiomyopathy. This observation suggests a theoretical ground for developing microRNA-based therapeutics against diabetic cardiomyopathy by inhibiting autophagy.

Keywords: BECN1; Mir30c; autophagy; cardiac dysfunction; diabetes.


Figures

Figure 1
Figure 1
Mir30c Is Downregulated and Autophagy Is Induced in Diabetic Mouse Hearts (A) Relative circulating miRNA levels in patients. (B) The correlation between circulating Mir30c levels and fasting glucose. Relative Mir30c expression was determined by qRT-PCR in the heart (C), CMs and NCMs (D), and various organs (E) in 24-week-old animals. (F) Western blotting detection (left) and quantification (middle and right) of the cardiac autophagy-related proteins BECN1 and LC3. ACTB was used as an internal control. (G) Representative autophagic vacuoles from cardiac tissues (arrows) analyzed by transmission electron microscopy (magnification ×38,000). Data are expressed as mean ± SEM (n = 8). For all panels, *p < 0.05 versus C57BL/Ks; **p < 0.01 versus C57BL/Ks. Data are representative of three independent experiments.
Figure 2
Figure 2
High FFA Concentrations Inhibit Mir30c Expression and Enhance Autophagy in Cultured H9c2 Cardiac Cells H9c2 cells were analyzed after 48-hr treatment with different concentrations of palmitate (1 mM or 2 mM) and Mir30c mimics (100 nM) in the presence or absence of 2 hr Baf A1 (10 nM), pepstatin A (10 μg/mL), or E64d (10 μg/mL). (A) Relative Mir30c expression in H9c2 cells treated with palmitate, as determined by qRT-PCR. (B–D) Levels of BECN1 and LC3 (B) and BECN1, LC3, and SQSTM1 (C and D) were determined in cell lysates by western blotting. ACTB was used as an internal control. (E and F) Live-cell imaging of H9c2 cells transfected with Ad-mRFP-GFP-LC3 (1,000× magnification). Autophagosomes are labeled both with GFP and mRFP and appear yellow in the merged image (yellow arrow indicated). Autolysosomes are labeled with mRFP only and appear red in the merged image (red arrow indicated). Data are expressed as mean ± SEM. For all panels, *p < 0.05 versus control, **p < 0.01 versus control, #p < 0.05 versus palmitate (1 mM), ##p < 0.01 versus palmitate (1 mM), $p < 0.05 versus Mir30c Random, $$p < 0.01 versus Mir30c random, &p < 0.05 versus palmitate + Mir30c, and &&p < 0.01 versus palmitate + Mir30c. Data are representative of three independent experiments.
Figure 3
Figure 3
BECN1 Is a Direct Target of Mir30c (A) Sequence alignment of Mir30c and BECN1 3′ UTR from different species. (B) The effect of Mir30c on the BECN1 protein levels in H9c2 cells was determined by western blotting. **p < 0.01 versus Mir30c random. (C) A schematic diagram of luciferase reporter plasmids pMIR-BECN1 3′ UTR-WT and pMIR-mut-BECN1 3′ UTR, with the potential Mir30c target site on BECN1 3′ UTR shown in red. (D) Regulation of BECN1 via Mir30c-targeting of BECN1 3′ UTR was determined with luciferase reporter assays in HEK293 cells. **p < 0.01 versus BECN1 3′ UTR + Mir30c random. H9c2 cells were treated with various RNA constructs and their viability (E), proliferation (F), and apoptosis (G and H) were determined by CCK8 assay, BrdU incorporation assay, and Annexin V/PI and caspase-3 activity assay, respectively, as described in the Materials and Methods. **p < 0.01 versus control, &&p < 0.01 versus palmitate + transfection reagent, and #p < 0.05 versus palmitate + si-BECN1. Data are expressed as mean ± SEM and are representative of three independent experiments.
Figure 4
Figure 4
Mir30c Overexpression Relieves Cardiac Dysfunction in db/db Mice Animals (24-week-old db/db mice and C57BL/Ks control mice) were analyzed after treatment with recombinant adeno-associated viruses (rAAVs). (A–C) Relative expression of Mir30c was determined by qRT-PCR. (A) Cardiac expression of Mir30c in rAAV-treated mice. &p < 0.05 versus C57BL/Ks and **p < 0.01 versus db/db control. (B) Relative expression of Mir30c in different organs. *p < 0.05 versus C57BL/Ks and #p < 0.05 versus db/db. (C) Relative expression of Mir30c in isolated CMs and NCMs. *p < 0.05 versus C57BL/Ks CM, #p < 0.05 versus db/db CM, %p < 0.05 versus C57BL/Ks NCM, and &p < 0.05 versus db/db NCM. (D and E) Echocardiographic analysis of db/db mice and C57BL/Ks controls. EF% (ejection fraction), FS% (fractional shortening), and LV masses were quantitatively analyzed. (F) Hemodynamic analysis of db/db mice and C57BL/Ks controls. dp/dtmax, peak instantaneous rate of LV pressure increase; dp/dtmin, peak instantaneous rate of LV pressure increase decline. (G) CM visualization and CM size quantitation following various treatments. &p < 0.05 versus C57BL/Ks, *p < 0.05 versus db/db control, **p < 0.01 versus db/db control, and #p < 0.05 versus db/db rAAV-Mir30c. (H) Cardiac fibrosis, as determined by Masson staining. (I) Cardiac fibrosis, as determined by Sirius red staining. Data are expressed as mean ± SEM (n = 8) and are representative of three independent experiments.
Figure 5
Figure 5
Mir30c Downregulates BECN1, Protecting db/db Hearts from Excessive Autophagy (A) Mice were treated with different RNA constructs, and BECN1, SQSTM1, and LC3 protein levels were determined by western blotting, with ACTB as an internal control. Protein band intensity in C57BL/Ks was set as 1, and relative protein intensities are presented as fold changes. (B) Autophagosomes (arrows) in mouse cardiac tissues were analyzed by transmission electron microscopy and quantified per field. (C) Cardiac LC levels were assessed by immunohistochemistry. (D) Cardiac apoptosis was examined with TUNEL assay (200× magnification). (E) Cardiac proliferation was determined by EdU staining (600× magnification). In all panels, data are expressed as mean ± SEM (n = 8). &p < 0.05 versus C57BL/Ks, &&p < 0.01 versus C57BL/Ks, *p < 0.05 versus db/db control, **p < 0.01 versus db/db control, #p < 0.05 versus db/db rAAV-Mir30c, and ##p < 0.01 versus db/db rAAV-Mir30c. Data are representative of three independent experiments.
Figure 6
Figure 6
SP1 Regulates Mir30c In Vitro (A) Relative Mir30c expression in H9c2 cells treated with siRNA was determined by qRT-PCR. **p < 0.01 versus siRNA-NC. (B) Regulation of Mir30c expression by SP1 was analyzed by luciferase assays. *p < 0.05 versus pGL3-Mir30c + siRNA-NC. (C) BECN1 and SP1 protein levels in H9c2 cells transfected with si-SP1, as determined by western blotting. ACTB was used as an internal control. (D) Relative mRNA expression levels of BECN1 in H9c2 cells transfected with si-SP1. Gene expression was analyzed by qRT-PCR. *p < 0.05 versus siRNA-NC and **p < 0.01 versus siRNA-NC. (E) ChIP assays were performed with HEK293 cells. (F) Relative Mir30c expression in vitro, as determined by qRT-PCR. **p < 0.01 versus control and &p < 0.05 versus palmitate + LF2K. (G) Relative protein levels of BECN1 and SP1 invitro analyzed by western blotting. ACTB was used as an internal control. **p < 0.01 versus control and ##p < 0.01 versus palmitate. (H) Relative Sp1 mRNA levels in animal hearts were determined by qRT-PCR. Gapdh was used as an internal control. (I) Relative Sp1 protein levels in animal hearts were detected by western blotting and ACTB was used as an internal control. Data are expressed as mean ± SEM (n = 8). **p < 0.01 versus C57BL/Ks. (J) SP1, SQSTM1, BECN1, and LC3B proteins in rodent hearts were detected by immunohistochemistry (200× magnification). In all panels, data are representative of three independent experiments.
Figure 7
Figure 7
The Roles of Mir30c and Autophagy in Diabetic Cardiomyopathy Our results show that in db/db hearts, lipotoxicity from increased levels of free fatty acids (FFAs) downregulates SP1 in the nucleus. This leads to less Mir30c being transcribed, which results in increased levels of BECN1. More BEC1 leads to more autophagy, which contributes to the pathology of diabetic cardiomyopathy in an undetermined manner.

References

    1. Rubler S., Dlugash J., Yuceoglu Y.Z., Kumral T., Branwood A.W., Grishman A. New type of cardiomyopathy associated with diabetic glomerulosclerosis. Am. J. Cardiol. 1972;30:595–602. - PubMed
    1. Boudina S., Abel E.D. Diabetic cardiomyopathy revisited. Circulation. 2007;115:3213–3223. - PubMed
    1. Belke D.D., Larsen T.S., Gibbs E.M., Severson D.L. Altered metabolism causes cardiac dysfunction in perfused hearts from diabetic (db/db) mice. Am. J. Physiol. Endocrinol. Metab. 2000;279:E1104–E1113. - PubMed
    1. Boudina S., Bugger H., Sena S., O’Neill B.T., Zaha V.G., Ilkun O., Wright J.J., Mazumder P.K., Palfreyman E., Tidwell T.J. Contribution of impaired myocardial insulin signaling to mitochondrial dysfunction and oxidative stress in the heart. Circulation. 2009;119:1272–1283. - PMC - PubMed
    1. Boudina S., Sena S., O’Neill B.T., Tathireddy P., Young M.E., Abel E.D. Reduced mitochondrial oxidative capacity and increased mitochondrial uncoupling impair myocardial energetics in obesity. Circulation. 2005;112:2686–2695. - PubMed

LinkOut - more resources