. 2017 Sep;134(3):383-401.
doi: 10.1007/s00401-017-1744-4. Epub 2017 Jun 17.

Phenotypic and functional characterization of T cells in white matter lesions of multiple sclerosis patients

Affiliations

Phenotypic and functional characterization of T cells in white matter lesions of multiple sclerosis patients

Gijsbert P van Nierop et al. Acta Neuropathol. 2017 Sep.

Abstract

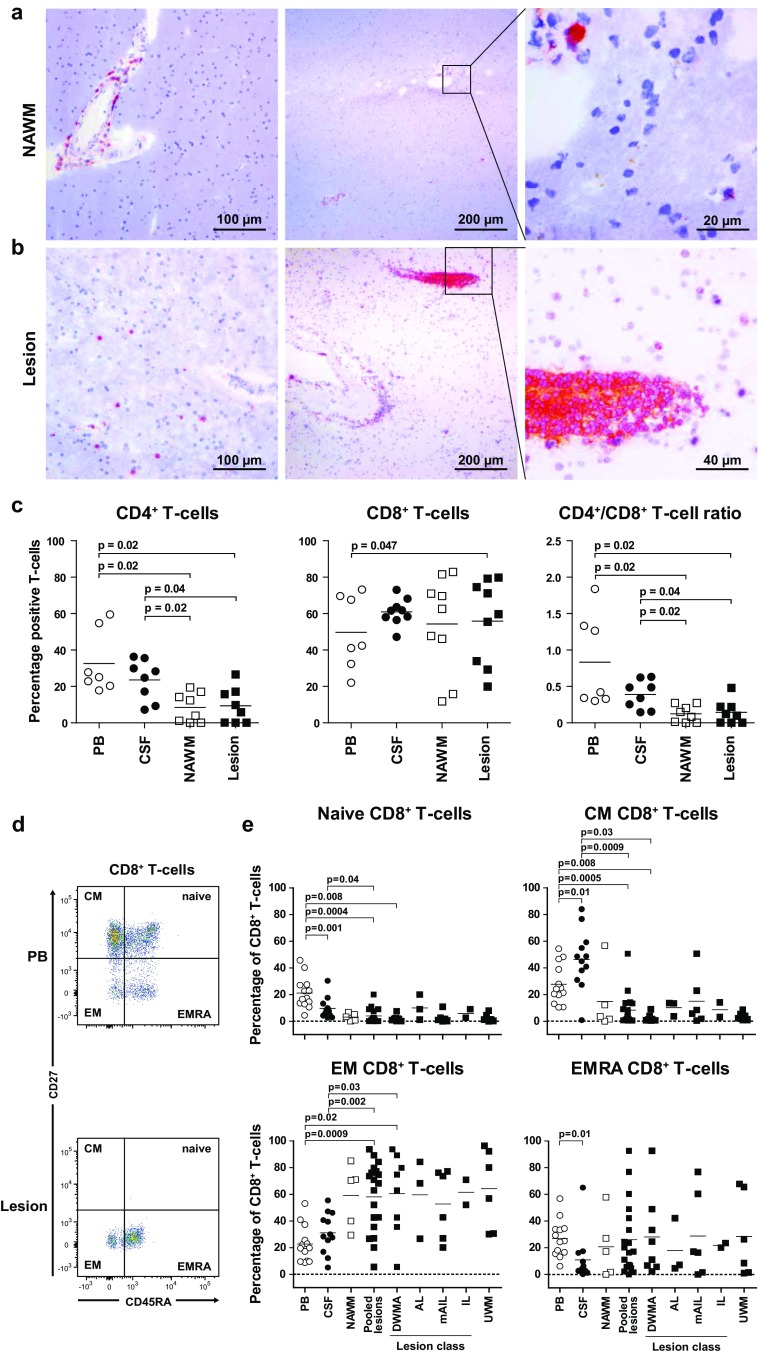
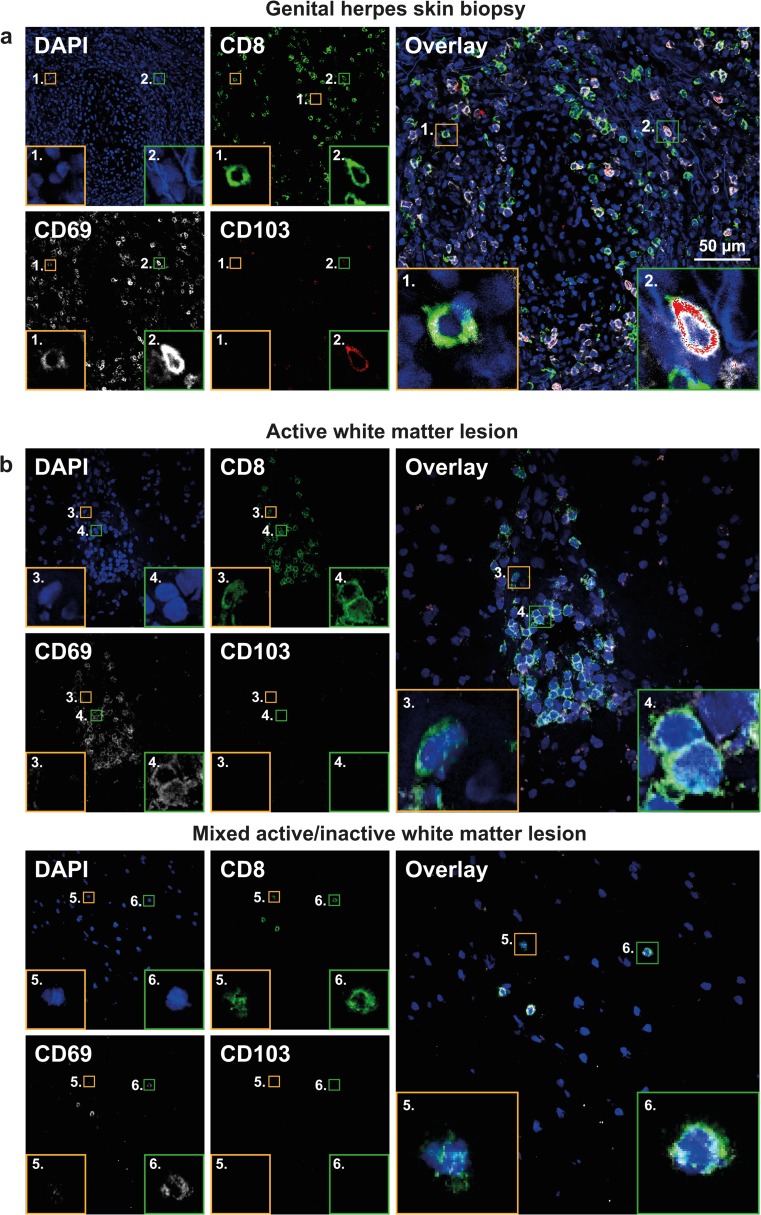
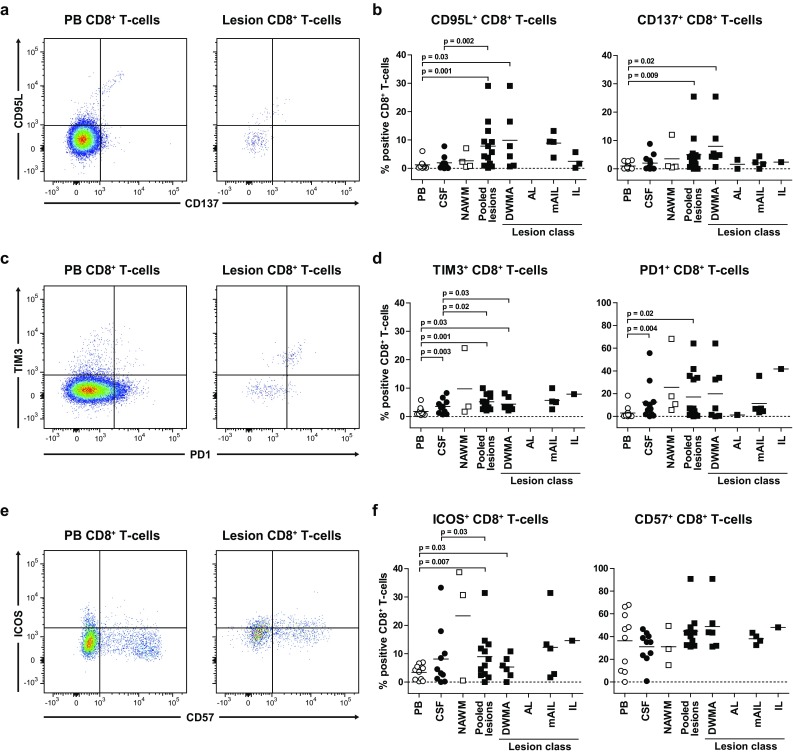
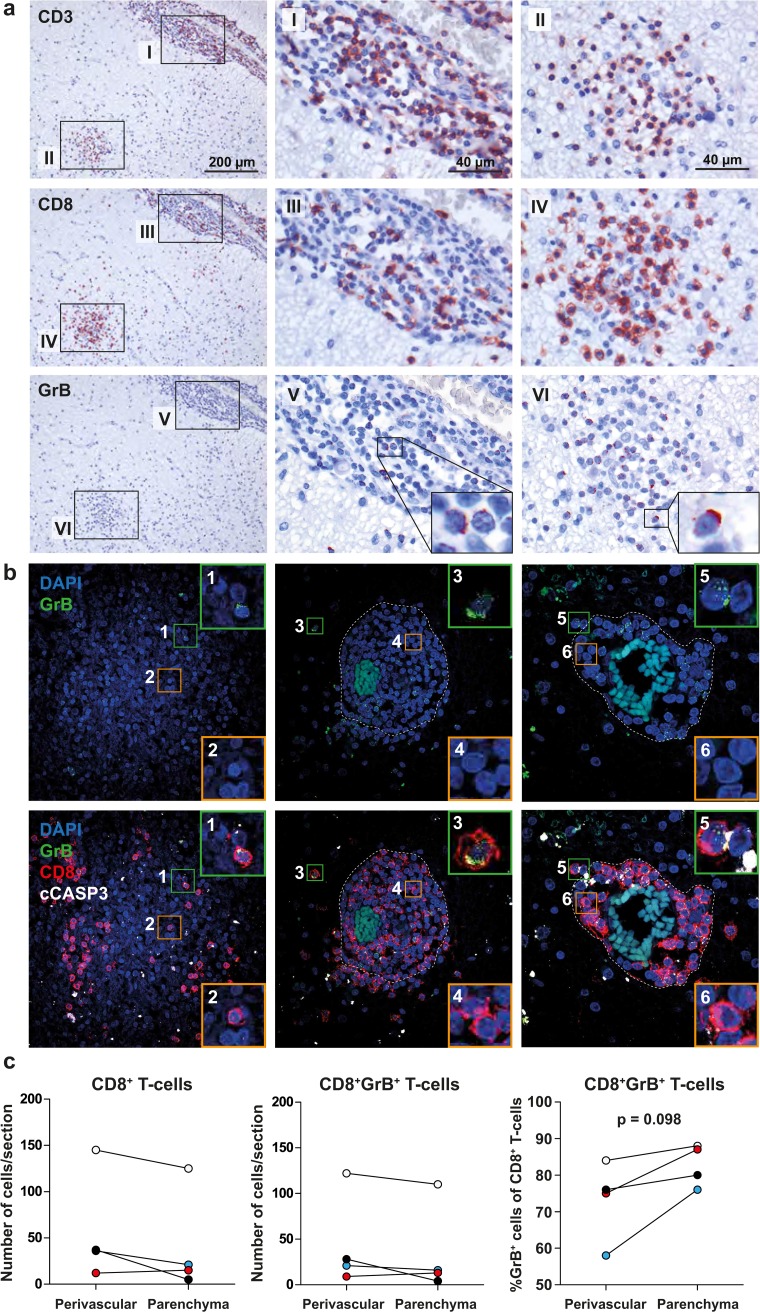
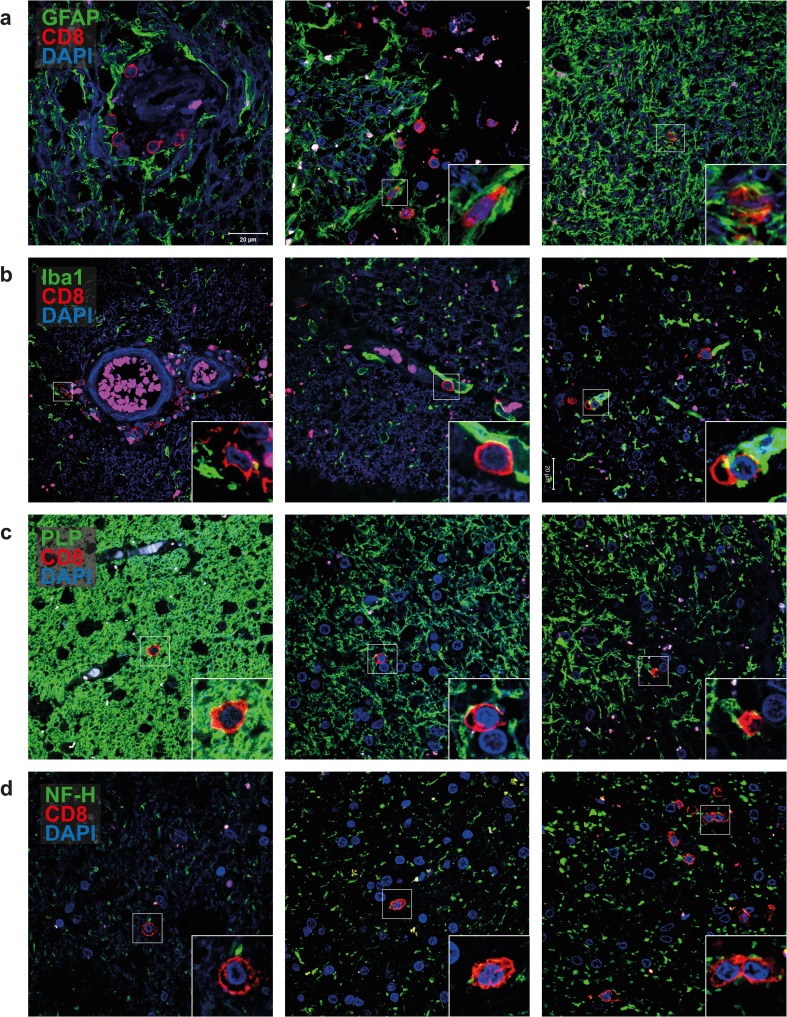
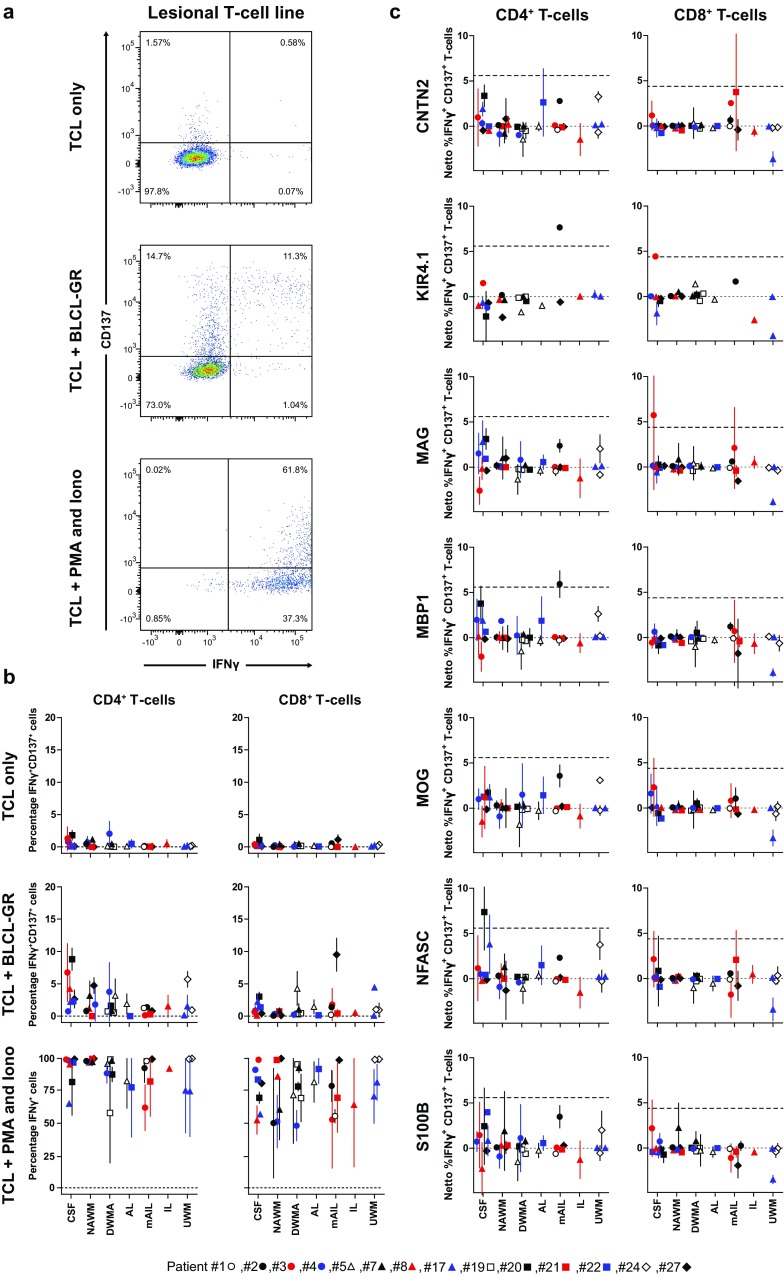
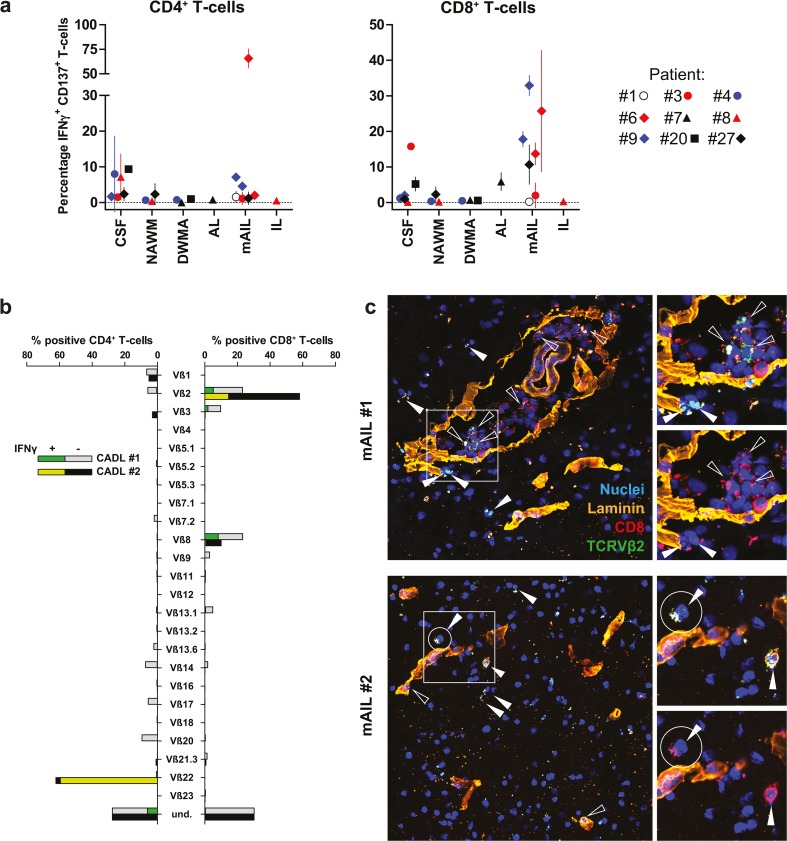
T cells are considered pivotal in the pathology of multiple sclerosis (MS), but their function and antigen specificity are unknown. To unravel the role of T cells in MS pathology, we performed a comprehensive analysis on T cells recovered from paired blood, cerebrospinal fluid (CSF), normal-appearing white matter (NAWM) and white matter lesions (WML) from 27 MS patients with advanced disease shortly after death. The differentiation status of T cells in these compartments was determined by ex vivo flow cytometry and immunohistochemistry. T-cell reactivity in short-term T-cell lines (TCL), generated by non-specific stimulation of T cells recovered from the same compartments, was determined by intracellular cytokine flow cytometry. Central memory T cells predominated in CSF and effector memory T cells were enriched in NAWM and WML. WML-derived CD8+ T cells represent chronically activated T cells expressing a cytotoxic effector phenotype (CD95L and granzyme B) indicative for local antigenic stimulation (CD137). The same lesions also contained higher CD8+ T-cell frequencies expressing co-inhibitory (TIM3 and PD1) and co-stimulatory (ICOS) T-cell receptors, yet no evidence for T-cell senescence (CD57) was observed. The oligoclonal T-cell receptor (TCR) repertoire, particularly among CD8+ T cells, correlated between TCL generated from anatomically separated WML of the same MS patient, but not between paired NAWM and WML. Whereas no substantial T-cell reactivity was detected towards seven candidate human MS-associated autoantigens (cMSAg), brisk CD8+ T-cell reactivity was detected in multiple WML-derived TCL towards autologous Epstein-Barr virus (EBV) infected B cells (autoBLCL). In one MS patient, the T-cell response towards autoBLCL in paired intra-lesional TCL was dominated by TCRVβ2+CD8+ T cells, which were localized in the parenchyma of the respective tissues expressing a polarized TCR and CD8 expression suggesting immunological synapse formation in situ. Collectively, the data suggest the involvement of effector memory cytotoxic T cells recognizing antigens expressed by autoBLCL, but not the assayed human cMSAg, in WML of MS patients.

Keywords: Autoantigens; CD8 T cells; Epstein–Barr virus; Multiple sclerosis; Pathogenesis.


Conflict of interest statement

The authors declare they have no conflict of interest.

Figures

Fig. 1
Fig. 1
CD8+ T cells in normal-appearing and diseased white matter tissues of MS patients preferentially express an effector memory phenotype. a, b Parenchymal T cells are selectively detected in active MS lesions. 10-µm cryostat sections of paired (a) normal-appearing white matter (NAWM) and (b) white matter lesion (WML) of two representative patients of five MS patients analyzed. CD3 expressing cells (T cells) were stained with 3-amino-9-ethylcarbazole (red color) and counterstained with hematoxylin (blue color). Whereas perivascular T cells were detected in both NAWM and WML, parenchymal T cells were exclusively detected in active WML of MS patients. c Percentages of CD4+ and CD8+ T cells, and CD4+/CD8+ T-cell ratio, are shown for paired PB (open circles), CSF (closed circles) and histologically defined as NAWM (open squares) and WML (filled squares). Lymphocytes were isolated from paired peripheral blood (PB), cerebrospinal fluid (CSF), NAWM and WML (lesion) from patients with advanced MS (n = 17) and subjected to multiplex flow cytometry. Gating procedure of CD4+ and CD8+ T cells is shown in Online Resource 3. d CD8+ T cells were subdivided in naïve (CD27+CD45RA+), central memory (CM; CD27+CD45RA), effector memory (EM; CD27CD45RA) and terminally differentiated effector memory (EMRA; CD27CD45RA+) T cells. Gating procedure is shown for representative paired PB and WML-derived CD8+ T cells. e The frequency of naïve, CM, EM and EMRA CD8+ T cells is shown for paired PB, CSF and white matter brain tissues that were immunohistologically classified as NAWM, diffuse white matter abnormalities (DWMA), active lesions (AL), mixed active/inactive lesions (mIAL), inactive lesion (IL) or unconfirmed white matter tissues (UWM) (see Online Resource 3 for criteria applied for MS WM classification). Horizontal lines represent the mean frequencies. Wilcoxon matched pairs test was used to calculate significance
Fig. 2
Fig. 2
CD8+ T cells in white matter lesions of MS patients preferentially express CD69, but not CD103. a, b Representative triple immunofluorescent stainings on 8-μm cryosections of a skin biopsies from six genital herpes patients and b immunohistochemically classified white matter lesions (WML) of six MS patients. Tissues were stained for CD8 (green color), CD69 (white color) and CD103 (red color) using specific monoclonal antibodies (mAbs) and isotype specific fluorochrome-conjugated secondary antibodies. Sections were counterstained with 4′,6-diamidino-2-phenylindole (DAPI; blue color) and analyzed using a Zeiss LSM-700 confocal laser microscopy and ZEN software. Skin biopsies of genital herpes patients were stained as positive control to validate staining strategy by confirming localization tissue-resident CD8+ T cells based on differential CD69 and CD103 staining: CD8+CD69+CD103 (a; inset 1) and CD8+CD69+CD103+ T cells (a; inset 2). b In WML of MS patients, perivascular (top panels) and parenchymal CD8+ T cells (bottom panels) were incidentally CD69CD103 T cells (b; insets 3 and 5) and predominantly CD69+CD103 T cells (b; insets 4 and 6). Size bar is indicated in top-right image
Fig. 3
Fig. 3
CD8+ T cells in white matter lesions of MS patients are chronically activated T cells expressing a cytotoxic effector T-cell phenotype. Flow cytometric analysis of cytotoxic molecule CD95L and co-stimulatory receptor CD137 (a, b), co-inhibitory receptors TIM3 and PD1 (c, d) and co-stimulatory molecule ICOS and senescence marker CD57 (e, f) expression on CD8+ T cells in paired peripheral blood (PB, open circles), cerebrospinal fluid (CSF, closed circles) and brain tissues histologically defined as normal-appearing white matter (NAWM, open squares) and white matter lesions (WML, filled squares) classified as diffuse white matter abnormalities (DWMA), active lesions (AL), mixed active/inactive lesions (mIAL) and inactive lesions (IL) of 17 MS patients (see Online Resource 3 for criteria applied for MS WM classification). Lymphocyte gating was performed as described in the legend of Online Resource 4. Gating strategies and percentages of marker positive CD8+ T cells in paired anatomic compartments are shown. If a parent population contained <100 events, daughter populations were omitted in further analysis. Horizontal lines indicate the mean. Wilcoxon matched pairs test was used to calculate significance
Fig. 4
Fig. 4
CD8+ T cells in white matter lesions of MS patients express granzyme B. a Representative stainings on 6-µm sections of a formalin-fixed and paraffin-embedded (FFPE) mixed active/inactive white matter lesion (mAIL) of one of four MS patients analyzed. CD3 (top panel), CD8 (middle panel) and granzyme B (grB) expressing cells (bottom panel) were stained with 3-amino-9-ethylcarbazole (red color) and counterstained with hematoxylin (blue color). Abundant punctate expression of grB was detected in perivascular (insets I, III and V) and parenchymal (insets II, IV and VI) CD8+ T cells. Granzyme B polarization was observed in both perivascular and parenchymal CD8+ T cells (insets V and VI). b Representative maximum intensity projections of z-stack laser confocal microscopy images of immunofluorescent triple stainings for grB (green color), CD8 (red color) and the early apoptotic cell marker “cleaved caspase-3” (cCASP3; white color). Stained sections were counterstained with DAPI (blue color). Representative stainings of three mAIL are shown of 12 immunohistochemically classified WML tissues of 10 MS patients analyzed. Punctated (inset 1) and polarized grB expression by CD8+ T cells (insets 3 and 5), as well as grB-negative CD8+ T cells are shown (insets 2, 4 and 6). Co-localization of grB and cCASP3 is observed in a cell adjacent to a CD8+ T-cell with polarized grB suggesting grB-mediated killing of the respective target cell (inset 5). Dotted line represents the glia limitans separating the perivascular space and parenchyma. c The grB-expressing CD8+ T cells were counted in the perivascular space and parenchyma of mAIL of four MS patients analyzed. Wilcoxon matched pairs test was used to calculate significance
Fig. 5
Fig. 5
CD8+ T cells interact with all major brain-resident cell types in white matter lesions of MS patients. Representative double-immunofluorescence stainings on 8-μm sections of 12 formalin-fixed paraffin-embedded white matter lesion (WML) tissues from 10 MS patients are shown for a glial fibrillary acidic protein (GFAP: marker for astrocytes); b ionized calcium-binding adapter molecule 1 (Iba1: marker for microglia); c proteolipid protein (PLP: marker for oligodendrocytes) and d neurofilament heavy chain (NF-H: marker for neurons; all green color) combined with CD8 (red color), counterstained with 4′,6-diamidino-2-phenylindole (DAPI; blue color) and finally analyzed using a Zeiss LSM-700 confocal laser microscopy and ZEN software. Perivascular CD8+ T cells interact with astrocytes (a left and middle panel) and microglia (b left and middle panel). Parenchymal CD8+ T cells also interact with astrocytes (a right panel), microglia (b right panel) and oligodendrocytes (c) in fully myelinated (left panel) and partially demyelinated areas (middle and right panels). Parenchymal CD8+ T cells also interact with neurons (d) in areas without (left panel), with moderate (middle panel) and with prominent axonal swelling (right panel). The latter is indicative of axonal damage. Insets show specific interactions between CD8+ T cells and the major brain-resident cells analyzed for. Scale bar is indicated (a, top left panel)
Fig. 6
Fig. 6
T-cell lines generated from paired cerebrospinal fluid and white matter brain tissue of MS patients show no substantial T-cell reactivity towards candidate human MS-associated autoantigens. Short-term T-cell lines (TCL) were generated by non-specific stimulation of T cells recovered from paired cerebrospinal fluid (CSF) and white matter brain tissues from 14 MS patients, which were immunohistologically classified as normal-appearing white matter (NAWM), diffuse white matter abnormalities (DWMA), active lesions (AL), mixed active/inactive lesions (mAIL), inactive lesions (IL) or undefined white matter tissue (UWM) (see Online Resource 3 for criteria applied for MS WM classification). An HLA-matched Epstein–Barr virus-transformed B-cell line (i.e., BLCL-GR) was used to assay T-cell reactivity towards candidate human MS-associated autoantigens (cMSAg). a Antigen-specific T cells were enumerated by determining co-expression of intracellular interferon gamma (IFNγ) and CD137 using multiplex flow cytometry. Gated CD8+ T cells from mAIL-derived TCL of MS patient #27 (see Online Resource 1) is representatively shown. CD8+ T cells alone (top panel), stimulated with untransduced BLCL-GR (middle panel) or with phorbol myristate-acetate (PMA) and ionomycin (Iono) are shown. b The frequency of IFNγ and CD137 co-expressing CD4+ (left panel) and CD8+ T cells (right panels) that were cultured alone (top panels) or co-cultured with untransduced BLCL-GR (middle panels) are shown. The bottom panel shows the frequency of IFNγ-expressing CD4+ (left panel) and CD8+ T cells (right panel) after stimulation with a cocktail of T-cell mitogens (i.e., PMA and Iono). c BLCL-GR were nucleofected with human candidate MS autoantigens (cMSAg) expression vectors encoding human contactin-2 (CNTN2), inwards rectifying potassium channel (KIR4.1), myelin-associated glycoprotein (MAG), myelin basic protein isoform 1 (MBP1), myelin oligodendrocyte glycoprotein (MOG), neurofascin (NFASC) or S100 calcium-binding protein B (S100B). TCL were co-cultured with the respective cMSAg-expressing BLCL-GR and the phenotype and frequency of cMSAg-specific T cells determined by flow cytometry. The netto frequency of cMSAg-specific T cells, corrected for reactivity towards untransduced BLCL-GR, is shown as the percentage IFNγ+CD137+ CD4+ (left panel) and CD8+ T cells (right panel). Symbols represent the individual MS patients analyzed (n = 14; specified at the bottom of the figure). The majority of TCL were assayed at least two times, of which vertical lines represent the mean and standard deviation. Horizontal dashed lines depict the cut-off for positive calls for CD4+ and CD8+ T cells, allowing a 0.1% false discovery. Significance of variation in cMSAg-specific T-cell reactivity was determined by ANOVA for CD4+ and CD8+ T cells separately
Fig. 7
Fig. 7
White matter lesion-derived CD8+ T cells recognize autologous Epstein–Barr virus-transformed B cells and localize in the parenchyma to form immune synapses. a Short-term T-cell lines (TCL) were generated by non-specific stimulation of T-cell recovered from paired cerebrospinal fluid (CSF) and white matter brain tissues from nine MS patients, which were immunohistologically classified defined as normal-appearing white matter (NAWM), diffuse white matter abnormalities (DWMA), active lesions (AL), mixed active/inactive lesions (mAIL) and inactive lesions (IL) (see Online Resource 3 for criteria applied for MS WM classification). The TCL were incubated with autologous Epstein–Barr virus-transformed B cell lines (autoBLCL). Next, the phenotype and frequency of autoBLCL-specific T cells was determined by co-expression of intracellular interferon gamma (IFNγ) and CD137 using multiplex flow cytometry. The frequency of autoBLCL-reactive T cells is shown as the percentage of IFNγ+CD137+ CD4+ (left panel) and CD8+ T cells (right panel). Symbols represent individual donors (n = 9; specified in the legend) and vertical lines represent the mean and standard deviation of at least two independent experiments per TCL. Significance of variation in autoBLCL T-cell reactivity was determined by ANOVA for CD4+ and CD8+ T cells separately. b TCL generated from two anatomically distinct mAIL of MS patient #6 (see Online Resource 1) were cultured with autoBLCL to assay the T-cell receptor variable β chain (TCRVβ) usage of the reactive T cells, determined by intracellular interferon gamma (IFNγ) expression, using multiplex flow cytometry. The frequency of CD4+ (left x-axis) and CD8+ T cells (right x-axis) of specific TCRVβ families (y-axis) are depicted (gray bars lesion #1, black bars lesion #2). The frequency of autoBLCL-reactive CD4+ T cells and CD8+ T cells of each TCRVβ family is shown (stacked green bars IFNγ+ T cells). Results shown are representative for two independent experiments. “Und.” refers to T cells expressing a TCRVβ chain not covered by the TCRVβ-family-specific monoclonal antibody panel used. c Triple immunofluorescence staining for TCRVβ2 (green color), laminin (orange color) and CD8 (red color) in surplus WML tissue sections (8 µm) containing WML #1 and #2, from which the corresponding TCLs shown in panel “A” were generated. Nuclei were stained with DAPI (blue color). TCRVβ2+ CD8+ T cells reside in the perivascular cuff (open arrowhead) and the parenchyma (closed arrowhead) of both distinct WML of the same patient. The majority of parenchymal T cells show polarization of both CD8 and TCRVβ2 (encircled cells in top-right insets). Images of representative stainings are shown

References

    1. Adhikary D, Behrends U, Boerschmann H, Pfünder A, Burdach S, Moosmann A, Witter K, Bornkamm GW, Mautner J. Immunodominance of lytic cycle antigens in Epstein–Barr virus-specific CD4+ T cell preparations for therapy. PLoS One. 2007;2:e583. doi: 10.1371/journal.pone.0000583. - DOI - PMC - PubMed
    1. Angelini DF, Serafini B, Piras E, Severa M, Coccia EM, Rosicarelli B, Ruggieri S, Gasperini C, Buttari F, Centonze D, Mechelli R, Salvetti M, Borsellino G, Aloisi F, Battistini L. Increased CD8+ T cell response to Epstein–Barr virus lytic antigens in the active phase of multiple sclerosis. PLoS Pathog. 2013;9:e1003220. doi: 10.1371/journal.ppat.1003220. - DOI - PMC - PubMed
    1. Annibali V, Ristori G, Angelini DF, Serafini B, Mechelli R, Cannoni S, Romano S, Paolillo A, Abderrahim H, Diamantini A, Borsellino G, Aloisi F, Battistini L, Salvetti M. CD161highCD8+ T cells bear pathogenetic potential in multiple sclerosis. Brain. 2011;134:542–554. doi: 10.1093/brain/awq354. - DOI - PubMed
    1. Ascherio A, Munger KL. Epstein–Barr virus infection and multiple sclerosis: a review. J Neuroimmune Pharmacol. 2010;5:271–277. doi: 10.1007/s11481-010-9201-3. - DOI - PubMed
    1. Babbe H, Roers A, Waisman A, Lassmann H, Goebels N, Hohlfeld R, Friese M, Schröder R, Deckert M, Schmidt S, Ravid R, Rajewsky K. Clonal expansions of CD8+ T cells dominate the T cell infiltrate in active multiple sclerosis lesions as shown by micromanipulation and single cell polymerase chain reaction. J Exp Med. 2000;192:393–404. doi: 10.1084/jem.192.3.393. - DOI - PMC - PubMed