

In Vivo PET Imaging of the Activated Immune Environment in a Small Animal Model of Inflammatory Arthritis
- PMID: 28625080
- PMCID: PMC5480631
- DOI: 10.1177/1536012117712638
In Vivo PET Imaging of the Activated Immune Environment in a Small Animal Model of Inflammatory Arthritis
Abstract
Background: Evolving immune-mediated therapeutic strategies for rheumatoid arthritis (RA) may benefit from an improved understanding of the complex role that T-cell activation plays in RA. This study assessed the potential of fluorine-18-labeled 9-β-d-arabinofuranosylguanine ([18F]F-AraG) positron emission tomography (PET) imaging to report immune activation in vivo in an adjuvant-induced arthritis (AIA) small animal model.
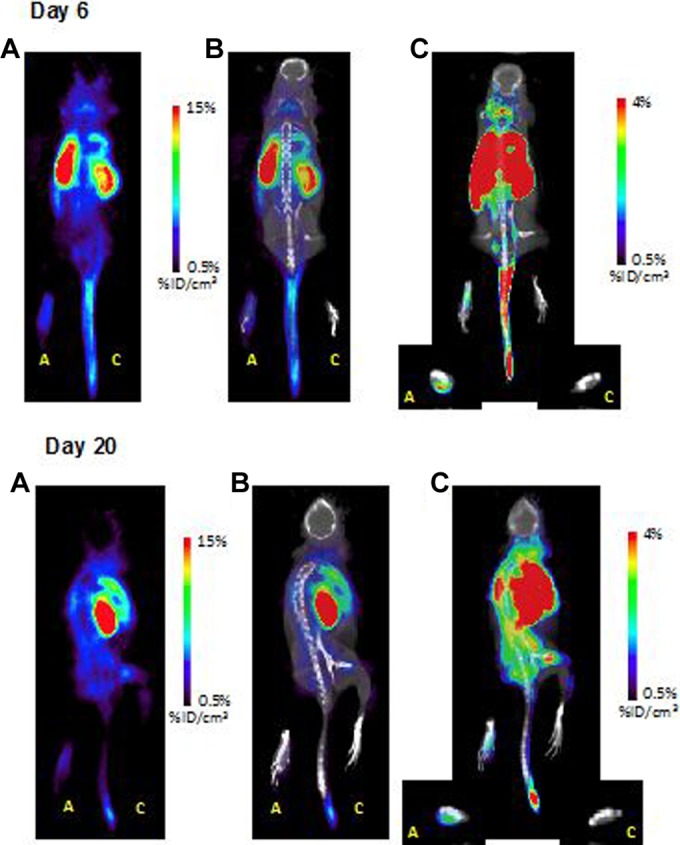
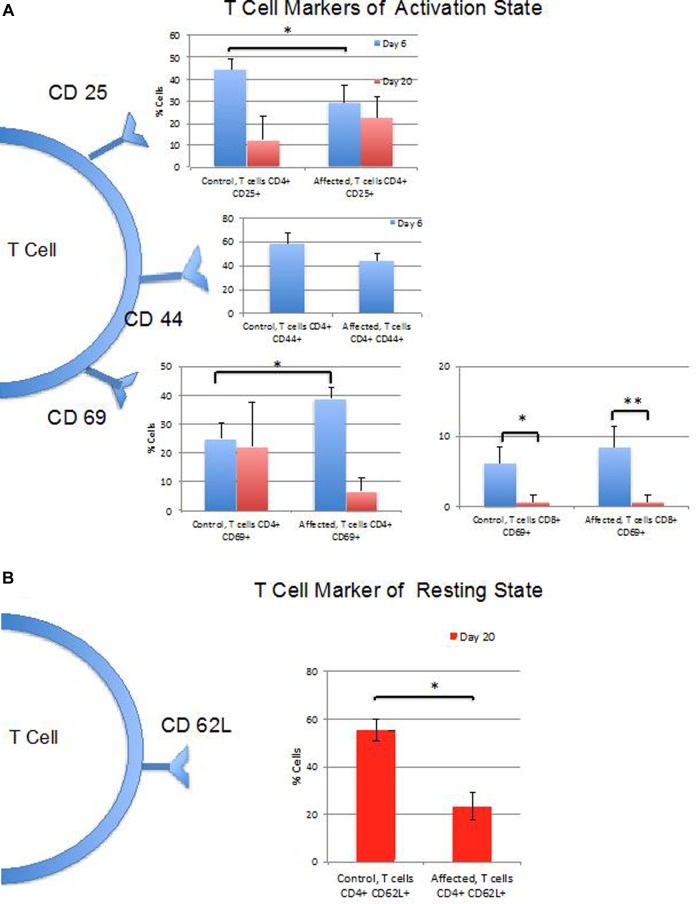
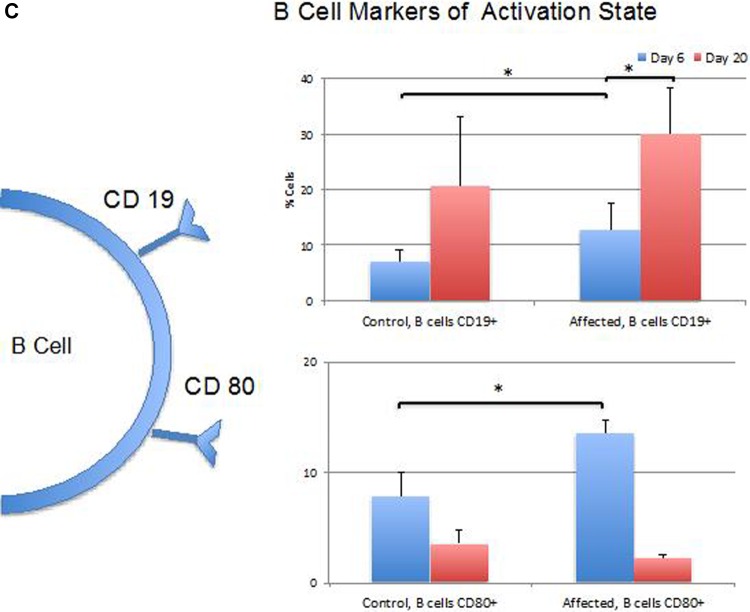
Methods: Using positron emission tomography-computed tomography imaging, uptake of [18F]F-AraG in the paws of mice affected by arthritis at 6 (acute) and 20 (chronic) days following AIA induction in a single paw was assessed and compared to uptake in contralateral control paws. Fractions of T cells and B cells demonstrating markers of activation at the 2 time points were determined by flow cytometry.
Results: Differential uptake of [18F]F-AraG was demonstrated on imaging of the affected joint when compared to control at both acute and chronic time points with corresponding changes in markers of T-cell activation observed on flow cytometry.
Conclusion: [18F]F-AraG may serve as an imaging biomarker of T-cell activation in inflammatory arthritis. Further development of this technique is warranted and could offer a tool to explore the temporal link between activated T cells and RA as well as to monitor immune-mediated therapies for RA in clinical trials.
Keywords: animal models of disease; molecular imaging of inflammation.
Conflict of interest statement
Figures


Similar articles
-
A Feasibility Study of [18F]F-AraG Positron Emission Tomography (PET) for Cardiac Imaging-Myocardial Viability in Ischemia-Reperfusion Injury Model.Mol Imaging Biol. 2024 Oct;26(5):869-878. doi: 10.1007/s11307-024-01932-y. Epub 2024 Jul 26. Mol Imaging Biol. 2024. PMID: 39060882
-
Synthesis of 2'-deoxy-2'-[18F]fluoro-9-β-D-arabinofuranosylguanine: a novel agent for imaging T-cell activation with PET.Mol Imaging Biol. 2011 Oct;13(5):812-8. doi: 10.1007/s11307-010-0414-x. Mol Imaging Biol. 2011. PMID: 20838911
-
[(18)]F FDG PET/CT imaging to monitor the therapeutic effect of liposome-encapsulated prednisolone in experimental rheumatoid arthritis.J Control Release. 2015 Jul 10;209:20-6. doi: 10.1016/j.jconrel.2015.04.019. Epub 2015 Apr 19. J Control Release. 2015. PMID: 25902038
-
Positron emission tomography/computed tomography imaging and rheumatoid arthritis.Int J Rheum Dis. 2014 Mar;17(3):248-55. doi: 10.1111/1756-185X.12316. Epub 2014 Mar 10. Int J Rheum Dis. 2014. PMID: 24606324 Review.
-
FDG PET for rheumatoid arthritis: basic considerations and whole-body PET/CT.Ann N Y Acad Sci. 2011 Jun;1228:29-38. doi: 10.1111/j.1749-6632.2011.06031.x. Ann N Y Acad Sci. 2011. PMID: 21718320 Review.
Cited by
-
Longitudinal Imaging of T Cells and Inflammatory Demyelination in a Preclinical Model of Multiple Sclerosis Using 18F-FAraG PET and MRI.J Nucl Med. 2022 Jan;63(1):140-146. doi: 10.2967/jnumed.120.259325. Epub 2021 Apr 9. J Nucl Med. 2022. PMID: 33837066 Free PMC article.
-
Imaging activated T cells predicts response to cancer vaccines.J Clin Invest. 2018 Jun 1;128(6):2569-2580. doi: 10.1172/JCI98509. Epub 2018 May 14. J Clin Invest. 2018. PMID: 29596062 Free PMC article.
-
Biodistribution of a Mitochondrial Metabolic Tracer, [18F]F-AraG, in Healthy Volunteers.Mol Imaging. 2022 Aug 8;2022:3667417. doi: 10.1155/2022/3667417. eCollection 2022. Mol Imaging. 2022. PMID: 36072652 Free PMC article.
-
Simplified and accessible [18 F]F-AraG synthesis procedure for preclinical PET.J Labelled Comp Radiopharm. 2022 Aug;65(10-11):288-291. doi: 10.1002/jlcr.3997. Epub 2022 Aug 23. J Labelled Comp Radiopharm. 2022. PMID: 35980801 Free PMC article.
-
Noninvasive Imaging OX40+ Activated T Cells Provides Early Warning of Rheumatoid Arthritis.Mol Imaging Biol. 2023 Aug;25(4):621-629. doi: 10.1007/s11307-023-01819-4. Epub 2023 Apr 3. Mol Imaging Biol. 2023. PMID: 37012517 Free PMC article.
References
-
- Ostrov BE. Immunotherapeutic biologic agents in autoimmune and autoinflammatory diseases. Immunol invest. 2015;44(8):777–802. - PubMed
-
- Ren CF, Zhao YX, Hou CF, et al. Expression of soluble programmed death-1 protein in peripheral blood regulatory T cells and its effects on rheumatoid arthritis progression. Mol Med Rep. 2017;15(1):460–466. - PubMed
Publication types
MeSH terms
LinkOut - more resources
Full Text Sources
Other Literature Sources
Medical
