

Ultra-processed foods and added sugars in the Chilean diet (2010)
- PMID: 28625223
- PMCID: PMC10260868
- DOI: 10.1017/S1368980017001161
Ultra-processed foods and added sugars in the Chilean diet (2010)
Abstract
Objective: To assess the consumption of ultra-processed foods and analyse its association with the content of added sugars in the Chilean diet.
Design: Cross-sectional study of national dietary data obtained through 24 h recalls and classified into food groups according to the extent and purpose of food processing (NOVA classification).
Setting: Chile.
Subjects: A probabilistic sample of 4920 individuals (aged 2 years or above) studied in 2010 by a national dietary survey (Encuesta Nacional de Consumo Alimentario).
Results: Ultra-processed foods represented 28·6 (se 0·5) % of total energy intake and 58·6 (se 0·9) % of added sugars intake. The mean percentage of energy from added sugars increased from 7·7 (se 0·3) to 19·7 (se 0·5) % across quintiles of the dietary share of ultra-processed foods. After adjusting for several potential sociodemographic confounders, a 5 percentage point increase in the dietary share of ultra-processed foods determined a 1 percentage point increase in the dietary content of added sugars. Individuals in the highest quintile were three times more likely (OR=2·9; 95 % CI 2·4, 3·4) to exceed the 10 % upper limit for added sugars recommended by the WHO compared with those in the lowest quintile, after adjusting for sociodemographic variables. This association was strongest among individuals aged 2-19 years (OR=3·9; 95 % CI 2·7, 5·9).
Conclusions: In Chile, ultra-processed foods are important contributors to total energy intake and to the consumption of added sugars. Actions aimed at limiting consumption of ultra-processed foods are being implemented as effective ways to achieve WHO dietary recommendations to limit added sugars and processed foods, especially for children and adolescents.
Keywords: Added sugars; Chile; Energy intake; Food processing; Ultra-processed foods.
Figures
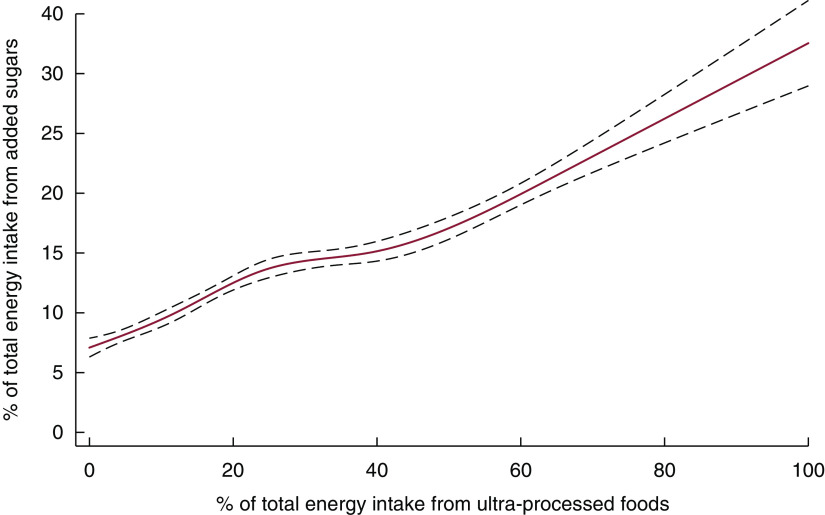
 , predicted value;
  , 95 % CI). *National Nutrition Examination Survey 2010, n 4920
References
-
- Monteiro CA, Moubarac J-C, Cannon G et al.. (2013) Ultra-processed products are becoming dominant in the global food system. Obes Rev 14, 21–28. - PubMed
-
- Monteiro CA, Cannon G, Levy R et al.. (2016) NOVA. The star shines bright. World Nutr 7, 1–3, 28–38.
-
- Moubarac J-C, Batal M, Louzada ML et al.. (2017) Consumption of ultra-processed foods predicts diet quality in Canada. Appetite 108, 512–520. - PubMed
MeSH terms
Substances
LinkOut - more resources
Full Text Sources
Other Literature Sources
