. 2017 Jul 6;67(1):71-83.e7.
doi: 10.1016/j.molcel.2017.05.021. Epub 2017 Jun 15.

Heterogeneous Ribosomes Preferentially Translate Distinct Subpools of mRNAs Genome-wide

Affiliations

Heterogeneous Ribosomes Preferentially Translate Distinct Subpools of mRNAs Genome-wide

Zhen Shi et al. Mol Cell. .

Abstract

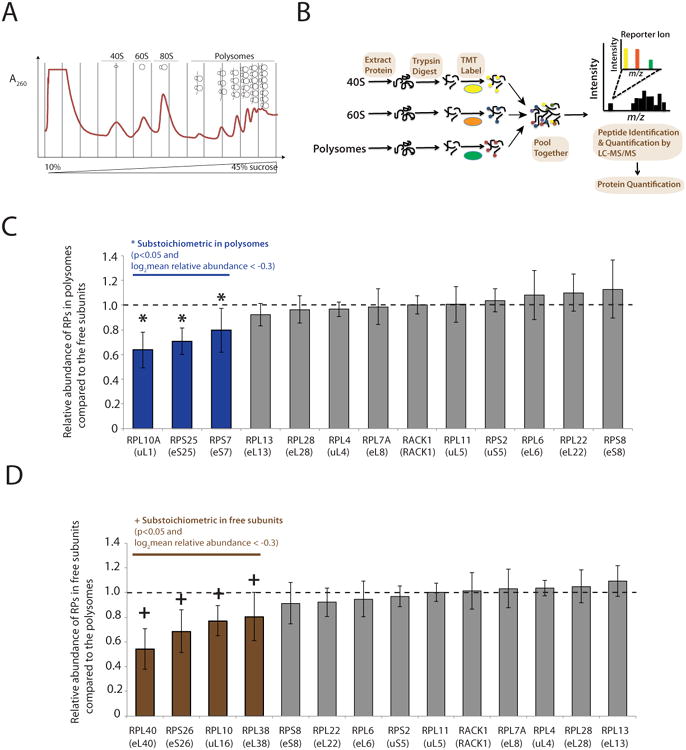
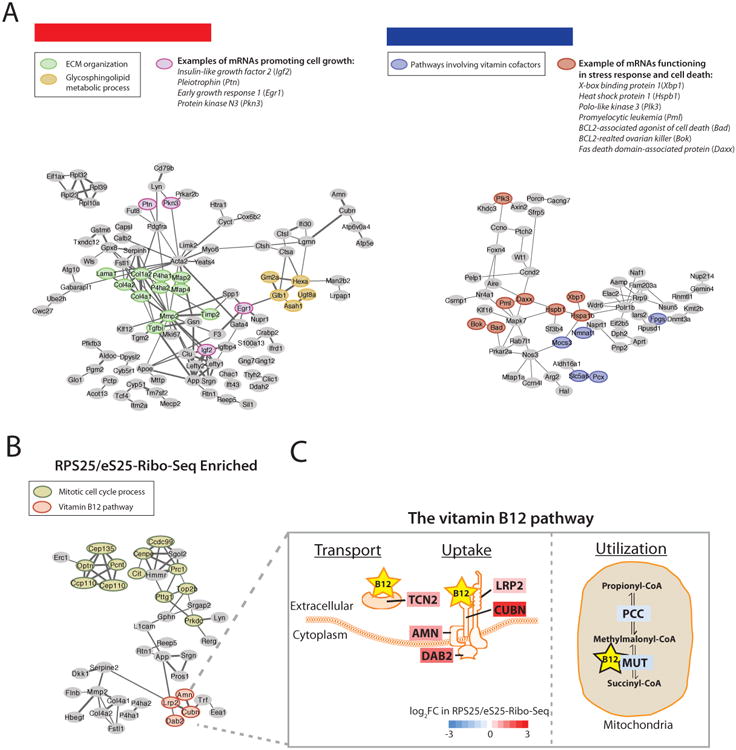
Emerging studies have linked the ribosome to more selective control of gene regulation. However, an outstanding question is whether ribosome heterogeneity at the level of core ribosomal proteins (RPs) exists and enables ribosomes to preferentially translate specific mRNAs genome-wide. Here, we measured the absolute abundance of RPs in translating ribosomes and profiled transcripts that are enriched or depleted from select subsets of ribosomes within embryonic stem cells. We find that heterogeneity in RP composition endows ribosomes with differential selectivity for translating subpools of transcripts, including those controlling metabolism, cell cycle, and development. As an example, mRNAs enriched in binding to RPL10A/uL1-containing ribosomes are shown to require RPL10A/uL1 for their efficient translation. Within several of these transcripts, this level of regulation is mediated, at least in part, by internal ribosome entry sites. Together, these results reveal a critical functional link between ribosome heterogeneity and the post-transcriptional circuitry of gene expression.

Keywords: 5′ UTR regulatory elements; IRES elements; SRM; gene regulation; internal ribosome entry site elements; ribosome heterogeneity; selected reaction monitoring; translational control.


Figures

Figure 1
Figure 1. Absolute quantification of RP stoichiometry reveals heterogeneous populations of actively translating ribosomes within mESCs
(A) Schematic of the absolute quantification of RP abundance by Selected Reaction Monitoring (SRM). LC-ESI: liquid chromatography-electrospray ionization. (B) Stoichiometry of RPs quantified by SRM in polysomes isolated from sucrose gradient fractionation. The mean and standard deviation (SD) of quantifications from five biological replicates are shown. **: p<0.05 (t-test) and stoichiometry<0.8 (an arbitrary cutoff, marked as a dotted line). *: p<0.05 (t-test) and stoichiometry<1. (C) Left: formaldehyde cross-linking of RPs and rRNAs to avoid the possibility of any RP loss during the polysome fractionation. Right: Western Blot showing the amount of EIF3B, EIF3D, EIF3H, as well as RPS5/uS7 and RPL31/eL31 in purified polysome samples with and without formaldehyde cross-linking. EIF3B, EIF3D and EIF3H belonging to the eIF3 initiation complex are much more tightly associated with the translating ribosomes upon formaldehyde cross-linking. RPS5/uS7 and RPL31/eL31 are controls for loading. (D) Stoichiometry of RPs quantified by SRM in polysomes with formaldehyde cross-linking. The mean and SD of quantifications from three biological replicates are shown. **: p<0.05 (t-test) and stoichiometry<0.8 (an arbitrary cutoff, marked as a dotted line). (B) and (D): One to three peptides per protein were quantified, and the median value of the peptides for the same protein was used to represent its abundance. The stoichiometry of each RP was determined by normalizing its absolute quantification value to the average of RPL6/eL6 and RPL7A/eL8 for large subunit proteins or the average of RPS2/uS5 and RPS8/eS8 for small subunit proteins, which are shown as dotted bars. The quantification for large subunit proteins is shown in light orange and small subunit proteins is shown in light green. (E) Substoichiometric RPs are color-coded with blue, shown on a structural model of the human ribosome with all other RPs in light grey (Anger et al., 2013) (PDB files 4V6X). The 28S, 5S and 5.8S rRNAs are shown in light orange, and 18S rRNA is shown in light green. An enlarged view of the mRNA exit tunnel is shown on the right panel, with rRNAs removed for simplicity. See also Figure S1, Movie S1M and Table S1.
Figure 2
Figure 2. The relative quantification of RPs reveals differences in RP abundance between the free subunits and translationally active ribosomes
(A) Separating cytoplasmic ribosomes into distinct functional classes through a 10-45% sucrose gradient fractionation. (B) Schematic of the workflow for quantifying ribosome composition by quantitative mass spectrometry using tandem mass tag (TMT). Purified ribosomes from 40S, 60S, and polysomes were digested into peptides, labeled with a distinct TMT, mixed equally, and subjected to MS/MS analysis for multiplex quantification. (C) Shown are the relative abundance of RPs in polysomes compared to their levels in the 40S or 60S free subunits. The mean and standard deviation (SD) from seven biological replicates are shown. *: Three RPs (blue) are substoichiometric in polysomes: p<0.05 (t-test) and at least 20% lower relative abundance in polysomes (log2mean relative abundance < -0.3). Several representative RPs exhibiting nearly the same abundance are also displayed in grey. (D) Shown are the relative abundance of RPs in the 40S or 60S free subunits compared to their levels in the polysomes. The mean and SD from seven biological replicates are shown. +: Four RPs (brown) are substoichiometric in the free subunits: p<0.05 (t-test) and at least 20% lower relative abundance in the free subunits (log2mean relative abundance < -0.3). Several representative RPs exhibiting nearly the same abundance are also displayed in grey. See also Table S2.
Figure 3
Figure 3. Ribosomes with specific RP compositions selectively translate distinct subpools of mRNAs
(A) Schematic of immunoprecipitation (IP) and subsequent ribosome profiling of endogenously tagged RPS25/eS25- (left) or RPL10A/uL1- (right) containing ribosomes. Ribosome profiling (Ribo-Seq) of total ribosomes was performed in parallel as a control. (B) Upper: Comparison of RPS25/eS25-Ribo-Seq to the total Ribo-Seq. The densities of ribosome footprints on each protein-coding gene are calculated as Reads Per Kilobase per Million mapped reads (RPKM). The average RPKM of two biological replicates are shown. Lower: Compared to the total RiboSeq, genes having log2FC>0.75 or log2FC <-0.75 (FC: fold change) with FDR<0.05 in the RPS25/eS25-Ribo-Seq are defined as enriched (red) or depleted (blue) respectively. The numbers of genes in each category (enriched, no difference, depleted) were shown in the parentheses. (C) Comparison of RPL10A/uL1-Ribo-Seq to the total Ribo-Seq as in (B). (D) Comparison of RPL22/eL22-Ribo-Seq to the total Ribo-Seq as in (B). (E) Significantly enriched GO (Gene Ontology) categories (padj<0.05) among transcripts that are depleted or enriched in RPS25/eS25-Ribo-Seq (left) or RPL10A/uL1-Ribo-Seq (right). Enriched GO categories (padj<0.05) analyzed using the Manteia tool (Tassy and Pourquié, 2014) are rank-ordered by the number of associated genes, and the top five GO categories are shown. The number of associated genes in each GO category is shown in parentheses. See also Figure S2, Figure S3, Table S3 and Table S4.
Figure 4
Figure 4. Coordinated translational regulation of genes with related biological functions by specialized ribosomes
(A) Network-based cluster analysis of RPL10A/uL1-Ribo-Seq enriched or depleted genes and their associated functional classes. (Left): Nodes highlighted represent genes acting in extracellular matrix (ECM) organization (an enriched GO category), glycosphingolipid metabolic process (an enriched GO category), and promoting cell growth or implicated in cancer metastasis. (Right): Nodes highlighted represent genes acting in pathways involving vitamin cofactors (an enriched GO category), and stress response or cell death. (B, C) Coordinated translation by ribosomes demarcated by RPS25/eS25. (B) Network-based cluster analysis of RPS25/eS25-Ribo-Seq enriched genes and associated functional classes. Nodes highlighted represent genes acting in mitotic cell cycle process (an enriched GO category) and vitamin B12 pathway (an enriched GO category). (C) Almost every component involved in the transport, uptake and utilization of vitamin B12 is selectively translated by specific ribosomes demarcated by RPS25/eS25. Each component is color-coded by the log2FC in RPS25/eS25-Ribo-Seq. The vitamin B12 transporter (transcobalamin 2 (Tcn2)) and absorption complex of vitamin B12 at the cell surface (amnionless (Amn), cubilin (Cubn), low density lipoprotein receptor-related protein 2 (Lrp2) and disabled 2 (Dab2)) are all enriched in the RPS25/eS25-Ribo-Seq, highlighted in red. In contrast, the B12-dependent enzyme methylmalonyl-Coenzyme A mutase (Mut), as well as the enzyme propionyl-Coenzyme A carboxylase (PCC) acting in the immediate upstream pathway in mitochondria are depleted in the RPS25/eS25-Ribo-Seq, highlighted in blue.
Figure 5
Figure 5. The mRNAs preferentially translated by RPL10A/uL1-containing ribosomes are overall more sensitized to RPL10A/uL1 expression levels
(A) Several mRNAs comprising randomly chosen examples from the RPL10A/uL1-Ribo-Seq enriched, neutral and depleted sets of mRNAs were assayed for their relative distributions in sucrose gradient fractionations by RT-qPCR. The shift from the most actively translating polysomes (medium and heavy polysomes in fraction III) to lighter fractions upon Rpl10a/uL1 knockdown by siRNA was observed in the RPL10A/uL1-Ribo-Seq enriched mRNAs (upper), but not in the neutral or RPL10A/uL1-Ribo-Seq depleted (bottom) set of mRNAs. The mean and standard deviation (SD) from three biological replicates are shown. *: p<0.05 (t-test), NS: not significant (t-test). (B) Left: RNAs subject to RNA-Seq analysis were purified from sucrose gradient combining the medium and heavy polysome fractions (≥4 ribosomes along a mRNA molecule), and from all other fractions containing the free RNPs, 40S/60S ribosomal free subunits, 80S/monosome as well as light polysomes (2-3 ribosomes on a mRNA molecule). The amount of mRNAs in the combined medium and heavy polysome fractions was compared to all other fractions as an analogy of their translation activities. Right: Shown are cumulative distributions of mRNAs translation activities, upon Rpl10a/uL1 siRNA knockdown normalized to the control siRNA. Two biological replicates were performed and the averaged results were shown. RPL10A/uL1-Ribo-Seq enriched transcripts (red) overall have lowered translation activities upon knockdown of Rpl10a/uL1, in compared to the neutral (grey) (p=0.0055, Wilcoxon rank-sum test) or RPL10A/uL1-Ribo-Seq depleted set of transcripts (blue) (p=0.0043, Wilcoxon rank-sum test), revealed by the leftward shift in the cumulative distribution curve. See also Figure S4 and Figure S5.
Figure 6
Figure 6. RPL10A/uL1 can Regulate mRNA Translation through IRES Elements
(A) RPL10A/uL1 (blue) but not RPL29/eL29 (green) can make direct contact with the IRES element (purple) in Cricket Paralysis Virus (CrPV). The model is adapted from a recent structural study (Fernández et al., 2014). The ribo somal large subunit (60S) is at top and small subunit (40S) at bottom. The 28S, 5S and 5.8S rRNAs are shown in light orange and 18S rRNA in light green. (B) Left: Drosophila S2 cells were transfected with double stranded RNA (dsRNA) targeting RpL10Ab/uL1 or GFP as a control. Cell numbers were counted 24 hrs after dsRNA transfection. Right: 24 hrs after dsRNA transfection, S2 cells were infected with CrPV. Cells were collect at 0 hr and 6 hrs after CrPV infection, and the viral load was determined by RT-qPCR. The mean and standard deviation (SD) from three biological replicates are shown. **: p<0.01 (t-test), NS: not significant (t-test). (C) Left: shown are relative CrPV intergenic region (IGR) IRES activities upon RpL29/eL29 or RpL10Ab/uL1 knockdown, compared to the GFP knockdown as a control in Drosophila S2 cells. Right: shown are activities of cap-dependent translation reporter bearing the HBB (human hemoglobin beta) 5′UTR upon RpL29/eL29 or RpL10Ab/uL1 knockdown, compared to the GFP knockdown as a control in Drosophila S2 cells. Firefly luciferase (Fluc) reporter activity was normalized to Fluc mRNA and transfection efficiency using co-transfected Renilla luciferase (Rluc) normalized to Rluc mRNA. The mean and standard deviation (SD) from four biological replicates are shown. *: p<0.05 (t-test), NS: not significant (t-test). (D) Left: shown are relative encephalomyocarditis virus (EMCV) and Hepatitis C virus (HCV) IRES activities upon RpL29/eL29 or RpL10Ab/uL1 knockdown, compared to control siRNA in C3H10T1/2 cells-- a mouse mesenchymal stem cell line where IRESes generally exhibit higher activities than mESCs. Right: shown are activities of cap-dependent translation reporter bearing either HBB (human hemoglobin beta) or Actb (beta-actin) 5′UTR upon RpL29/eL29 or RpL10Ab/uL1 knockdown, compared to control siRNA in C3H10T1/2 cells. The mean and standard deviation (SD) from three biological replicates are shown. *: p<0.05 (t-test), NS: not significant (t-test). (E) In mESCs, Igf2, App and Chmp2a mRNAs were assayed for their relative distributions in sucrose gradient fractionation, by RTqPCR. The shift from most actively translating polysomes (medium and heavy polysomes in fraction III) to lighter fractions upon Rpl10a/uL1 knockdown by siRNA indicating decreased translation initiation of these mRNAs. The mean and standard deviation (SD) from three biological replicates are shown. *: p<0.05 (t-test). (F) Shown are relative IRES activities of Igf2, App and Chmp2a 5′UTR upon RpL29/eL29 or RpL10Ab/uL1 knockdown, compared to control siRNA in C3H10T1/2 cells. The mean and standard deviation (SD) from three biological replicates are shown. *: p<0.05 (t-test), NS: not significant (t-test). See also Figure S6.

Comment in

References

    1. Anger AM, Armache JP, Berninghausen O, Habeck M, Subklewe M, Wilson DN, Beckmann R. Structures of the human and Drosophila 80S ribosome. Nature. 2013;497:80–85. - PubMed
    1. Beaudoin ME, Poirel VJ, Krushel LA. Regulating amyloid precursor protein synthesis through an internal ribosomal entry site. Nucleic Acids Res. 2008;36:6835–6847. - PMC - PubMed
    1. Boehringer D, Thermann R, Ostareck-Lederer A, Lewis JD, Stark H. Structure of the hepatitis C virus IRES bound to the human 80S ribosome: remodeling of the HCV IRES. Structure. 2005;13:1695–1706. - PubMed
    1. Boria I, Garelli E, Gazda HT, Aspesi A, Quarello P, Pavesi E, Ferrante D, Meerpohl JJ, Kartal M, Da Costa L, et al. The ribosomal basis of diamond-blackfan anemia: Mutation and database update. Hum Mutat. 2010;31:1269–1279. - PMC - PubMed
    1. Carter MS, Sarnow P. Distinct mRNAs that encode La autoantigen are differentially expressed and contain internal ribosome entry sites. J Biol Chem. 2000;275:28301–28307. - PubMed

MeSH terms