. 2017 Jul 10;42(1):22-36.e12.
doi: 10.1016/j.devcel.2017.05.016. Epub 2017 Jun 15.

The CEP19-RABL2 GTPase Complex Binds IFT-B to Initiate Intraflagellar Transport at the Ciliary Base

Affiliations

The CEP19-RABL2 GTPase Complex Binds IFT-B to Initiate Intraflagellar Transport at the Ciliary Base

Tomoharu Kanie et al. Dev Cell. .

Abstract

Highly conserved intraflagellar transport (IFT) protein complexes direct both the assembly of primary cilia and the trafficking of signaling molecules. IFT complexes initially accumulate at the base of the cilium and periodically enter the cilium, suggesting an as-yet-unidentified mechanism that triggers ciliary entry of IFT complexes. Using affinity-purification and mass spectrometry of interactors of the centrosomal and ciliopathy protein, CEP19, we identify CEP350, FOP, and the RABL2B GTPase as proteins organizing the first known mechanism directing ciliary entry of IFT complexes. We discover that CEP19 is recruited to the ciliary base by the centriolar CEP350/FOP complex and then specifically captures GTP-bound RABL2B, which is activated via its intrinsic nucleotide exchange. Activated RABL2B then captures and releases its single effector, the intraflagellar transport B holocomplex, from the large pool of pre-docked IFT-B complexes, and thus initiates ciliary entry of IFT.

Keywords: CEP19; CEP350; FGFR1OP; RABL2; cilia; ciliopathy; intraflagellar transport; obesity; retinal degeneration; small GTPase.


Figures

Figure 1
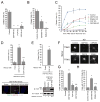
Figure 1. Identification of the centriolar FOP and CEP350 proteins, and of the conserved RABL2B small GTPase as an interactor of CEP19
A–B. (A) Cell lysates from RPE cells expressing N-terminally LAP (EGFP-TEV cleavage site-S tag-PreScission cleavage site)-tagged CEP19 were purified with GFP antibodies and S-protein beads. Proteins were resolved by SDS-PAGE and visualized by silver staining. (B) Spectral counts, unique peptide counts, and coverage indicated in the table. C–E. GST pull-down assays with indicated purified GST-tagged proteins and IVT MYC-tagged proteins. Eluates analyzed by immunoblotting with indicated antibodies. Asterisk: Non-specific binding to GST tag. F. Established order of binding of CEP350, FOP, CEP19, and RABL2B via in vitro binding experiments. See also Figure S1.
Figure 2
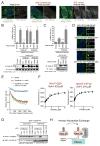
Figure 2. The localization of RABL2B and CEP19 to the inner pericentriolar material is regulated by FOP and CEP350
A. RPE cells or RPE cells expressing GFP-RABL2B were serum starved 24 hr and immunostained with indicated antibodies. The graph (right) shows the normalized fluorescent intensity of the indicated proteins that colocalize with the centrosome in either confluent or 24 hr serum starved (S.S. 24 hr) cells. Scale bar: 10 μm. B–E. RPE cells expressing GFP-CEP164 (B–D) or GFP-RABL2B (E) were serum starved 24 hr and immunostained with indicated antibodies. Images acquired via structured illumination microscopy. GFP-CEP164: a marker of the distal appendage. CEP170 and Ninein: markers of sub-distal appendage and proximal end of the mother centriole. Scale bar: 1 μm. F. Alternate hypotheses for RABL2B localization. Top: RABL2B localizes to the proximal region of the distal appendage. Bottom: RABL2B localizes to inner pericentriolar material. G. RPE-BFP-Cas9 cells with specified gene knockouts were serum starved 24 hr and immunostained with indicated antibodies. Exogenous GFP-RABL2B was expressed in knockout cells and immunostained with α-GFP. Scale bar: 1μm. See Fig. S2C–F for quantification data. H. The order of recruitment and physical binding for the CEP350-FOP-CEP19-RABL2B pathway. See also Figure S2.
Figure 3
Figure 3. The CEP350/FOP/CEP19/RABL2B complex is important for ciliation
A. Single cell clones (n = 5–6) of RPE-BFP-Cas9 cells with the specified gene knockouts were serum starved 24 hr and subjected to the ciliation assay described in Methods. Data averaged from the indicated number of single cell clones. Error bars represent ± SD. See Fig. S3A for individual clone data. B. Single cell clones of RPE-BFP-Cas9 cells with the specified gene knockouts were subjected to the ciliation assay. Data averaged from three independent experiments of each clone. Error bars represent ± SD. C. Pools of RPE-BFP-Cas9 single cell clones with the specified gene knockouts were serum starved for the indicated times, and subjected to the ciliation assay. Data averaged from two independent experiments. Error bars represent ± SD. D. RPE-BFP-Cas9 CEP19 KO cells stably expressing empty vector, untagged CEP19 WT, or CEP19 R82X were serum starved 24 hr and subjected to the ciliation assay. Top: Ciliation quantification of each cell line. Data averaged from three independent experiments. Scale bar: 10 μm. Error bars represent ± SD. Bottom: Confirmation of CEP19 expression by immunofluorescence. E. RPE-BFP-Cas9 FOP KO cells stably expressing empty vector or untagged FOP WT were serum starved 24 hr and subjected to the ciliation assay. Top: Ciliation quantification of each cell line. Data averaged from three independent experiments. Error bars represent ± SD. Bottom: Confirmation of the expression of FOP by immunoblot. Relative expression levels of exogenous compared to endogenous FOP in control RPE cells is indicated. F. RPE-BFP-Cas9 cells with the specified gene knockouts were serum starved 24 hr and immunostained with α-TTBK2 antibody. Scale bar: 1 μm. G–H. RPE-BFP-Cas9 cells with the specified gene knockouts were serum starved 24 hr and immunostained with α-CP110 antibody. Data averaged from three single cell clones (G) or three independent experiments (H). Error bars represent ± SD. See also Figure S3.
Figure 4
Figure 4. RABL2B is a small GTPase with high intrinsic nucleotide exchange rate
A. RPE cells expressing GFP-RABL2B WT, S35N (GDP-locked/empty), or Q80L (GTP-locked) were serum starved 24 hr and immunostained with indicated antibodies. Arrow: GFP signal at cilium base. Arrowhead: GFP signal within cilium. Red arrowhead: GFP signal at the cilium tip. Scale bar: 10 μm. B–C. RABL2 or CEP19 KO RPE cells stably expressing empty vector or untagged RABL2A/B WT or mutants were serum starved 24 hr and subjected to the ciliation assay. Top: Ciliation quantification of each cell line. Data averaged from three independent experiments. Error bars represent ± SD. Bottom: Confirmation of RABL2 expression by immunoblot. The relative expression levels of exogenous compared to endogenous RABL2 from control RPE cells is indicated. D. RPE-BFP-Cas9 or RPE CEP19 knockout cells expressing either GFP-RABL2B WT or Q80L (GTP-locked) were serum starved 24 hr and immunostained with indicated antibodies. Arrow: GFP signal at cilium base. Arrowhead: GFP signal within cilium. Red arrowhead: GFP signal at the cilium tip. Scale bar: 10 μm. E. Purified CrRabl2 was first loaded with MANT-GDP. Nucleotide exchange was initiated by adding buffer (blue), GppNHp (red), or GppNHp and CEP19 (green). Data averaged from four technical replicates. Experiment was performed six times, and one representative is shown. F. The Kd of CrRabl2 was determined by measuring the fluorescence increase induced by the titration of CrRabl2 in 200 nM MANT-GDP (left) or MANT-GTPγS (right). Data averaged from four technical replicates. G. GST pull-down assay with GST-CrCEP19 and IVT MYC-tagged CrRabl2 loaded with GDP/GTP, or with CrRabl2 GDP/GTP-locked mutants. Eluates analyzed by immunoblotting with indicated antibodies. H. RABL2B intrinsically exchanges GDP for GTP. RABL2B·GTP binds to CEP19 at a site distinct from RABL2B’s switch region, which binds to effectors. See also Figure S4.
Figure 5
Figure 5. Identification of the IFT-B complex as an effector of RABL2B
A–B. (A) Cell lysates from RPE cells expressing N-terminally LAP-tagged RABL2B WT or mutants were subjected to tandem affinity purifications as described in Fig. 1A. Cells expressing C-terminally LAP-tagged IFT88 serve as a comparison for comparing the migration of individual IFT-B subunits. (B) Spectral counts indicated in the table. C. Dissociation of the IFT-B complex via expression of the dominant-negative IFT52 allowed identification of the subcomplex that interacts with RABL2B. Left: RPE cells stably expressing N-terminally GFP-tagged RABL2B Q80L (GTP locked form) or C-terminally GFP-tagged IFT88 and indicated N-terminally FLAG-tagged IFT52 mutants were serum starved 24 hr and immunoprecipitated with α-GFP antibody. Eluates analyzed by immunoblotting with indicated antibodies. Right: A cartoon depicting the dissociation of IFT-B by IFT52 mutant expression. IFT52 K127E/R195E dissociates IFT-B into the IFT-B1 and IFT-B2 sub-complexes. The C-terminal fragment (350–432 a.a.) of IFT-52 dissociates the IFT81/74/22/27/25/46/56 sub-complex from the IFT-B holocomplex. The N-terminal fragment (1-326 a.a.) of IFT52 fails to dissociate IFT-B. D. The individual components of the IFT81/74/22/25/27/56 sub-complex were deleted to determine the direct interactor of RABL2. Left: RPE cells with the specified sgRNAs were infected with lentivirus carrying GFP-RABL2B Q80L (GTP-locked). Cells were serum starved 24 hr and immunoprecipitated with α-GFP antibody. Eluates analyzed by immunoblotting with indicated antibodies. Asterisk: Non-specific band masking endogenous IFT74. Right: A cartoon depicting the interaction of RABL2B and IFT-B. E. RPE cells expressing GFP-CEP164 or GFP-RABL2B were serum starved 24 hr and immunostained with the indicated antibodies. Images acquired via structured illumination microscopy. Scale bar: 1 μm. See also Figure S5 and Table S1.
Figure 6
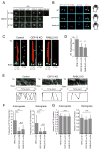
Figure 6. RABL2B triggers the entry of IFT-B into the cilium
A. RPE-BFP-Cas9 and the specified knockout cells were serum starved 24 hr and immunostained with indicated antibodies. Scale bar: 1 μm. See Fig. S6F–H for quantification data. B. RPE-BFP-Cas9, CEP19 KO, and RABL2 KO cells expressing GFP-CEP164 were serum starved 24 hr and immunostained with indicated antibodies. Images acquired via structured illumination microscopy. Scale bar: 1 μm. C–D. (C) RPE-BFP-Cas9, CEP19 KO, and RABL2 KO cells were serum starved 48 hr and immunostained with indicated antibodies. Images acquired via structured illumination microscopy. (D) Quantification of IFT-B particles described in (C). Error bars represent ± SD. Scale bar: 1 μm. E. RPE-BFP-Cas9, CEP19 KO, and RABL2 KO cells expressing C-terminally GFP-tagged IFT80 were serum starved 48 hr and live-cell imaged via TIRF microscopy. Top: Kymographs created from live-cell microscopy movie S1. Bottom: The movement of IFT-B trains interpreted from the kymographs. See Movie S1. F–G. Quantification of the frequency (F) and velocity (G) of IFT-B trains. Sample size represents the number of cilia (F) or particles (G) analyzed. See also Figure S6 and Movie S1.
Figure 7
Figure 7. Histological analysis of key tissues supports a BBS-like phenotype for Rabl2 knockouts
A. Left: A representative image of the right hind limb from Rabl2−/− mice with polydactyly. Right: Quantification of the proportion of mice with polydactyly. B. Left: Histological analysis of the retina from 16-week-old mice. G, ganglion cell layer; IPL, inner plexiform layer; INL, inner nuclear layer; OPL, outer plexiform layer; ONL, outer nuclear layer; P, photoreceptor cell layer. Scale bar: 20 μm. Right: Quantification of ONL/INL ratio of peripheral retina. Error bars represent ± SD. C. A model for the mechanism by which RABL2B triggers the entry of IFT-B into the cilium.

Comment in

  • Gating Ciliary Transport.
    Sánchez I, Dynlacht BD. Sánchez I, et al. Dev Cell. 2017 Jul 10;42(1):5-6. doi: 10.1016/j.devcel.2017.06.016. Dev Cell. 2017. PMID: 28697332

References

    1. Bangs F, Anderson KV. Primary Cilia and Mammalian Hedgehog Signaling. Cold Spring Harbor perspectives in biology 2016 - PMC - PubMed
    1. Banizs B, Pike MM, Millican CL, Ferguson WB, Komlosi P, Sheetz J, Bell PD, Schwiebert EM, Yoder BK. Dysfunctional cilia lead to altered ependyma and choroid plexus function, and result in the formation of hydrocephalus. Development. 2005;132:5329–5339. - PubMed
    1. Bhogaraju S, Cajanek L, Fort C, Blisnick T, Weber K, Taschner M, Mizuno N, Lamla S, Bastin P, Nigg EA, et al. Molecular Basis of Tubulin Transport Within the Cilium by IFT74 and IFT81. Science. 2013;341:1009–1012. - PMC - PubMed
    1. Bhogaraju S, Taschner M, Morawetz M, Basquin C, Lorentzen E. Crystal structure of the intraflagellar transport complex 25/27. The EMBO journal. 2011;30:1907–1918. - PMC - PubMed
    1. Bos JL, Rehmann H, Wittinghofer A. GEFs and GAPs: critical elements in the control of small G proteins. Cell. 2007;129:865–877. - PubMed

Publication types