. 2018 Feb;176(2):1199-1214.
doi: 10.1104/pp.17.00435. Epub 2017 Jun 16.

Establishment of Photosynthesis through Chloroplast Development Is Controlled by Two Distinct Regulatory Phases

Affiliations

Establishment of Photosynthesis through Chloroplast Development Is Controlled by Two Distinct Regulatory Phases

Carole Dubreuil et al. Plant Physiol. 2018 Feb.

Abstract

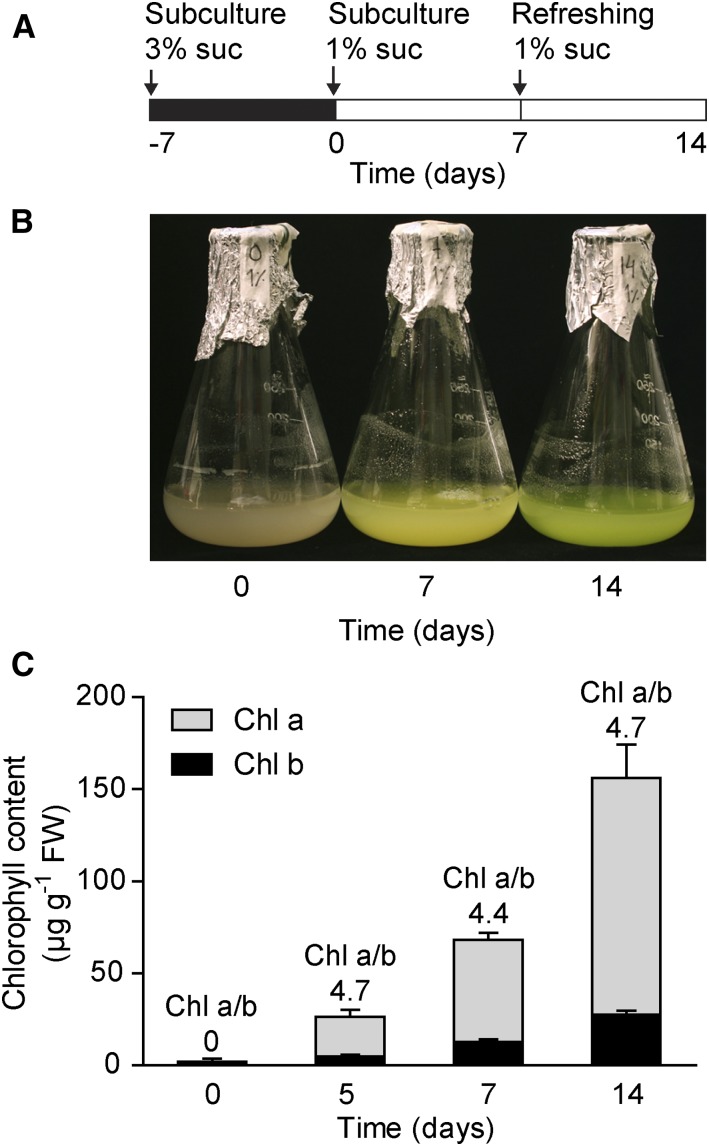
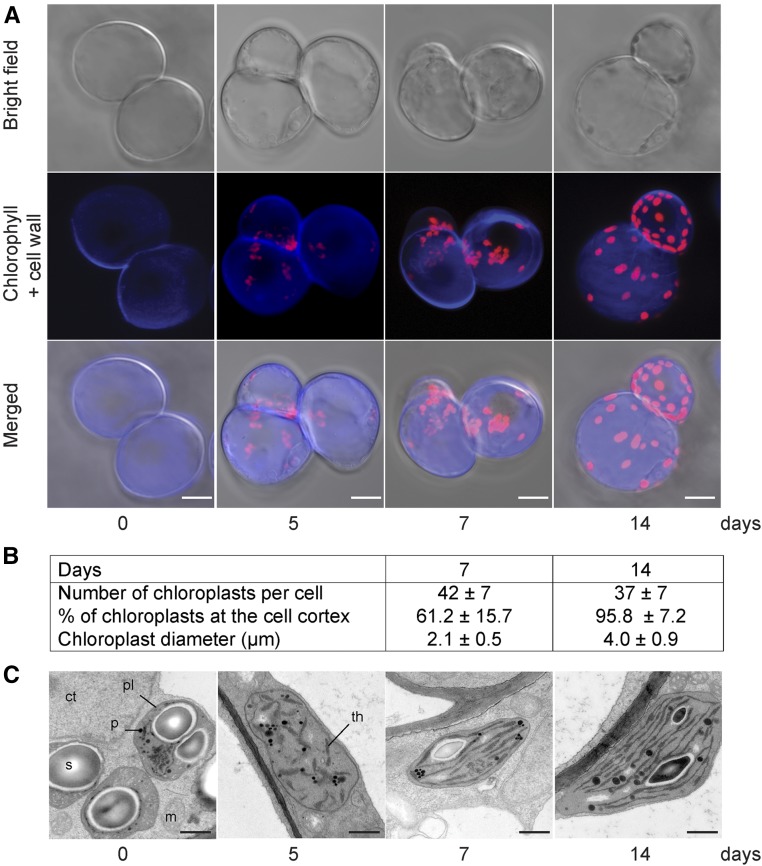
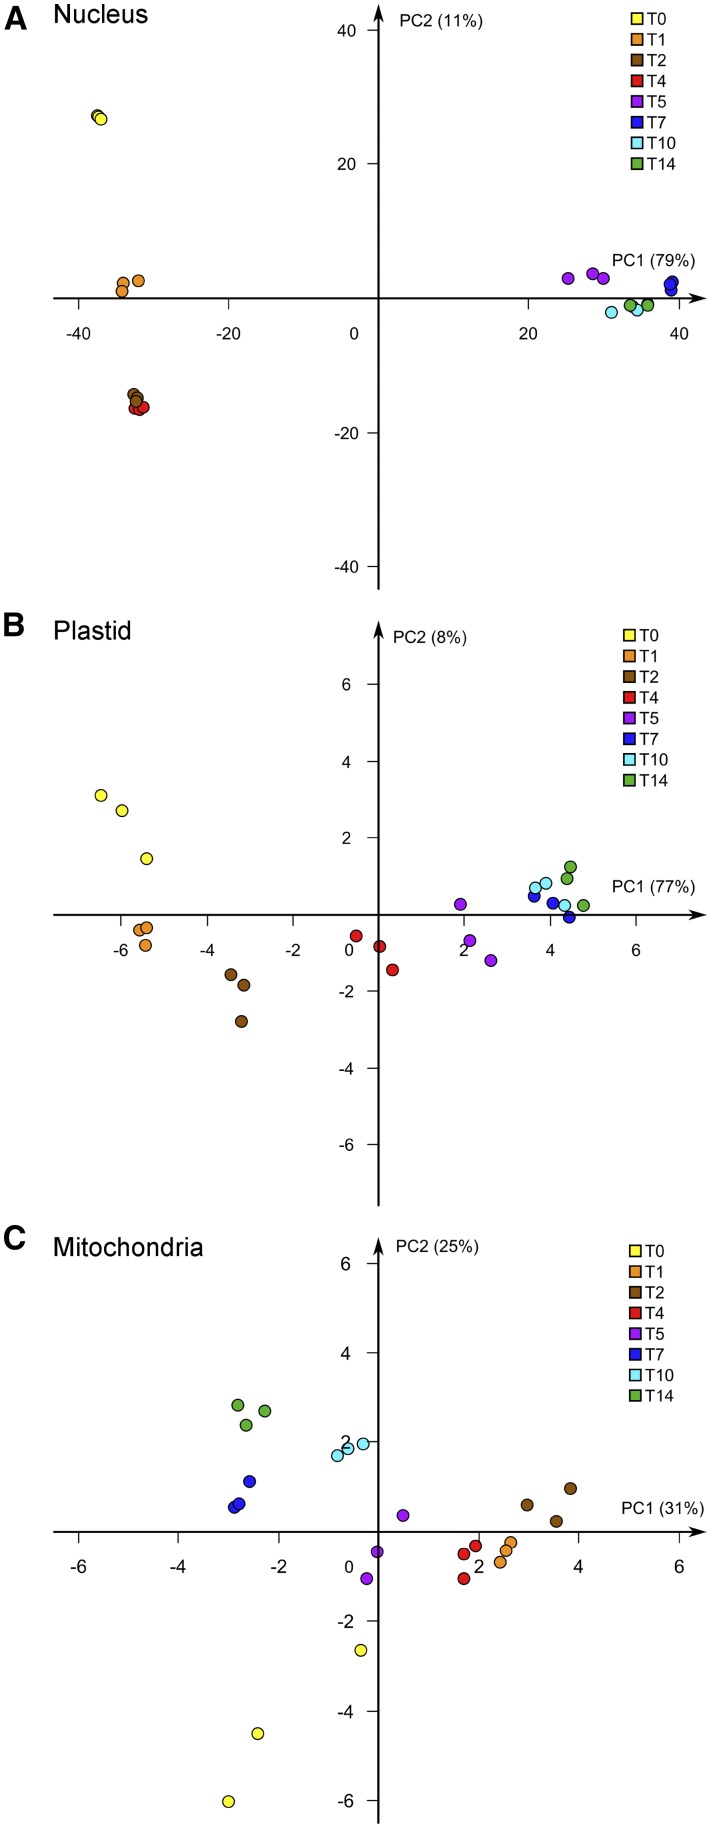
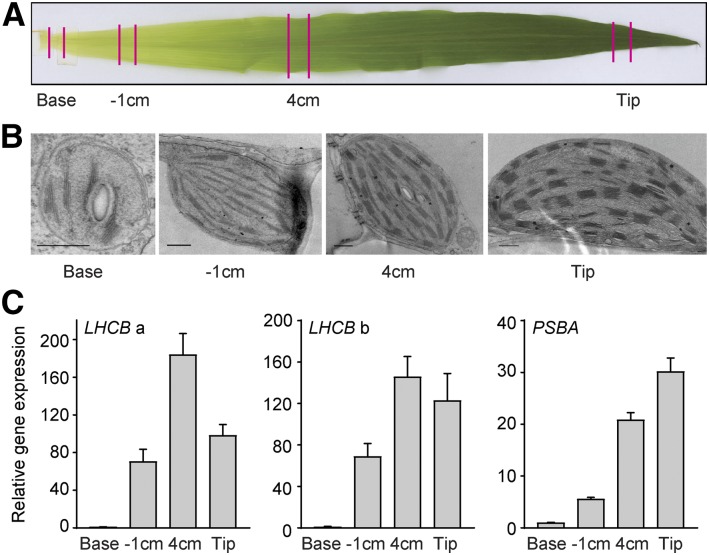
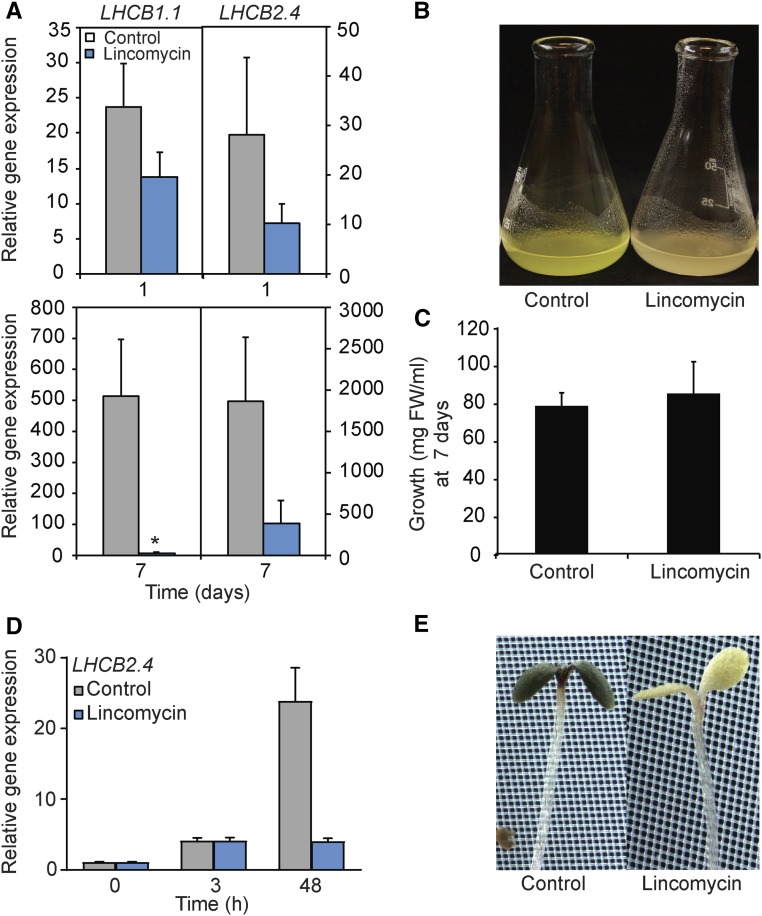
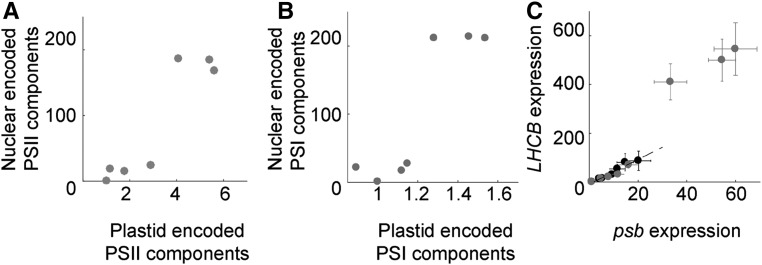
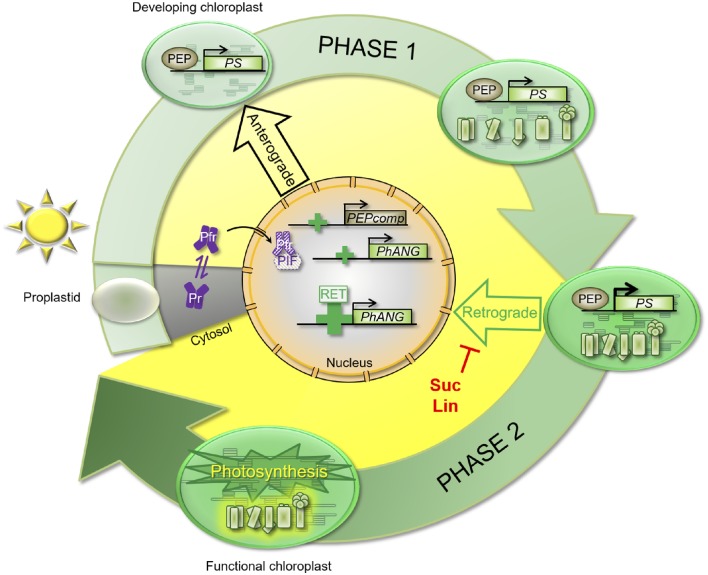
Chloroplasts develop from undifferentiated proplastids present in meristematic tissue. Thus, chloroplast biogenesis is closely connected to leaf development, which restricts our ability to study the process of chloroplast biogenesis per se. As a consequence, we know relatively little about the regulatory mechanisms behind the establishment of the photosynthetic reactions and how the activities of the two genomes involved are coordinated during chloroplast development. We developed a single cell-based experimental system from Arabidopsis (Arabidopsis thaliana) with high temporal resolution allowing for investigations of the transition from proplastids to functional chloroplasts. Using this unique cell line, we could show that the establishment of photosynthesis is dependent on a regulatory mechanism involving two distinct phases. The first phase is triggered by rapid light-induced changes in gene expression and the metabolome. The second phase is dependent on the activation of the chloroplast and generates massive changes in the nuclear gene expression required for the transition to photosynthetically functional chloroplasts. The second phase also is associated with a spatial transition of the chloroplasts from clusters around the nucleus to the final position at the cell cortex. Thus, the establishment of photosynthesis is a two-phase process with a clear checkpoint associated with the second regulatory phase allowing coordination of the activities of the nuclear and plastid genomes.


Figures

Figure 1.
Figure 1.
Greening process induced by light in Arabidopsis cell culture. A, Experimental conditions used to investigate chloroplast biogenesis in Arabidopsis cell culture. Cells were subcultured in MS medium with 1% (w/v) Suc, equilibrated (T0), and then placed under continuous light. At 7 d, the MS medium was replaced with the same volume of fresh MS medium. B, Seven- and 14-d cells compared with the control (T0). C, Chlorophyll a and b contents following light exposure. Values are means ± sd of three biological replicates. Chl a/b, Chlorophyll a/b ratio; FW, fresh weight of the cell culture.
Figure 2.
Figure 2.
Visualization of proplastids developing into functional chloroplasts. A, Confocal laser scanning microscopy of the Arabidopsis cell line during light exposure. Confocal optical sections were combined for a three-dimensional reconstruction showing the bright field, Calcofluor White-stained cell wall, and chlorophyll autofluorescence. Bars = 20 μm. B, Plastid size, numbers, and cellular positions at 7 and 14 d. C, Electron microscopy images of proplastids developing into chloroplasts following light exposure. Representative images from at least two independent experiments for each developmental stage are shown. ct, Cytoplasm; m, mitochondrion; p, plastoglobule; pl, plastid; s, starch; th, thylakoids. Bars = 0.5 μm.
Figure 3.
Figure 3.
Photosynthetic activity established in the Arabidopsis cell culture. A, Blue-native PAGE analysis of thylakoid protein complexes from 5-, 7-, and 14-d cells and from 3-week-old Arabidopsis Columbia-0 (Col-0) plants. The gel shown is representative of two independent experiments. The adjusted loading was according to protein content. B, Western blot against photosynthetic protein in samples from 0-, 1-, 4-, 5-, 7-, and 14-d cells. C, Chlorophyll fluorescence variation at 7 and 14 d. The graph is representative of three independent experiments. AL, Actinic light; ML, measuring light. D, The chlorophyll fluorescence parameter Fv/Fm measured at 7 and 14 d. E, Oxygen evolution rate measured in 5-, 7-, and 14-d cells. Values represent means ± sd of three independent experiments with three biological replicates per experiment. FW, Fresh weight of the cell culture.
Figure 4.
Figure 4.
Evolution of the metabolome during chloroplast development. A, PCA plot for the metabolite profile at different time points of chloroplast development. The two first components (PC1 and PC2) are plotted proportionally. The different colors represent days in light (0–14 d), with six independent biological replicates per day; the percentages shown on the axes indicate the proportion of variance for each principal component. B and C, Box-plot diagrams showing the accumulation of metabolites down- and up-regulated during the chloroplast development process, respectively. Colors are not connected to T0 and T14 in A.
Figure 5.
Figure 5.
Global analysis of gene expression in response to light. PCA plots are shown for nuclear gene expression (A), plastid gene expression (B), and mitochondrial gene expression (C) in response to light. The different colors represent days in light (0–14 d), with three independent biological replicates per day; the percentages shown on the axes indicate the proportion of variance for each principal component (PC1 and PC2).
Figure 6.
Figure 6.
Expression of the components required for the photosynthetic light reaction. Gene expression heat maps are shown for PSII components (A) and PSI components (B) of nucleus-encoded genes (top) and plastid-encoded genes (bottom), photosystem assembly factors (C), and chlorophyll biosynthesis enzymes (D). Each column represents gene expression at a time point compared with the previous one [log2(T/T-1)]. Red color indicates genes that were up-regulated, and yellow color indicates genes that were down-regulated, compared with the previous time point.
Figure 7.
Figure 7.
Expression of photosynthetic components along the chloroplast developmental gradient of a maize leaf. A, Illustration of the samples collected from the leaf gradient. B, Electron microscopy images of proplastids developing into chloroplasts following the leaf gradient. Images were chosen from at least two independent experiments for each developmental stage. Bars = 0.5 μm. C, LHCB and PSBA gene expression. LHCBa and LHCBb represent GRMZM2G351977 and GRMZM2G120619, respectively. Gene expression was normalized to UBIQUITIN-CONJUGATING ENZYME E2 (ZmUBI; qGRMZM2G102421) and related to the amount present in the base sample. Each data point represents the mean ± se of at least three independent replicates.
Figure 8.
Figure 8.
Lincomycin treatment blocks phase 2 in the regulation of LHCB expression in cell culture and Arabidopsis seedlings. A, Gene expression of nucleus-encoded LHCB1.1 and LHCB2.4 in the cell culture 1 and 7 d following the addition of 500 μm lincomycin. Gene expression was normalized to ubiquitin-like protein (At4g36800) and related to the amount present in the dark. Each data point represents the mean ± sd of at least three independent replicates. The asterisk indicates a significant difference between the control and lincomycin conditions (Student’s t test: *, P < 0.05). B, Representative photograph of 7-d-old control and lincomycin-treated cells. C, Growth parameters of 7-d-old control and lincomycin-treated cells. FW, Fresh weight of the cell culture. D, LHCB2.4 expression in Arabidopsis seedlings 3 and 48 h following a shift to 1 mm lincomycin. Gene expression was normalized to ubiquitin-like protein (At4g36800) and related to the amount present in the dark. Each data point represents the mean ± se of at least three independent replicates. E, Representative photographs of control and lincomycin-treated Arabidopsis seedlings following a 48-h light exposure.
Figure 9.
Figure 9.
Coordination of plastid and nuclear expression. Expression is shown for PSII and PSI components encoded in the nucleus (y axis) plotted versus components encoded in the plastids (x axis). A, Geometric mean expression of nucleus- versus plastid-encoded PSII components displayed in Figure 6A. B, Geometric mean expression of PSI components displayed in Figure 6B. C, Geometric mean of LHCB1.1 and LHCB2.4 (y axis) and psbA and psbD (x axis). Black and gray circles are expression levels measured for 3% and 1% Suc, respectively.
Figure 10.
Figure 10.
Model for the two distinct regulatory phases required for the full expression of nucleus-encoded photosynthesis genes. In response to light, a rapid induction of nucleus-encoded photosynthesis-associated genes is observed (PEPcomp and PhANG). This induction was assigned previously the response of the photoreceptors (Pfr and Pr). Once a certain developmental stage has been reached, the first thylakoid membranes have been formed, some photosynthetic activity detected, and expression of the plastid-encoded photosynthesis genes (PS) activated, a second strong induction of gene expression was observed. This second induction was inhibited by Suc or lincomycin (Lin) treatments, whereas the inhibitors did not affect the first light-triggered induction of gene expression. This suggests that the two regulatory phases are controlled by different mechanisms and that the second phase is dependent on a positive retrograde signal (Retrograde). PIF, Phytochrome-interacting factor.

References

    1. Alexa A, Rahnenfuhrer J (2010) topGO: Enrichment Analysis for Gene Ontology. R package version 2.22.0
    1. Andriankaja M, Dhondt S, De Bodt S, Vanhaeren H, Coppens F, De Milde L, Mühlenbock P, Skirycz A, Gonzalez N, Beemster GT, et al. (2012) Exit from proliferation during leaf development in Arabidopsis thaliana: a not-so-gradual process. Dev Cell 22: 64–78 - PubMed
    1. Barajas-López JdeD, Blanco NE, Strand Å (2013a) Plastid-to-nucleus communication, signals controlling the running of the plant cell. Biochim Biophys Acta 1833: 425–437 - PubMed
    1. Barajas-López JdeD, Kremnev D, Shaikhali J, Piñas-Fernández A, Strand A (2013b) PAPP5 is involved in the tetrapyrrole mediated plastid signalling during chloroplast development. PLoS ONE 8: e60305. - PMC - PubMed
    1. Bolger AM, Lohse M, Usadel B (2014) Trimmomatic: a flexible trimmer for Illumina sequence data. Bioinformatics 30: 2114–2120 - PMC - PubMed

Publication types

Substances

LinkOut - more resources