. 2017 Feb 1;8(2):1329-1336.
doi: 10.1039/c6sc03880h. Epub 2016 Oct 10.

A new microfluidic approach for the one-step capture, amplification and label-free quantification of bacteria from raw samples

Affiliations

A new microfluidic approach for the one-step capture, amplification and label-free quantification of bacteria from raw samples

Iago Pereiro et al. Chem Sci. .

Abstract

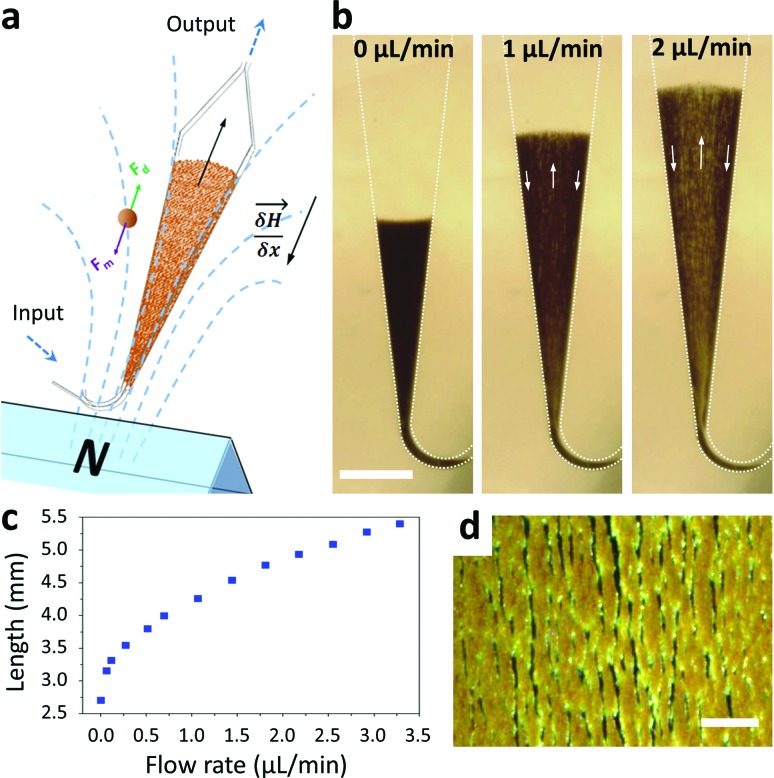
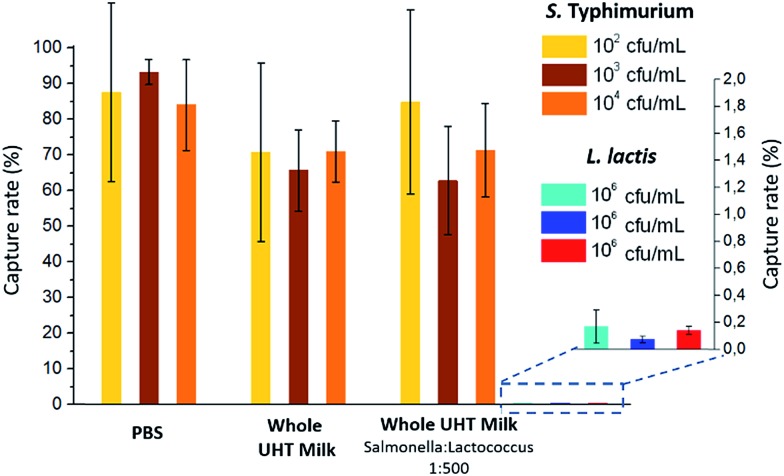
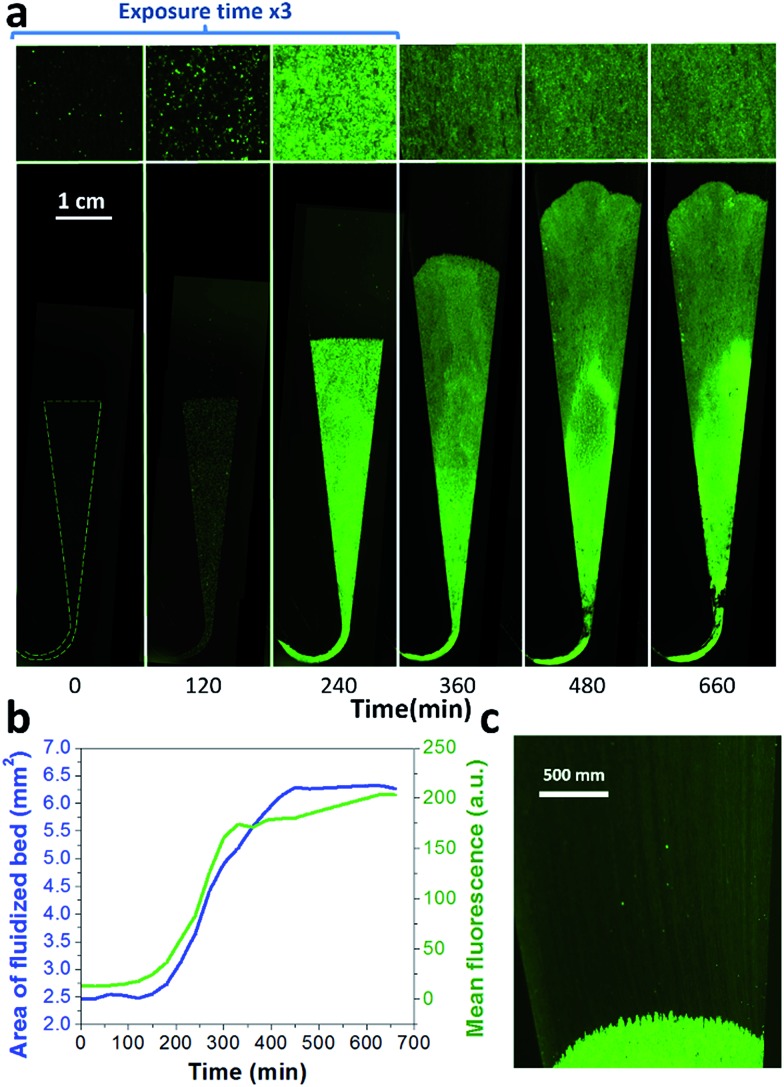
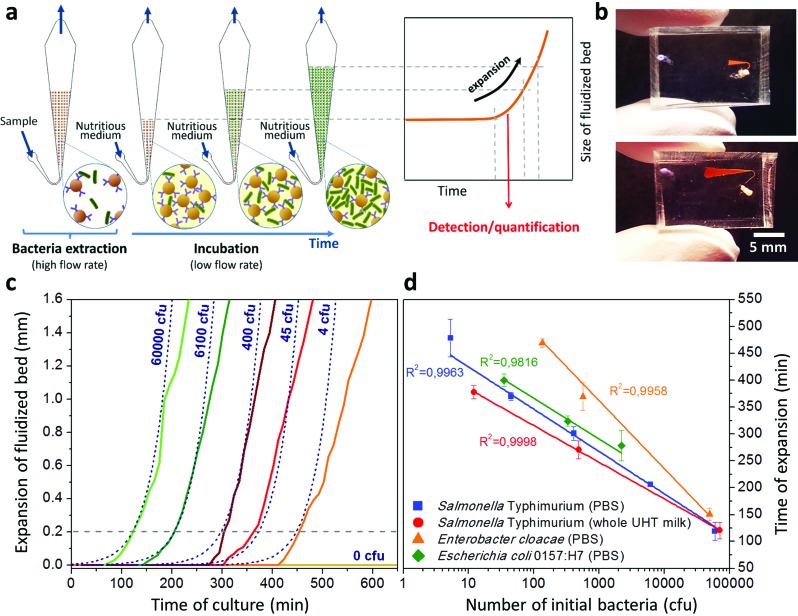
A microfluidic method to specifically capture and detect infectious bacteria based on immunorecognition and proliferative power is presented. It involves a microscale fluidized bed in which magnetic and drag forces are balanced to retain antibody-functionalized superparamagnetic beads in a chamber during sample perfusion. Captured cells are then cultivated in situ by infusing nutritionally-rich medium. The system was validated by the direct one-step detection of Salmonella Typhimurium in undiluted unskimmed milk, without pre-treatment. The growth of bacteria induces an expansion of the fluidized bed, mainly due to the volume occupied by the newly formed bacteria. This expansion can be observed with the naked eye, providing simple low-cost detection of only a few bacteria and in a few hours. The time to expansion can also be measured with a low-cost camera, allowing quantitative detection down to 4 cfu (colony forming unit), with a dynamic range of 100 to 107 cfu ml-1 in 2 to 8 hours, depending on the initial concentration. This mode of operation is an equivalent of quantitative PCR, with which it shares a high dynamic range and outstanding sensitivity and specificity, operating at the live cell rather than DNA level. Specificity was demonstrated by controls performed in the presence of a 500× excess of non-pathogenic Lactococcus lactis. The system's versatility was demonstrated by its successful application to the detection and quantitation of Escherichia coli O157:H15 and Enterobacter cloacae. This new technology allows fast, low-cost, portable and automated bacteria detection for various applications in food, environment, security and clinics.


Figures

Fig. 1
Fig. 1. Scheme of the microfluidic fluidized bed. An external permanent magnet creates a magnetic field gradient inside a triangle-shaped chamber, resulting in magnetic forces globally oriented towards the chamber inlet, applied on superparamagnetic beads (a). Fluids are passed into the chamber through the inlet located on the magnet side, using a pressure-based flow controller (MFCS Fluigent). If no pressure is applied, the beads remain in a packed-bed configuration due to magnetic forces (scale bar = 1 mm) (b); under flow, the beads are also subject to drag forces oriented upstream, and above a flow threshold a new, steady-state dynamic equilibrium, called the fluidized bed regime, is achieved, favoring high percolation rates and internal recirculation of the beads (indicated with arrows). The total length of the fluidized bed is directly dependent on the applied flow rate due to a change in the porosity of the bed (c). The bed in the fluidized state is shown in the micrograph (d) and in Movie S2, showing the high bead density and the multiple percolation paths leading to efficient and uniform capture (scale bar = 200 μm).
Fig. 2
Fig. 2. Capture rates obtained for S. Typhimurium at two different initial concentrations and for different matrices: PBS, whole UHT milk and whole UHT milk with a proportion of S. Typhimurium to L. lactis of 1 : 500. The non-specific capture of L. lactis is given in expanded scale at the right of the histogram. Data are presented as mean ± s.d. of at least three independent experiments.
Fig. 3
Fig. 3. On-chip culture of GFP-expressing S. Typhimurium. Bacteria were first captured from 50 μL at 105 cfu ml–1 (5000 total bacteria perfused in the chamber), and then cultured on chip, perfusing LB at a flow rate of 0.15 μL min–1. (a) Images of the whole bed (lower frame) and zoom (upper frame), taken every 120 min. (b) Fluorescence intensity (green) and fluidized bed area (blue). (c) Towards the end of the bed expansion (300 min), a flow of bacteria can be seen leaving the magnetic beads, dragged by the flow (at this low resolution, bacteria flow appears as faint streaks).
Fig. 4
Fig. 4. Protocol and results for the direct detection of bacteria by bed expansion. (a) After sample capture and rinsing steps (at 1 and 1.5 μL min–1, respectively), measurements of the expansion of the fluidized bed (at a constant flow rate of 0.15 μL min–1) were made along the chamber axis, with reference to the initial position of the front of the bed before expansion, resulting in expansion curves. (b) Image of a microfluidic chip at the beginning and end of a typical experiment, for a positive result. The expansion curves obtained with different initial concentrations of S. Typhimurium (indicated in the figure as cfu per 50 μL of sample) are shifted with regards to each other (c), and are in good agreement with a model of expansion based on the volume of newly-formed bacteria (c, dashed lines). Defining an expansion threshold at 200 μm (c, dotted line), a time of expansion can be measured for each initial concentration. A logarithmic plot of this expansion time versus initial bacterial load is shown in (d) for S. Typhimurium in PBS (blue squares) and S. Typhimurium in whole UHT milk (red circles), Enterobacter cloacae in PBS (orange triangles) and Escherichia coli O157:H7 in PBS (green diamonds).

References

    1. W. H. Organization, Antimicrobial resistance: global report on surveillance, World Health Organization, 2014.
    1. F. disease burden epidemiology reference group 2007–2015, WHO estimates of the global burden of foodborne diseases, 2015.
    1. Cassar R., Cuschieri P. J. Clin. Microbiol. 2003;41:3229–3232. - PMC - PubMed
    1. Zhu Y., Qiao L., Prudent M., Bondarenko A., Gasilova N., Möller S. B., Lion N., Pick H., Gong T., Chen Z., Yang P., Lovey L. T., Girault H. H. Chem. Sci. 2016;7:2987–2995. - PMC - PubMed
    1. Gutiérrez R., González I., García T., Carrera E., Sanz B., Hernández P. E., Martín R. J. Food Prot. 1997;60:23–27. - PubMed

LinkOut - more resources