

Distinct neural processes support post-success and post-error slowing in the stop signal task
- PMID: 28627420
- PMCID: PMC6359720
- DOI: 10.1016/j.neuroscience.2017.06.011
Distinct neural processes support post-success and post-error slowing in the stop signal task
Abstract
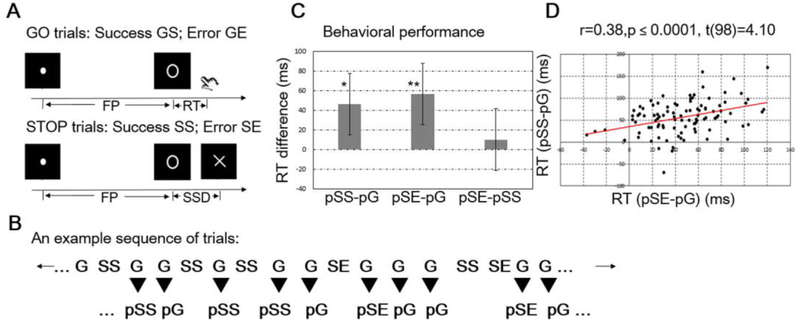
Executive control requires behavioral adaptation to environmental contingencies. In the stop signal task (SST), participants exhibit slower go trial reaction time (RT) following a stop trial, whether or not they successfully interrupt the motor response. In previous fMRI studies, we demonstrated activation of the right-hemispheric ventrolateral prefrontal cortex, in the area of inferior frontal gyrus, pars opercularis (IFGpo) and anterior insula (AI), during post-error slowing (PES). However, in similar analyses we were not able to identify regional activities during post-success slowing (PSS). Here, we revisited this issue in a larger sample of participants (n=100) each performing the SST for 40 min during fMRI. We replicated IFGpo/AI activation to PES (p≤0.05, FWE corrected). Further, PSS engages decreased activation in a number of cortical regions including the left inferior frontal cortex (IFC; p≤0.05, FWE corrected). We employed Granger causality mapping to identify areas that provide inputs each to the right IFGpo/AI and left IFC, and computed single-trial amplitude (STA) of stop trials of these input regions as well as the STA of post-stop trials of the right IFGpo/AI and left IFC. The STAs of the right inferior precentral sulcus and supplementary motor area (SMA) and right IFGpo/AI were positively correlated and the STAs of the left SMA and left IFC were positively correlated (slope>0, p's≤0.01, one-sample t test), linking regional responses during stop success and error trials to those during PSS and PES. These findings suggest distinct neural mechanisms to support PSS and PES.
Keywords: cognitive control; error processing; fMRI; go/no-go; post-signal slowing.
Copyright © 2017 IBRO. Published by Elsevier Ltd. All rights reserved.
Figures


References
-
- Aiaike H (2008) A new look at the statistical model indentification’ IEEE Transactions on Automatic Control. Automatic Control IEEE Transactions on 19:716–723.
-
- Ambrosini E, Vallesi A (2016) Asymmetry in prefrontal resting-state EEG spectral power underlies individual differences in phasic and sustained cognitive control. Neuroimage 124:843–857. - PubMed
-
- Amengual JL, Marco-Pallares J, Richter L, Oung S, Schweikard A, Mohammadi B, Rodriguez-Fornells A, Munte TF (2013) Tracking post-error adaptation in the motor system by transcranial magnetic stimulation. Neuroscience 250:342–351. - PubMed
MeSH terms
Grants and funding
LinkOut - more resources
Full Text Sources
Other Literature Sources
Miscellaneous
