. 2017 Jun 30;127(7):2678-2688.
doi: 10.1172/JCI92617. Epub 2017 Jun 19.

Osteocyte-specific WNT1 regulates osteoblast function during bone homeostasis

Affiliations

Osteocyte-specific WNT1 regulates osteoblast function during bone homeostasis

Kyu Sang Joeng et al. J Clin Invest. .

Abstract

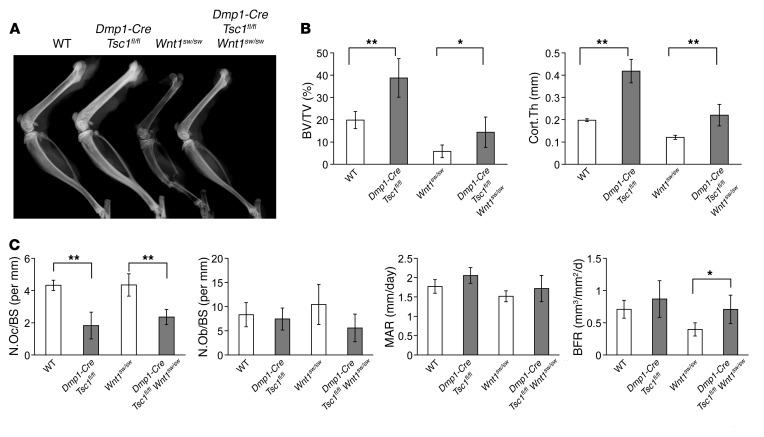
Mutations in WNT1 cause osteogenesis imperfecta (OI) and early-onset osteoporosis, identifying it as a key Wnt ligand in human bone homeostasis. However, how and where WNT1 acts in bone are unclear. To address this mechanism, we generated late-osteoblast-specific and osteocyte-specific WNT1 loss- and gain-of-function mouse models. Deletion of Wnt1 in osteocytes resulted in low bone mass with spontaneous fractures similar to that observed in OI patients. Conversely, Wnt1 overexpression from osteocytes stimulated bone formation by increasing osteoblast number and activity, which was due in part to activation of mTORC1 signaling. While antiresorptive therapy is the mainstay of OI treatment, it has limited efficacy in WNT1-related OI. In this study, anti-sclerostin antibody (Scl-Ab) treatment effectively improved bone mass and dramatically decreased fracture rate in swaying mice, a model of global Wnt1 loss. Collectively, our data suggest that WNT1-related OI and osteoporosis are caused in part by decreased mTORC1-dependent osteoblast function resulting from loss of WNT1 signaling in osteocytes. As such, this work identifies an anabolic function of osteocytes as a source of Wnt in bone development and homoeostasis, complementing their known function as targets of Wnt signaling in regulating osteoclastogenesis. Finally, this study suggests that Scl-Ab is an effective genotype-specific treatment option for WNT1-related OI and osteoporosis.


Conflict of interest statement

Conflict of interest: The authors have declared that no conflict of interest exists.

Figures

Figure 1
Figure 1. The phenotypes of bone-specific Wnt1 loss-of-function (Dmp1-Cre Wnt1fl/fl) mouse models.
(A) X-ray radiograph and micro-CT (μCT) images of female WT and Dmp1-Cre Wnt1fl/fl mice at 2 months old. The white arrow indicates a fracture site in the mutant mouse. (B) Quantification results of μCT analysis; femoral trabecular bone for bone volume/total volume (BV/TV), trabecular number (Tb.N), trabecular thickness (Tb.Th), and trabecular space (Tb.Sp), and cortical bone for cortical thickness (Cort.Th). Results are shown as means ± SD (n = 8 per group). (C) Histomorphometric analysis of L4 vertebrae; osteoclast numbers per bone surface (N.Oc/BS), osteoblast numbers per bone surface (N.Ob/BS), mineral surface per bone surface (MS/BS), mineral apposition rate (MAR), and bone formation rate (BFR) in WT and Dmp1-Cre Wnt1fl/fl mice. Results are shown as means ± SD (n = 6 for WT, n = 8 for Dmp1-Cre Wnt1fl/fl). The comparison between WT and Wnt1 loss-of-function mice is determined by Student’s t test. **P < 0.01, ***P < 0.001.
Figure 2
Figure 2. The phenotypes of bone-specific Wnt1 gain-of-function (Dmp1-Cre Rosa26Wnt1/+) mouse models.
(A) X-ray radiograph and μCT images of female WT and Dmp1-Cre Rosa26Wnt1/+ mice at 2 months old. (B) Quantification results of μCT analysis; femoral trabecular bone for bone volume/total volume (BV/TV), trabecular number (Tb.N), trabecular thickness (Tb.Th), and trabecular space (Tb.Sp), and cortical bone for cortical thickness (Cort.Th). Results are shown as means ± SD (n = 6 per group). (C) Histomorphometric analysis of L4 vertebrae; osteoclast numbers per bone surface (N.Oc/BS), osteoblast numbers per bone surface (N.Ob/BS), mineral surface per bone surface (MS/BS), mineral apposition rate (MAR), and bone formation rate (BFR) in WT and Dmp1-Cre Rosa26Wnt1/+ mice. Results are shown as means ± SD (n = 6 per group). The comparison between WT and Wnt1 gain-of-function mice is determined by Student’s t test. *P < 0.05, **P < 0.01, ***P < 0.001.
Figure 3
Figure 3. mTORC1 signaling mediated enhanced osteoblast differentiation and mineralization by Wnt1 overexpression in vitro.
(A) Quantitative reverse transcriptase PCR (RT-PCR) of Wnt1, Runx2, alkaline phosphatase, and osteocalcin in control helper-dependent adenovirus–treated (HDAd-GFP) and WNT1 helper-dependent adenovirus–treated (HDAd-mWnt1) ST2 cells. Results are shown as fold change of the mean of control group ± SD (n = 3 per group). (B) Mineralization assay by alizarin red staining on the seventh day after control virus–treated and HDAd-mWnt1–treated ST2 cells. (C) The representative Western blot analysis showed activated pS6 relative to total S6 and pAkt (Ser473) relative to total Akt of control virus– and HDAd-mWnt1–treated ST2 cells. Results are shown as fold change of the mean of control group ± SD (n = 3 per group). The Western blot represents 3 individual experiments. (D and E) Quantitative RT-PCR of alkaline phosphatase (D) and Lef1 (E) after control treatment (DMSO) or pharmacological inhibition of mTOR signaling by rapamycin in control virus– and HDAd-mWnt1–treated ST2 cells. Results are shown as fold change of the mean of control group ± SD (n = 3 per group). (F) Mineralization assay after control treatment (DMSO) or pharmacological inhibition of mTOR signaling by rapamycin in control virus– and HDAd-mWnt1–treated ST2 cells. The comparison between control and HDAd-mWnt1–treated groups is determined by Student’s t test. *P < 0.05, **P < 0.01, ***P < 0.001.
Figure 4
Figure 4. WNT1 gain-of-function mouse models showed significantly reduced high bone mass after treatment with the mTORC1 signaling inhibitor rapamycin.
(A) X-ray radiograph of femurs of female WT and Dmp1-Cre Rosa26Wnt1/+ mice after vehicle control or rapamycin injections in 2-month-old mice. (B) μCT analysis of femoral trabecular bone for bone volume/total volume (BV/TV) and of cortical bone for cortical thickness (Cort.Th) in WT and Dmp1-Cre Rosa26Wnt1/+ mice treated with vehicle control or rapamycin. Results are shown as means ± SD (n = 5 for WT, n = 4 for Dmp1-Cre Rosa26Wnt1/+). (C) Histomorphometric analysis of L4 vertebrae for osteoclast numbers per bone surface (N.Oc/BS), osteoblast numbers per bone surface (N.Ob/BS), mineral surface per bone surface (MS/BS), mineral apposition rate (MAR), and bone formation rate (BFR) in WT and Dmp1-Cre Rosa26Wnt1/+ mice treated with vehicle control or rapamycin. Results are shown as means ± SD (n = 5 for WT, n = 4 for Dmp1-Cre Rosa26Wnt1/+). The comparisons between vehicle-treated WT and vehicle-treated WNT1 gain-of-function groups and between vehicle-treated and rapamycin-treated WNT1 gain-of-function groups are determined by Mann-Whitney U test. *P < 0.05, ***P < 0.001.
Figure 5
Figure 5. Genetic activation of mTORC1 signaling partially rescued the low bone mass phenotype of the Wnt1sw/sw models.
(A) X-ray radiograph of femurs of 2-month-old female WT, Dmp1-Cre Tsc1fl/fl, Wnt1sw/sw, and Dmp1-Cre Tsc1fl/fl Wnt1sw/sw mice. (B) μCT analysis of femoral trabecular bone for bone volume/total volume (BV/TV) and of cortical bone for cortical thickness (Cort.Th) in WT, Dmp1-Cre Tsc1fl/fl, Wnt1sw/sw, and Dmp1-Cre Tsc1fl/fl Wnt1sw/sw mice. Results are shown as means ± SD (n = 6 for WT, n = 5 for Dmp1-Cre Tsc1fl/fl, n = 4 for Wnt1sw/sw, n = 6 for Dmp1-Cre Tsc1fl/fl Wnt1sw/sw mice). (C) Histomorphometric analysis of L4 vertebrae for osteoclast numbers per bone surface (N.Oc/BS), osteoblast numbers per bone surface (N.Ob/BS), mineral surface per bone surface (MS/BS), mineral apposition rate (MAR), and bone formation rate (BFR) in WT, Dmp1-Cre Tsc1fl/fl, Wnt1sw/sw, and Dmp1-Cre Tsc1fl/fl Wnt1sw/sw mice. Results are shown as means ± SD (n = 6 for WT, n = 5 for Dmp1-Cre Tsc1fl/fl, n = 6 for Wnt1sw/sw, n = 6 for Dmp1-Cre Tsc1fl/fl Wnt1sw/sw mice). The comparisons between WT and Dmp1-Cre Tsc1fl/fl and between Wnt1sw/sw and Dmp1-Cre Tsc1fl/fl Wnt1sw/sw are determined by Mann-Whitney U test. *P < 0.05, **P < 0.01.
Figure 6
Figure 6. Wnt1sw/sw mice showed phenotypic corrections in femurs after treatment with Scl-Ab.
(A) X-ray radiograph of femurs of 2-month-old female WT and Wnt1sw/sw mice treated with vehicle control or sclerostin-neutralizing antibody (Scl-Ab). (B) μCT analysis of femoral trabecular bone for bone volume/total volume (BV/TV) and of cortical bone for cortical thickness (Cort.Th) in WT and Wnt1sw/sw mice treated with vehicle control or Scl-Ab. Results are shown as means ± SD (n = 7 for WT, n = 3 for WT with Scl-Ab, n = 8 for Wnt1sw/sw, n = 7 for Wnt1sw/sw with Scl-Ab). (C) Histomorphometric analysis of L4 vertebrae for mineral surface per bone surface (MS/BS), mineral apposition rate (MAR), and bone formation rate (BFR) in WT and Wnt1sw/sw mice treated with vehicle control or Scl-Ab. Results are shown as means ± SD (n = 6 for WT, n = 4 for WT with Scl-Ab, n = 9 for Wnt1sw/sw, n = 7 for Wnt1sw/sw with Scl-Ab). (D) Biomechanical testing results by 3-point bending assay for maximum load, stiffness, and post-yield energy of femurs in WT and Wnt1sw/sw mice treated with vehicle control or Scl-Ab. Results are shown as means ± SD (n = 7 for WT, n = 4 for WT with Scl-Ab, n = 8 for Wnt1sw/sw, n = 8 for Wnt1sw/sw with Scl-Ab). The comparisons of WT mice with vehicle versus Scl-Ab treatment and Wnt1sw/sw mice with vehicle versus Scl-Ab treatment are determined by Mann-Whitney U test. *P < 0.05, **P < 0.01, ***P < 0.001. (E) Schematic model of osteocyte function as a sender and receiver of Wnt signaling. OPG, osteoprotegerin.

Comment in

  • Strengthening brittle bones.
    Shoemaker AH. Shoemaker AH. Sci Transl Med. 2017 Jun 28;9(396):eaan6730. doi: 10.1126/scitranslmed.aan6730. Sci Transl Med. 2017. PMID: 28659442

Similar articles

Cited by

References

    1. Baron R, Kneissel M. WNT signaling in bone homeostasis and disease: from human mutations to treatments. Nat Med. 2013;19(2):179–192. doi: 10.1038/nm.3074. - DOI - PubMed
    1. Babij P, et al. High bone mass in mice expressing a mutant LRP5 gene. J Bone Miner Res. 2003;18(6):960–974. doi: 10.1359/jbmr.2003.18.6.960. - DOI - PubMed
    1. Boyden LM, et al. High bone density due to a mutation in LDL-receptor-related protein 5. N Engl J Med. 2002;346(20):1513–1521. doi: 10.1056/NEJMoa013444. - DOI - PubMed
    1. Gong Y, et al. LDL receptor-related protein 5 (LRP5) affects bone accrual and eye development. Cell. 2001;107(4):513–523. doi: 10.1016/S0092-8674(01)00571-2. - DOI - PubMed
    1. Little RD, et al. A mutation in the LDL receptor-related protein 5 gene results in the autosomal dominant high-bone-mass trait. Am J Hum Genet. 2002;70(1):11–19. doi: 10.1086/338450. - DOI - PMC - PubMed

MeSH terms