. 2017 Aug;18(8):940-950.
doi: 10.1038/ni.3775. Epub 2017 Jun 19.

Tissue-resident memory features are linked to the magnitude of cytotoxic T cell responses in human lung cancer

Affiliations

Tissue-resident memory features are linked to the magnitude of cytotoxic T cell responses in human lung cancer

Anusha-Preethi Ganesan et al. Nat Immunol. 2017 Aug.

Abstract

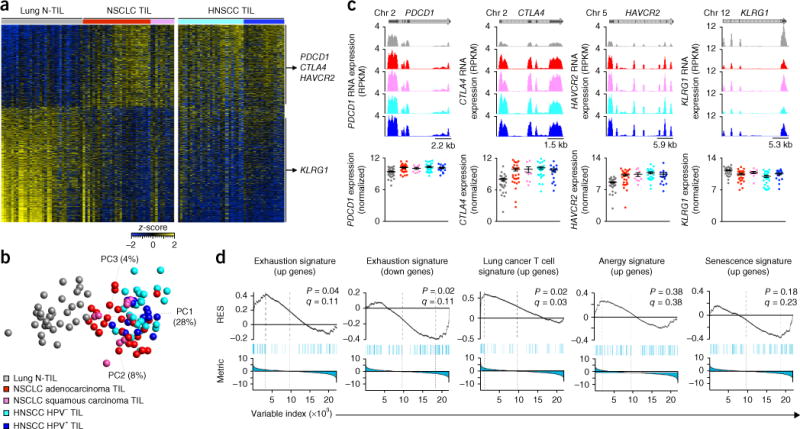
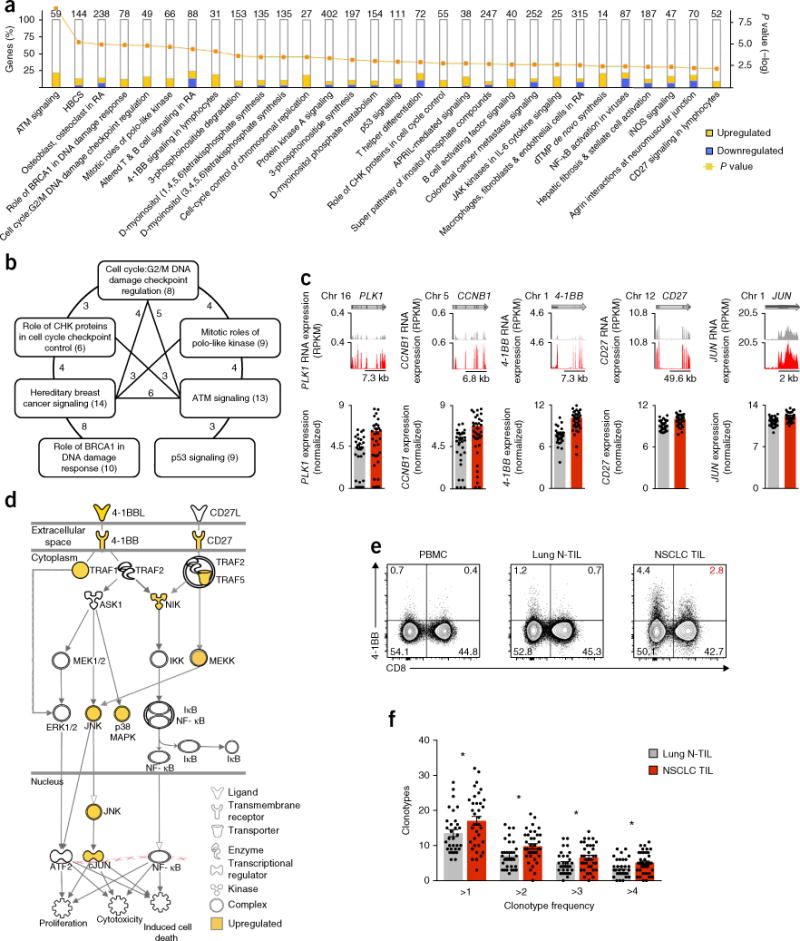
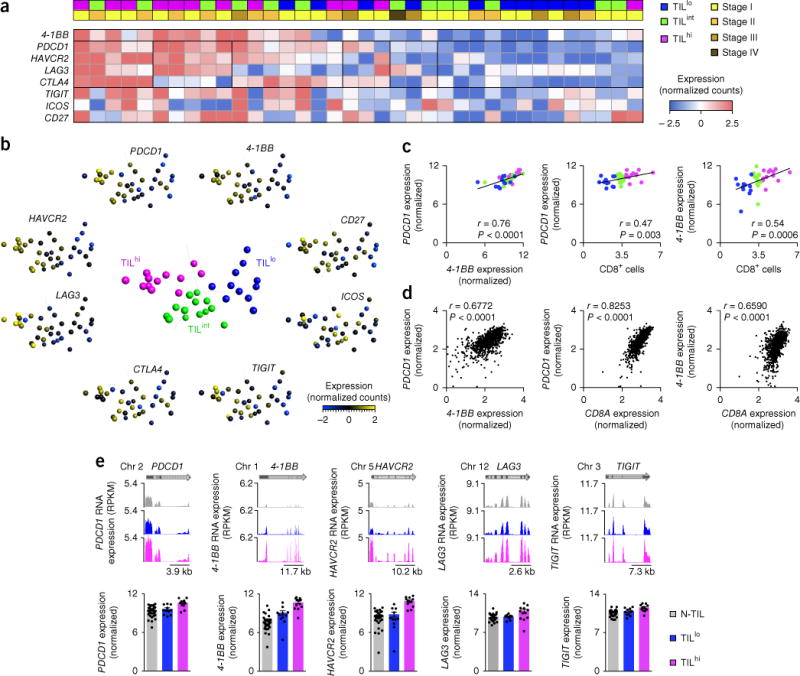
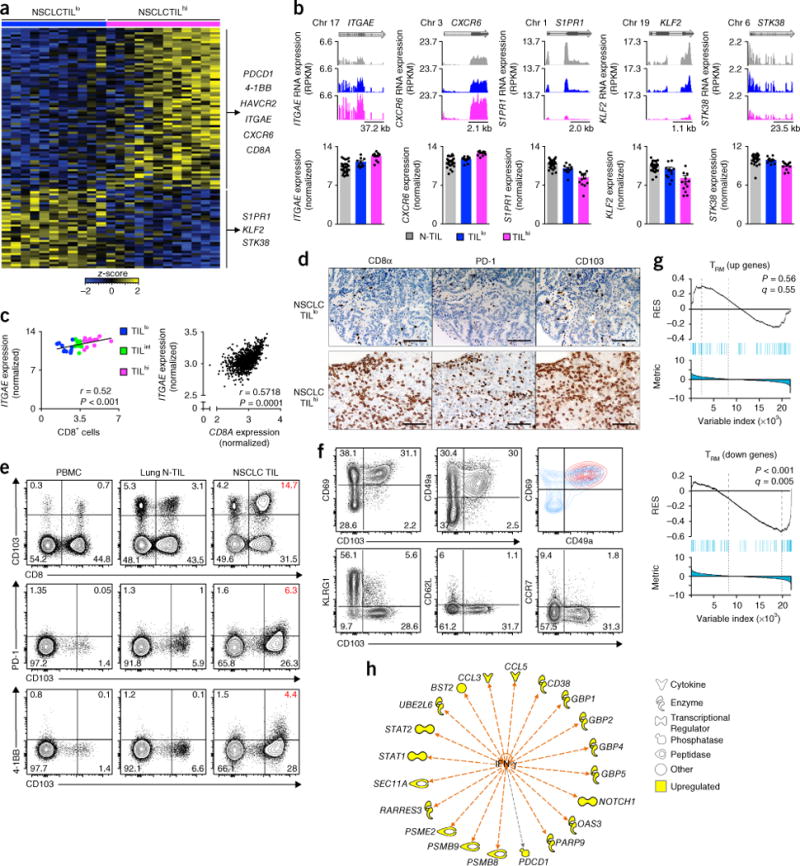
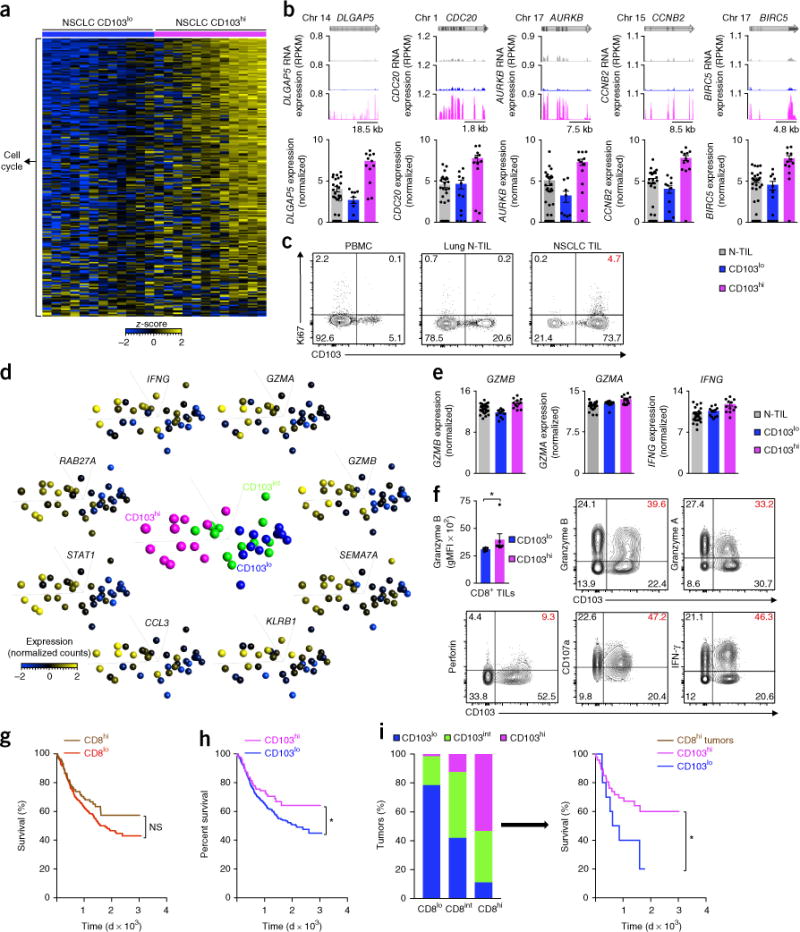
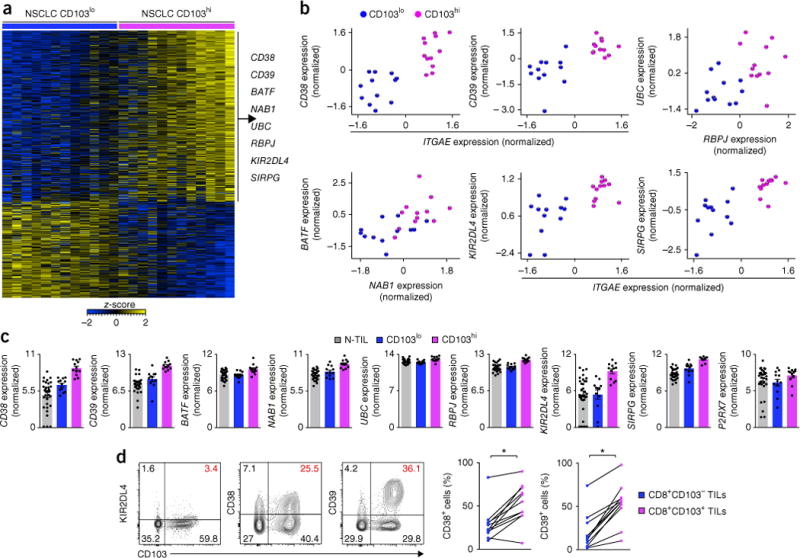
Therapies that boost the anti-tumor responses of cytotoxic T lymphocytes (CTLs) have shown promise; however, clinical responses to the immunotherapeutic agents currently available vary considerably, and the molecular basis of this is unclear. We performed transcriptomic profiling of tumor-infiltrating CTLs from treatment-naive patients with lung cancer to define the molecular features associated with the robustness of anti-tumor immune responses. We observed considerable heterogeneity in the expression of molecules associated with activation of the T cell antigen receptor (TCR) and of immunological-checkpoint molecules such as 4-1BB, PD-1 and TIM-3. Tumors with a high density of CTLs showed enrichment for transcripts linked to tissue-resident memory cells (TRM cells), such as CD103, and CTLs from CD103hi tumors displayed features of enhanced cytotoxicity. A greater density of TRM cells in tumors was predictive of a better survival outcome in lung cancer, and this effect was independent of that conferred by CTL density. Here we define the 'molecular fingerprint' of tumor-infiltrating CTLs and identify potentially new targets for immunotherapy.


Conflict of interest statement

COMPETING FINANCIAL INTERESTS

The authors declare no competing financial interests.

Figures

Figure 1
Figure 1
Core transcriptional profile of CD8+ TILs. (a) RNA-Seq analysis of genes (one per row) expressed differentially by lung CD8+ N-TILs (left; n = 32 donors) versus NSCLC CD8+ TILs (middle and right; n = 36 donors) (pairwise comparison; change in expression of 1.5-fold with an adjusted P value of <0.05 (DESeq2 analysis; Benjamini-Hochberg test)), presented as row-wise z-scores of normalized read counts in CD8+ TILs from donors with NSCLC adenocarcinoma (red) or squamous carcinoma (pink) or HNSCC negative (light blue) or positive (dark blue) for human papilloma virus (HNSCC TIL; n = 41 donors); each column represents an individual sample; right margin, genes encoding exhaustion-associated molecules (vertical lines group genes upregulated (top) or downregulated (bottom) in NSCLC CD8+ TILs relative to their expression in lung CD8+ N-TILs). (b) Principal-component analysis of CD8+ T cell core transcriptomes (symbols) in N-TILs and TILs as in a (key); numbers along perimeter indicate principal components (PC1–PC3), and numbers in parentheses indicate percent variance for each. HPV, human papilloma virus. (c) RNA-Seq analysis of genes encoding exhaustion-associated molecules (as in a) in N-TILs and TILs (key in b), presented as reads per kilobase per million (RPKM) mapped as University of California Santa Cruz genome browser tracks (top) or as a summary of the results (bottom; log2 normalized counts). Each symbol (bottom) represents an individual sample; small horizontal lines indicate the mean (± s.e.m.). Above plots, position of exons (including untranslated regions) (dark grey) and introns (light grey) in each gene, as well as the chromosome (Chr) on which the gene is present. (d) GSEA of various gene sets (above plots) in the transcriptome of CD8+ TILs versus that of CD8+ N-TILs from donors with NSCLC, presented as the running enrichment score (RES) for the gene set as the analysis ‘walks down’ the ranked list of genes (reflective of the degree to which the gene set is over-represented at the top or bottom of the ranked list of genes) (top), the position of the gene-set members (blue vertical lines) in the ranked list of genes (middle), and the value of the ranking metric (bottom). P values, Kolmogorov-Smirnov test. Data are from one experiment with n = 32 donors (lung N-TILs), n = 36 donors (NSCLC TILs) and n = 41 donors (HNSCC TILs).
Figure 2
Figure 2
Pathways for which CD8+ TILs show enrichment. (a) Analysis of canonical pathways from the Ingenuity pathway analysis database (horizontal axis; bars in plot) for which CD8+ TILs show enrichment, presented as the frequency of differentially expressed genes encoding components of each pathway that are upregulated or downregulated (key) in CD8+ TILs relative to their expression in CD8+ N-TILs (left vertical axis), and adjusted P values (right vertical axis; line; Fisher’s exact test); numbers above bars indicate total genes in each pathway. HBCS, hereditary breast cancer signaling; BRCA, tumor suppressor; RA, rheumatoid arthritis; CHK, checkpoint kinase; APRIL, proliferation-inducing ligand; dTMP, deoxythymidine monophosphate; NF-κB, transcription factor; iNOS, inducible nitric oxide synthase. (b) Overlap of genes encoding components of the cell-cycle and proliferation pathways in CD8+ TILs and in CD8+ N-TILs: numbers in parentheses indicate total genes in each pathway; numbers along lines indicate total genes shared by the pathways connected by the line. (c) RNA-Seq analysis of PLK1 (encoding the serine-threonine kinase PLK1), CCNB1 (encoding cyclin B1), 4-1BB, CD27 and JUN (encoding the transcription factor c-Jun) in lung N-TILs and NSCLC TILs (key in f) (presented as in Fig. 1c). (d) Ingenuity pathway analysis of genes upregulated in CD8+ TILs relative to their expression in N-TILs (yellow), encoding components of the canonical 4-1BB and CD27 signaling pathways (shape indicates function (key)) in lymphocytes. (e) Flow-cytometry analysis of the surface expression of 4-1BB and CD8 on live and singlet-gated CD45+CD3+ T cells obtained from peripheral blood mononuclear cells (PBMC), lung N-TILs and NSCLC TILs (above plots) from the same patient. Numbers in quadrants indicate percent cells in each throughout; red indicates percent cells among TILs throughout. (f) Quantification of clonotypes (average values) among CD8+ N-TILs and NSCLC CD8+ TILs (key) according to their frequency in each donor (horizontal axis), derived from RNA-Seq analysis of genes encoding TCR β-chains. Each symbol (c,f) represents an individual sample; small horizontal lines indicate the mean (± s.e.m.). *P < 0.05 (unpaired Student’s two-tailed t-test). Data are from one experiment (ad,f) or are representative of six experiments (e).
Figure 3
Figure 3
Heterogeneity among targets of immunotherapy. (a) RNA-Seq analysis (row-wise normalized counts; bottom key) of various transcripts (left margin; one per row) in CD8+ TILs from patients with NSCLC (one per column); above, CD8+ TIL density (top row; top left key) and tumor stage (bottom row; top right key) for each patient. (b) Principal-component analysis of CD8+ TILs from patients with NSCLC with TILlo, TILint or TILhi tumors (middle plot), and expression (key) of the transcripts in a in CD8+ TILs (plots along perimeter). Each symbol represents an individual patient. (c) Correlation of the expression of PDCD1 transcripts and that of 4-1BB transcripts (log2 normalized counts) in NSCLC CD8+ TILs (left), and correlation of the expression of PDCD1 transcripts (middle) or 4-1BB transcripts (right) and the number of tumor-infiltrating CD8+ cells (quantified by immunohistochemistry). Each symbol represents an individual patient (colors match those in b, middle). (d) Correlation of the expression of PDCD1 transcripts and that of 4-1BB transcripts (left), and correlation of the expression of PDCD1 transcripts (middle) or 4-1BB transcripts (right) and that of CD8A transcripts in the TCGA lung cancer RNA-Seq data set (extreme outliers are not presented here). Each symbol represents an individual patient (n = 1,013). (e) RNA-Seq analysis of PDCD1, 4-1BB, HAVCR2, LAG3 and TIGIT in N-TILS and TILs from TILhi or TILlo tumors (key) (presented as in Fig. 1c). r values (c,d) indicate the Spearman correlation coefficient; P values (c,d), Spearman correlation. Data are from one experiment.
Figure 4
Figure 4
Tissue-residency features of TILhi tumors. (a) RNA-Seq analysis of genes (one per row) expressed differentially (P values as in Fig. 1a) by NSCLC CD8+ TILs from TILlo tumors versus those from TILhi tumors (presented as in Fig. 1a); right margin, genes encoding exhaustion- and TRM cell–associated molecules. (b) RNA-Seq analysis of ITGAE, CXCR6, S1PR1, KLF2 and STK38 (presented as in Fig. 1c). Each symbol (bottom) represents an individual sample; small horizontal lines indicate the mean (± s.e.m.). (c) Correlation of the expression of ITGAE transcripts (log2 normalized counts) in NSCLC CD8+ TILs (key) and the number of tumor-infiltrating CD8+ cells (quantified by immunohistochemistry) (left), and of the expression of ITGAE transcripts and that of CD8A transcripts in the TCGA lung cancer RNA-Seq data set (right; extreme outliers not presented here) (r values and P values as in Fig. 3c,d). Each symbol represents an individual patient (n = 36 (left) or n = 1,013 (right)). (d) Immunohistochemistry microscopy of CD8α, PD-1 and CD103 (above images) in TILlo and TILhi NSCLC tumors (left margin). Scale bars, 100 μm. (e) Flow-cytometry analysis of the surface expression of CD8 and CD103 (top), PD-1 and CD103 (middle) and 4-1BB and CD103 (bottom) on live and singlet-gated T cells obtained from peripheral blood mononuclear cells, lung N-TILs and NSCLC TILs (above plots) from the same patient. (f) Flow-cytometry analysis of the expression of CD69 or CD49a versus that of CD103 (top row, left and middle), and of KLRG1, CD62L or CCR7 versus that of CD103 (bottom row) in live and singlet-gated CD45+CD3+CD8+ T cells; top right, overlay of CD103+CD8+ TILs (red) with CD103−CD8+ TILs (blue). (g) GSEA of TRM cell signature genes upregulated (top) or downregulated (bottom) in the transcriptome of CD8+ TILs from NSCLC TILhi tumors relative to their expression in other TILs and N-TILs (presented as in Fig. 1d). (h) Ingenuity pathway analysis of transcripts (perimeter) upregulated in NSCLC TILhi tumors that are regulated by interferon-γ (orange arrows) and encode products with various functions (key); gray arrow indicates an unpredicted effect of IFN-γ. Data are from one experiment (ac,g,h) or are representative of ten experiments (d) or six experiments (e,f).
Figure 5
Figure 5
CD103 density predicts survival in lung cancer. (a) RNA-Seq analysis of the expression of genes (one per row) encoding products related to cell cycle and proliferation, by NSCLC CD8+ TILs from CD103lo or CD103hi tumors (presented as in Fig. 1a). (b) RNA-Seq analysis of DLGAP5, CDC20, AURKB, CCNB2A and BIRC5, all encoding products linked to cell cycle and proliferation (presented as in Fig. 1c). Each symbol (bottom) represents an individual sample; small horizontal lines indicate the mean (± s.e.m.). (c) Flow-cytometry analysis of the expression of Ki67 and CD103 in live and singlet-gated CD45+CD3+CD8+ T cells obtained from peripheral blood mononuclear cells, lung N-TILs and NSCLC TILs (above plots) from the same patient. (d) Principal-component analysis of CD8+ TILs from patients with NSCLC with CD103lo, CD103int or CD103hi tumors (middle plot), and expression (key) of the transcripts encoding cytotoxicity-related products in CD8+ TILs (plots along perimeter). Each symbol represents an individual patient. (e) Expression of GZMB, GZMA and IFNG transcripts (log2 normalized counts) in cells as in b (key). (f) Expression of granzyme B (geometric mean fluorescence intensity (gMFI)) in CD8+ TILs from CD103lo tumors (n = 5) or CD103hi tumors (n = 7) (top left), and flow-cytometry analysis of the expression of granzyme B, granzyme A, perforin, CD107a (LAMP-1) or IFN-γ versus that of CD103 in live and singlet-gated CD45+CD3+CD8+ T cells obtained from NSCLC TILs. *P = 0.0025 (Mann-Whitney test). (g,h) Survival of patients (n = 689) with lung cancer, with a low density (CD8lo) or high density (CD8hi) of CD8+ cells (key) in tumors (g) or a low density (CD103lo) or high density (CD103hi) of CD103+ cells (key) in tumors (h), presented as Kaplan–Meier curves. NS, P = 0.086 (g), and *P = 0.043 (h) (log-rank test). (i) Frequency of CD103hi, CD103int or CD103lo tumors (key) among those pre-classified on the basis of CD8 density (horizontal axis) (left), and survival of patients with lung cancer with CD8hi tumors sub-classified according to the density of CD103-expressing cells (key) (right), presented as Kaplan–Meier curves. *P = 0.036 (log-rank test). Each symbol (e,f) represents an individual sample (e) or patient (f); small horizontal lines indicate the mean (± s.e.m.). Data are from one experiment (a,b,d,e,g–i) or are representative of six experiments (c) or twelve experiments (f).
Figure 6
Figure 6
Molecules newly linked to the tumor immune response. (a) RNA-Seq analysis of genes (one per row) expressed differentially by NSCLC CD8+ TILs from CD103lo tumors versus those from CD103hi tumors (presented as in Fig. 1a). (b) RNA-Seq analysis (z-scores of normalized counts) of various transcripts (horizontal axes) plotted against that of other transcripts (vertical axes) in NSCLC CD8+ TILs from CD103hi or CD103lo tumors (key in c). (c) Expression of the transcripts in b (log2 normalized counts) in N-TILs or in NSCLC CD8+ TILs from CD103hi or CD103lo tumors (key). (d) Flow-cytometry analysis of the expression of KIR2DL4, CD38 or CD39 versus that of CD103 in live and singlet-gated CD45+CD3+CD8+ T cells obtained from NSCLC TILs (left), and frequency of CD38+ cells or CD39+ cells among CD8+CD103 TILs or CD8+CD103+ TILs (key). *P = 0.0006, CD38+ cells, or P < 0.0001, CD39+ cells (paired Student’s two-tailed t-test). Each symbol (bd) represents an individual patient (b) or sample (c,d); small horizontal lines (c) indicate the mean (± s.e.m.); diagonal lines (d) connect data from the same patient (n = 11 donors). Data are from one experiment (ac) or are representative of six experiments (d, left) or eleven experiments (d, right).

Comment in

References

    1. Pardoll DM. The blockade of immune checkpoints in cancer immunotherapy. Nat Rev Cancer. 2012;12:252–264. - PMC - PubMed
    1. Drake CG, Lipson EJ, Brahmer JR. Breathing new life into immunotherapy: review of melanoma, lung and kidney cancer. Nat Rev Clin Oncol. 2014;11:24–37. - PMC - PubMed
    1. Garon EB, et al. Pembrolizumab for the treatment of non-small-cell lung cancer. N Engl J Med. 2015;372:2018–2028. - PubMed
    1. Sharma P, Allison JP. Immune checkpoint targeting in cancer therapy: toward combination strategies with curative potential. Cell. 2015;161:205–214. - PMC - PubMed
    1. Tumeh PC, et al. PD-1 blockade induces responses by inhibiting adaptive immune resistance. Nature. 2014;515:568–571. - PMC - PubMed

MeSH terms

Substances