. 2017 Aug;20(8):1180-1188.
doi: 10.1038/nn.4591. Epub 2017 Jun 19.

Dynamic illumination of spatially restricted or large brain volumes via a single tapered optical fiber

Affiliations

Dynamic illumination of spatially restricted or large brain volumes via a single tapered optical fiber

Ferruccio Pisanello et al. Nat Neurosci. 2017 Aug.

Abstract

Optogenetics promises precise spatiotemporal control of neural processes using light. However, the spatial extent of illumination within the brain is difficult to control and cannot be adjusted using standard fiber optics. We demonstrate that optical fibers with tapered tips can be used to illuminate either spatially restricted or large brain volumes. Remotely adjusting the light input angle to the fiber varies the light-emitting portion of the taper over several millimeters without movement of the implant. We use this mode to activate dorsal versus ventral striatum of individual mice and reveal different effects of each manipulation on motor behavior. Conversely, injecting light over the full numerical aperture of the fiber results in light emission from the entire taper surface, achieving broader and more efficient optogenetic activation of neurons, compared to standard flat-faced fiber stimulation. Thus, tapered fibers permit focal or broad illumination that can be precisely and dynamically matched to experimental needs.


Conflict of interest statement

Conflict of interest

MDV, FP, BS, SD, and LS, authors on this study, are co-founders of Optogenix LLC, a company based in Italy that produces and markets the tapered fibers described here.

Figures

Figure 1
Figure 1. Emission properties of TFs
a, Schematic representation of a typical TF geometry (NA=0.39, taper angle ψ=2.9°, taper length 4.4 mm, core/cladding diameters 200/225 µm). b, Ray tracing simulations of emission from the taper tip resulting from injecting a single ray in the fiber at different angles. c, Ray distributions resulting from injecting light using the full NA of the fiber. d, top, Image of fluorescence generated by light emitted from tapered fibers with the specified geometries immersed in a fluorescein solution. bottom, The graphs depict calculated (black) and measured (red) emission lengths (evaluated as the full width at half maximum L0.5) for 0.22 NA and 0.39 NA TFs as a function of the taper angle. 0.22 NA TFs have core/cladding diameters of 50/125 µm, whereas 0.39 NA TFs have core/cladding diameters of 200/225 µm.
Figure 2
Figure 2. Emission properties of TFs in brain slices
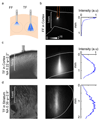
a, Schematic of light delivery in brain tissue through FFs and TFs. b, left, Image of fluorescence induced by light emission from an FF implanted into cortex in a fluorescein impregnated brain slice. Gray scale represents fluorescence intensity in arbitrary units of a linear scale. right, Normalized fluorescence intensity profile in the tissue starting from the fiber end face c and d, Bright field images (left) to identify the position of the TFs in the fluorescein impregnated cortical or striatal brain slice used for acquisition of the fluorescence images (middle). Gray scale is the same as in (b). right, Normalized profiles of fluorescence intensities beside the taper, starting from the first emission point.
Figure 3
Figure 3. In vivo examination of effective excitation in striatum
a, Schematic of experimental preparation showing a TF inserted into the striatum of a mouse expressing ChR2 in indirect pathway SPNs (iSPNs). b, c-fos expression (red) in the striatum (coronal section, 0.85 mm anterior to Bregma) of an animal expressing ChR2-YFP in iSPNs (green) after light stimulation delivered by a TF in lateral (left) or medial (right) striatum. DAPI is shown in blue. Representative image of two independent replicates. c, Schematic of experimental preparation as in (a) showing placement of a flat-faced fiber (FF). d, As in (b) showing c-fos induction by light delivery from a FF in dorsal (left, 0.22 NA) or ventral (right, 0.39 NA) striatum. Representative image of two independent replicates.
Figure 4
Figure 4. Optogenetic manipulation of motor cortex with TFsc
a, Schematic of the experimental preparation. A 16 channel multi-electrode array is placed in primary motor cortex of a VGAT-ChR2 BAC transgenic mouse and maintained throughout the experiment. Units are recorded throughout cortical layers. A TF or FF in either a shallow or deep position is placed in cortex. The firing rates of individual units are compared during the basal period or during 50 ms optogenetic excitation cortical GABAergic interneurons b, Average normalized firing rates (black line with shaded area showing SEM) across cells with and without light (top) and pseudo-colored representations of normalized across-trial average firing rate of each unit as a function of time (bottom). The color scale (“Rainbow” in Igor Pro) indicates relative firing rates of each cell (0=dark blue to 3=red) normalized to its baseline (0-50 ms). The period of light delivery (50 ms) is shown in the cyan shaded regions. Data (n-values 45, 49, 51, 51, 28, 28, 28, 28, 48, 49, 49, and 49 cells) are shown for each fiber configuration (left: TF, middle: FF shallow, right: FF deep) and at 4 power levels (10, 50, 100, and 200 μW total emission from the fiber before implantation in the brain.
Figure 5
Figure 5. Site selective light delivery with TFs
a, Light delivery geometry for several values of light injection angle θ with a 0.22NA/ψ=2.2° TF into a fluorescein solution. Gray scale represents fluorescence intensity in arbitrary units and is the same for all panels. b, Light delivery geometry for several values of light injection angle θ with a 0.39 NA/ψ =2.9° TF into a fluorescein solution. c, Total Output power for a fixed input of 2.25 mW for TFs with 0.22 NA/ψ=2.2° TF (red line) and 0.39 NA/ψ=2.9° TF (black line) d, Site selective light delivery with a 0.22 NA/ψ=2.2° TF implanted into the cortical region of a fluorescently stained mouse brain slice. e, Normalized fluorescence intensity profiles, measured beside the taper, from the fluorescence images in (d). f, Site selective light delivery with a 0.39NA/ ψ=2.9° TF implanted into the striatum of a fluorescently stained mouse brain slice. g, Normalized fluorescence intensity profiles, measured beside the taper, from the fluorescence images in (f).
Figure 6
Figure 6. Selective light delivery with TFs in the open field
a, Schematic of optical setup. The output of a polarized laser was passed through a ½-wave plate (hwp) to rotate the polarization before entering a polarizing beam cube (pbc) that transmits and reflects, respectively, horizontally and vertically polarized light. Rotation of the hwp determines the fraction of laser light entering each path. Each of the laser paths is directed to a 2-inch collection lens via a sliding mirror (sm1 and sm2) that can be moved linearly to determine the launch angle into the first fiber-optic patch cord (fopc1). b, Fiber optic patch cable (fopc1) was connected from the optical pathway shown in (a) to a commercial optical commutator from which a second fiber optic patch cable (fopc2) led to the TF implanted in the animal. A camera above the arena monitored the location and depth of the mouse. c, The TF was implanted in the striatum (0.85A, 1.4L, 4.1D) of a transgenic animal expressing ChR2-YFP in iSPNs to allow for stimulation of two regions of striatum. Light input at θ1 (magenta) and θ2 (orange) angles resulted in emission that targeted the ventral and dorsal striatum, respectively. d, Example of stimulation paradigm in the open field arena on day 1. Animals spent a total of 27 min in the open field with 3 min sessions of either no light, light on at angle θ1, or light on angle at θ2. On a subsequent day of analysis the order of θ1 and θ2 stimulation were reversed. e, Snapshot of a mouse in the open field with an overlaid vector highlighting the simple feature extraction of position and orientation. f, Example of the positions of one mouse during 3-minute session of no stimulation (left), ventral stimulation (θ1,middle), and dorsal stimulation (θ2,right). g, Quantification of distance traveled in the 3 conditions for the example mouse shown in (f). Significant differences were observed between the no stimulation (left), ventral stimulation (middle) and the dorsal stimulation (right) conditions. Bars indicate the means of all data points from individual 3 min blocks, which are shown by the circles (not filled: day 1; filled: day 2). *p = 0.028, **p=0.002, using a two-tailed Mann-Whitney U test.
Figure 7
Figure 7. Mapping sub-second structure of behavior during optogenetic manipulation of ventral or dorsal striatum
a, Snapshot of a mouse in the open field with the height of the body at each pixel indicated by the color scale. b, The percent total behavior data (same mouse as in Figure 6) explained in each condition (ns, θ1, and θ2stimulation) by the major pause related (black) syllables (1 and 2), the major movement-related (green) syllables (3-14) and all other syllables (white). c, Percent expression of the dominant non-pause, i.e. movement related, syllables (3-14), showing differential expression of syllables across stimulation conditions. d, The trajectories of the head and tail of the mouse relative to its body center for syllable 6 (left) and syllable 7 (right) in either the ventral (θ1, magenta) and dorsal (θ2, orange) stimulation conditions. The black dots depict the starting point of each of the aligned trajectories of the head and tail. All (limited to 100) instances of the trajectories of the head and tail relative to its body center are shown.

References

    1. Dawydow A, et al. Channelrhodopsin-2–XXL, a powerful optogenetic tool for low-light applications. Proceedings of the National Academy of Sciences. 2014;111:13972–13977. - PMC - PubMed
    1. Hochbaum DR, et al. All-optical electrophysiology in mammalian neurons using engineered microbial rhodopsins. Nat Meth. 2014;11:825–833. - PMC - PubMed
    1. Govorunova EG, Sineshchekov OA, Janz R, Liu X, Spudich JL. Natural light-gated anion channels: A family of microbial rhodopsins for advanced optogenetics. Science. 2015;349:647–650. - PMC - PubMed
    1. Lee J, Ozden I, Song Y-K, Nurmikko AV. Nat Meth. advance online publication; 2015. Transparent intracortical microprobe array for simultaneous spatiotemporal optical stimulation and multichannel electrical recording. - PubMed
    1. Canales A, et al. Multifunctional fibers for simultaneous optical, electrical and chemical interrogation of neural circuits in vivo. Nat Biotech. 2015;33:277–284. - PubMed

LinkOut - more resources