. 2017 Aug;49(8):1192-1201.
doi: 10.1038/ng.3898. Epub 2017 Jun 19.

Germline hypomorphic CARD11 mutations in severe atopic disease

Affiliations

Germline hypomorphic CARD11 mutations in severe atopic disease

Chi A Ma et al. Nat Genet. 2017 Aug.

Erratum in

  • Corrigendum: Germline hypomorphic CARD11 mutations in severe atopic disease.
    Ma CA, Stinson JR, Zhang Y, Abbott JK, Weinreich MA, Hauk PJ, Reynolds PR, Lyons JJ, Nelson CG, Ruffo E, Dorjbal B, Glauzy S, Yamakawa N, Arjunaraja S, Voss K, Stoddard J, Niemela J, Zhang Y, Rosenzweig SD, McElwee JJ, DiMaggio T, Matthews HF, Jones N, Stone KD, Palma A, Oleastro M, Prieto E, Bernasconi AR, Dubra G, Danielian S, Zaiat J, Marti MA, Kim B, Cooper MA, Romberg ND, Meffre E, Gelfand EW, Snow AL, Milner JD. Ma CA, et al. Nat Genet. 2017 Oct 27;49(11):1661. doi: 10.1038/ng1117-1661b. Nat Genet. 2017. PMID: 29074947

Abstract

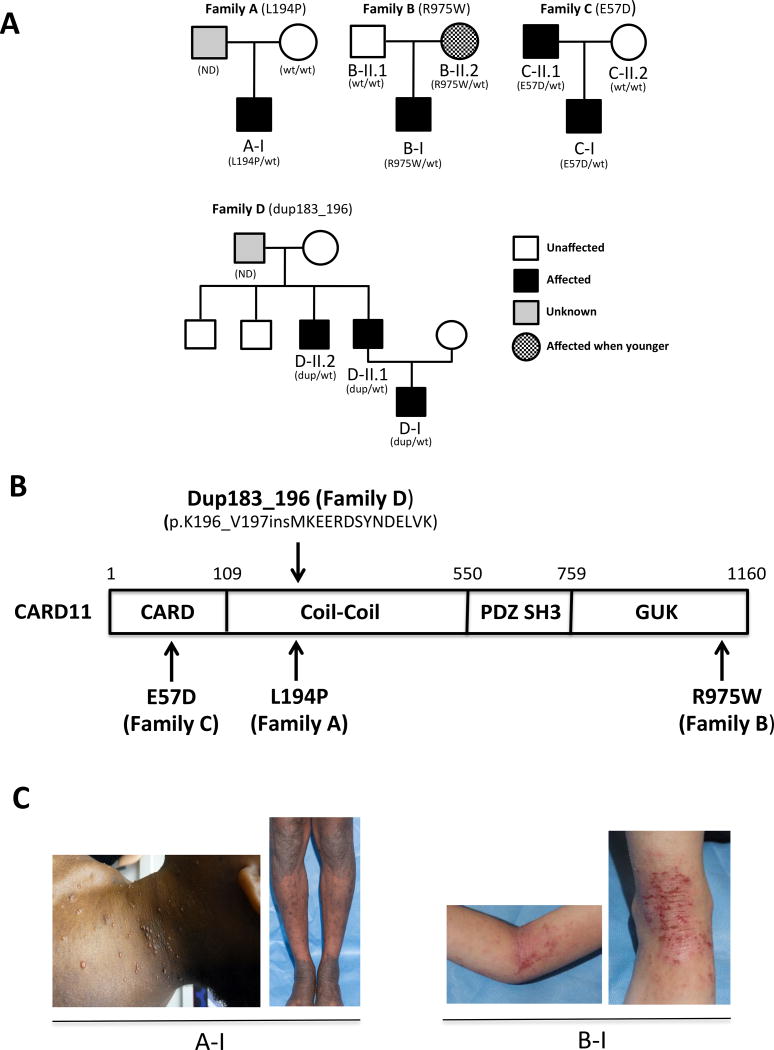
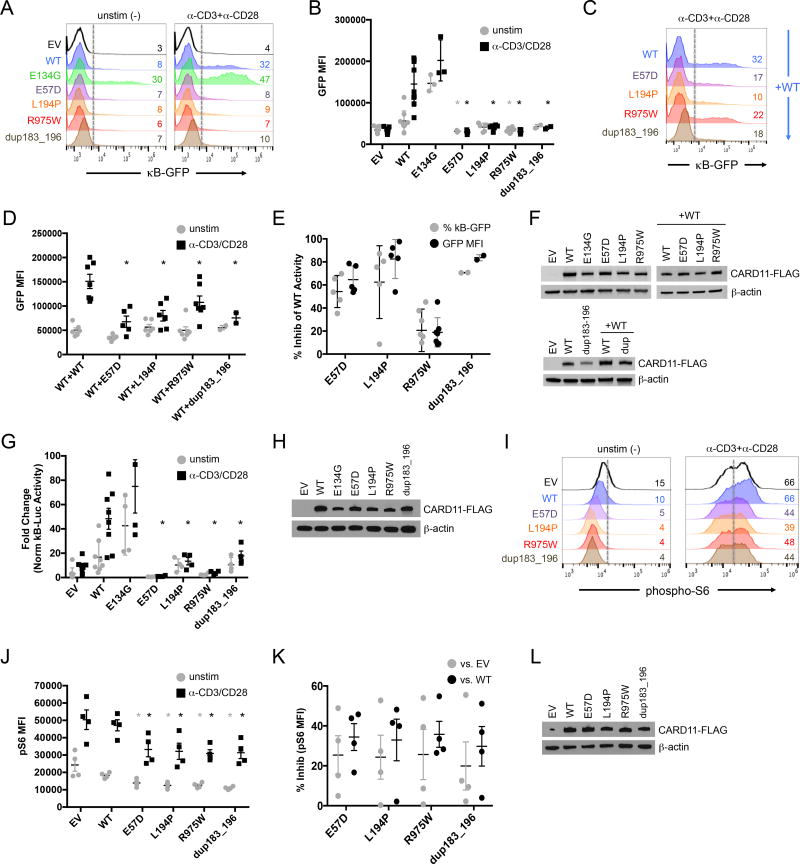
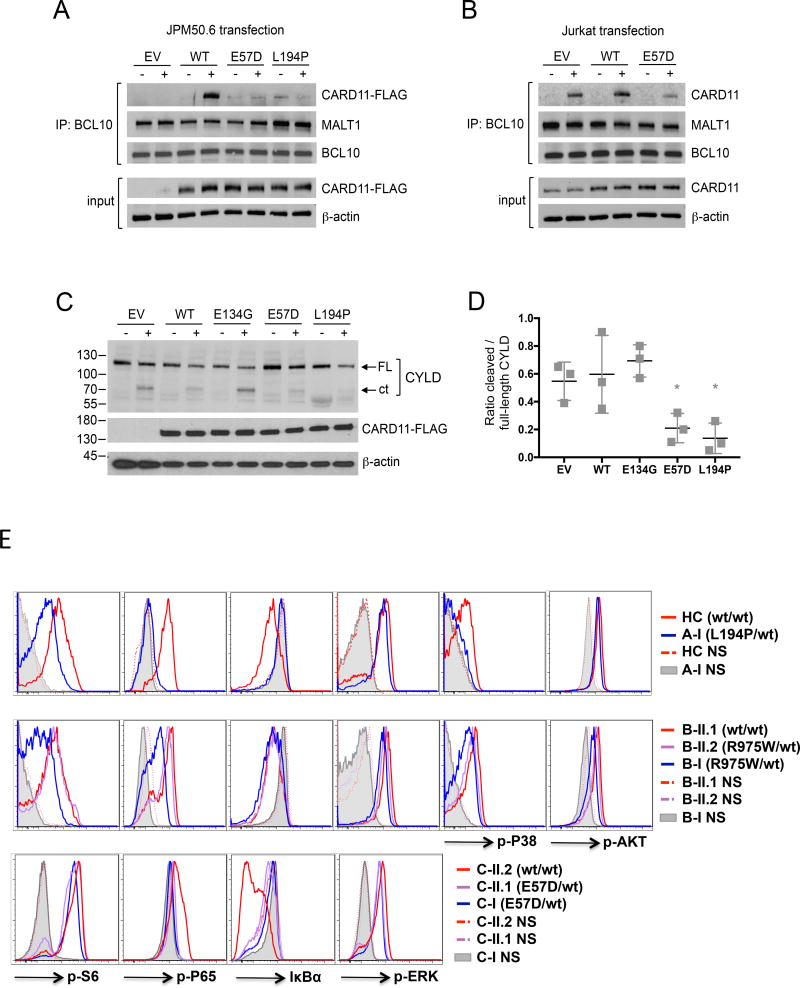
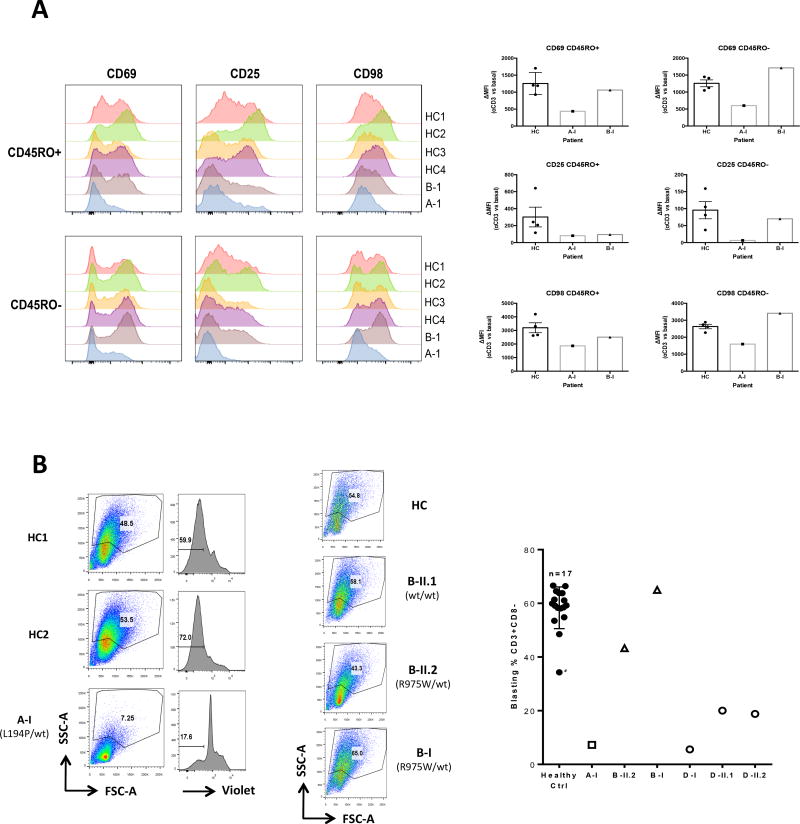
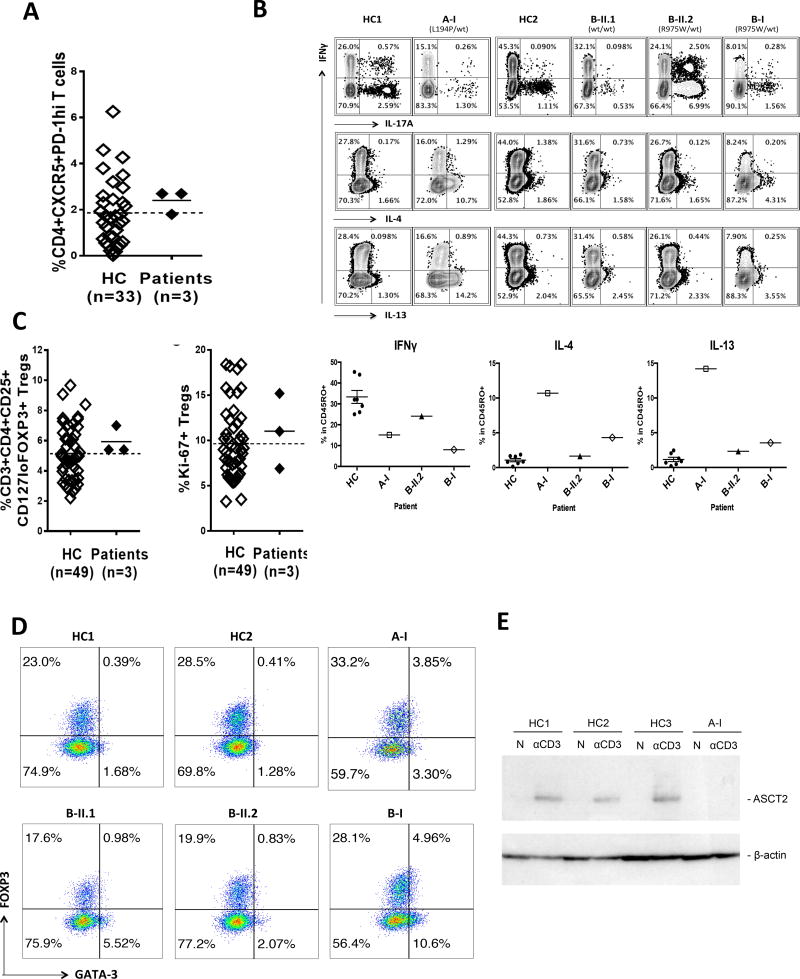
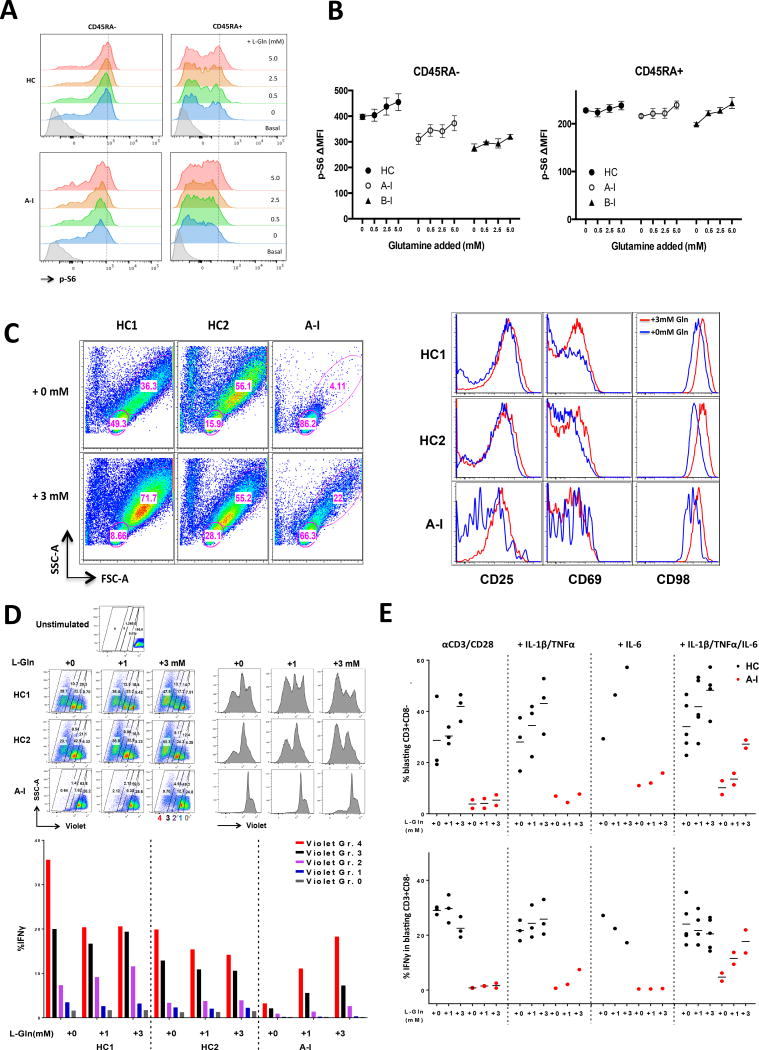
Few monogenic causes for severe manifestations of common allergic diseases have been identified. Through next-generation sequencing on a cohort of patients with severe atopic dermatitis with and without comorbid infections, we found eight individuals, from four families, with novel heterozygous mutations in CARD11, which encodes a scaffolding protein involved in lymphocyte receptor signaling. Disease improved over time in most patients. Transfection of mutant CARD11 expression constructs into T cell lines demonstrated both loss-of-function and dominant-interfering activity upon antigen receptor-induced activation of nuclear factor-κB and mammalian target of rapamycin complex 1 (mTORC1). Patient T cells had similar defects, as well as low production of the cytokine interferon-γ (IFN-γ). The mTORC1 and IFN-γ production defects were partially rescued by supplementation with glutamine, which requires CARD11 for import into T cells. Our findings indicate that a single hypomorphic mutation in CARD11 can cause potentially correctable cellular defects that lead to atopic dermatitis.


Conflict of interest statement

Conflict of interest disclosure

The authors declare no conflict of interests.

Figures

Figure 1
Figure 1. Novel heterozygous CARD11 mutations in the severe atopic dermatitis families
(A) Pedigrees of the families who have the novel CARD11 mutations. (B) CARD11 protein domains and the position of CARD11 mutations found in the families. (C) Representative patient photographs depicting molluscum contagiosum in A-I (left) and atopic dermatitis in patients A-I (right) and B-I.
Figure 2
Figure 2. Atopy-associated CARD11 mutations are hypomorphic and dominantly interfere with WT CARD11 signaling to NF-κB and mTORC1
(A) Flow cytometric histograms measuring NF-κB-driven GFP reporter expression in CARD11-deficient JPM50.6 cells transfected with empty vector (EV), WT, or mutant CARD11 constructs, ± anti-CD3/CD28 stimulation for 24 hr. (B) Quantification of NF-κB-driven GFP reporter expression in transfected JPM50.6 cells (mean fluorescence intensity (MFI) of GFP+ cells). Data are mean ± SEM over 8 separate experiments (EV/WT n=8; E134G n=3); E57D/L194P/R975W n=5; dup183_196=2). Asterisks denote statistically significant differences (Student’s t-test) for each LOF mutant versus WT ± stimulation (E57D p=0.008, 8.5×10⁻⁵ (±stim); L194P p=0.065, 1.7×10⁻⁴; R975W p=0.013, 8.8×10⁻⁵; dup183_196 p=0.08, 1.6×10⁻⁴). (C) Flow cytometric histograms for JPM50.6 cells transfected with WT CARD11 plus WT or mutant constructs and stimulated as in (A). (D) GFP MFI (mean ± SEM for 5 separate experiments) for JPM50.6 cells transfected in (C); asterisks denote significance versus stimulated WT+WT (E57D p=6.1×10⁻⁴; L194P p=1.4×10⁻³; R975W p=0.024; dup183_196 p=4.1×10⁻³). (E) Percent inhibition of WT CARD11 activity (mean ± SD) in (D) calculated for each mutant, based on the change in %GFP+ cells (black) or GFP MFI (gray) ± stimulation. (F) Cropped immunoblot for CARD11-FLAG expression in transfected JPM50.6 lysates (A,C); β-actin serves as a loading control. Data representative of 3 independent experiments. (G) NF-κB-driven luciferase activity in WT Jurkat cells transfected with CARD11 constructs plus luciferase reporter plasmids. Data represent fold change (mean ± SD) in B-driven luciferase activity ± 24 hr stimulation, normalized to Renilla luciferase activity over 8 separate experiments (EV/WT n=8; E134G/E57D/L194P/R975W/dup183_196 n=4). Asterisks denote significance for each LOF mutant versus WT in stimulated cells (E57D p=4.7×10⁻⁴; L194P p=2.3×10⁻³; R975W p=6.7×10⁻⁵; dup183_196 p=5.1×10⁻³). (H) Cropped immunoblot for CARD11-FLAG expression in transfected Jurkat lysates (G). Data representative of 3 independent experiments. (I) Flow cytometric histograms measuring phospho-S6 in Jurkat cells transfected as above ± anti-CD3/CD28 stimulation for 20 min. (J) Quantification of phospho-S6 (MFI) in transfected Jurkat cells. Data are mean ± SEM for 4 separate experiments. Asterisks denote significance for each LOF mutant versus EV or WT ± stimulation (see p values in Methods). (K) Percent inhibition of pS6 signal (mean ± SEM) for each mutant versus EV (gray) or WT (black) transfected cells in (B), based on the change in pS6 MFI ± stimulation. (L) Cropped immunoblot for CARD11-FLAG expression in transfected Jurkat lysates (B). Data representative of 2 independent experiments.
Figure 3
Figure 3. Impaired CBM complex formation leads to defective signaling in CARD11mut patient T cells
(A) BCL10 immunoprecipitates from JPM50.6 cells transfected with EV, WT, E57D, and L194P CARD11 mutants ± 15 min PMA/ionomycin stimulation were immunoblotted to detect association of CARD11-FLAG, MALT1, and BCL10. Input lysates (bottom) were immunoblotted with FLAG and β-actin to confirm equivalent CARD11-FLAG expression. Data representative of 3 independent experiments. (B) BCL10 immunoprecipitates from WT Jurkat cells transfected with EV, WT, or E57D CARD11 mutants −/+ 15 min PMA/ionomycin stimulation were immunoblotted as above. Data representative of 2 independent experiments. (C) Lysates from transfected Jurkat cells −/+ 2 hr PMA/ionomycin stimulation were immunoblotted to detect MALT1-dependent cleavage of CYLD and CARD11-FLAG expression. FL=full-length, ct = C-terminal fragment. (D) Spot densitometric quantitation of the ratio of cleaved (ct) to full length CYLD in immunoblots represented in (C); data are mean ± SD of 3 independent experiments. Asterisks denote significance versus stimulated EV (E57D p=0.028; L194P p=0.016. (E) Flow cytometric assay of CARD11mut patient CD4+ T cells compared with unaffected family members (wt/wt) vs. healthy controls (HC) stimulated with PMA for 20 min (2 ng/mL for p-S6 and p-AKT, 5 ng/mL for p-P65, IκBα, p-P38 and p-ERK on Family A and B; 10 ng/mL on Family C, NS: no stimulation). Data representative of three independent experiments for A-I, two for Family B, and one for Family C.
Figure 4
Figure 4. Decreased surface expression of activation markers and defective proliferation following TCR stimulation in CARD11mut patients
(A) Flow cytometric measurement of expression of the surface activation markers CD69, CD25, and CD98 in healthy control (HC) vs. A-I and B-I patient naïve (CD45RO) and activated/memory (CD45RO+) CD4 cells after anti-CD3 stimulation for 16 hours. Graphs shown at right indicate ΔMFI for each marker between stimulated vs. untreated samples (HC, n=4; mean±SEM; patients, n=1). (B) Blastogenesis and/or proliferation of PBMCs from representative healthy control (HC) vs. CARD11 patients after anti-CD3/CD28 activation for 5 days. CellTrace Violet (Violet) staining was used for tracking the number of the cell divisions. Quantitation of blasting CD3+CD8− cells for HC (mean ± SEM, n=17), A-I (n=2), B-I, D-I, D-II.1, D-II.2 (n=1 for each) is graphed at right. Asterisk denotes travel control included with family D.
Figure 5
Figure 5. Impaired IFN-γ, augmented Th2 cytokine productions and Treg phenotype in CARD11mut patients
(A) CXCR5+ PD-1hi peripheral cTFH cells in CARD11 mutated patients. (B) Top: Flow cytometry for intracellular cytokine staining of PBMCs after PMA/ionomycin stimulation. Bottom: Quantitation of IFN-γ+, IL-4+, and IL-13+ CD4+ CD45RO+ T cells. (HC, n=7, mean ± SEM; patients, n=1). (C) Quantitation of FOXP3+CD25+CD127lo Tregs (left), including Ki-67+ Tregs (right), in HC vs. patients. (D) Measurement of GATA3 expression in Tregs among CD45RO+ CD127low CD4 T cells for family members possessing CARD11 mutations vs. healthy controls (HC). (E) Immunoblot showing impaired expression of ASCT2 in purified naïve CD4 T-cells from patient A-I relative to HC (n=3) after 48 hours with plate-bound anti-CD3 (N: non-stimulated).
Figure 6
Figure 6. Glutamine supplementation in combination with cytokines can partially restore the TCR-induced proliferation and IFN-γ defects in a CARD11mut patient
(A) Improved phospho-S6 activation by PMA after addition of glutamine. PBMC from the HC and CARD11 patient were rested in media then PBS supplemented with glutamine (L-Gln) and stimulated with PMA. Phospho-S6 was measured by intracellular flow cytometric staining of CD4 CD45RA- memory and CD45RA+ naïve T-cells. The dashed line indicates the maximum phospho-S6 activation peak (MFI) by PMA with 5mM glutamine addition in HC. (B) ΔMFI plot (PMA treated vs. untreated) for phospho-S6 in (A) (HC, n=5; three independent experiments for A-I and two for B-I; mean±SEM). (C) Left: Increased proliferation of CD4+ naive T cells isolated from patient A-I patient in serum-free medium stimulated with anti-CD3/CD28 and cytokines (IL-1β, TNFα, and IL-6) for 5 days with glutamine supplementation. Right: Increased surface activation marker expression with glutamine addition plus cytokines in patient A-I (gated on FSChiSSChi blasts from the left panel). Data are representative of three experiments. (D) Top: Impaired naive CD4+ T cell proliferation was partially restored by anti-CD3/CD28 stimulation with excess glutamine and cytokines IL-1β, TNFα, and IL-6 in patient A-I. Bottom: Rescue of IFN-γ expression was proliferation dependent. Dividing cells were gated into four groups based on CellTrace Violet intensity (top left), and IFN-γ was measured by intracellular staining in each group (bottom). Data are representative of two independent experiments. (E) Quantification of the percentage of proliferative CD3+CD8 blasts (top), and the percentage of IFNγ-producing CD3+CD8 blasts (bottom) with the treatments by increasing glutamine concentration. Data combined of the experiments: αCD3/CD28: HC (n=3), A-I (n=2); +IL1β/TNFα: HC (n=3), A-I (n=1); +IL-6: HC (n=1), A-I (n=1); + IL1β/TNFα/IL-6: HC (n=5), A-I (n=2).

References

    1. Mogensen TH. Primary Immunodeficiencies with Elevated IgE. Int Rev Immunol. 2016;35:39–56. - PubMed
    1. Freeman AF, Olivier KN. Hyper-IgE Syndromes and the Lung. Clin Chest Med. 2016;37:557–67. - PMC - PubMed
    1. Chan SK, Gelfand EW. Primary Immunodeficiency Masquerading as Allergic Disease. Immunol Allergy Clin North Am. 2015;35:767–78. - PubMed
    1. Bonnelykke K, Sparks R, Waage J, Milner JD. Genetics of allergy and allergic sensitization: common variants, rare mutations. Curr Opin Immunol. 2015;36:115–26. - PMC - PubMed
    1. Hershey GK, Friedrich MF, Esswein LA, Thomas ML, Chatila TA. The association of atopy with a gain-of-function mutation in the alpha subunit of the interleukin-4 receptor. N Engl J Med. 1997;337:1720–5. - PubMed

MeSH terms