. 2017 Oct 19;36(42):5840-5851.
doi: 10.1038/onc.2017.171. Epub 2017 Jun 19.

Cadherin composition and multicellular aggregate invasion in organotypic models of epithelial ovarian cancer intraperitoneal metastasis

Affiliations

Cadherin composition and multicellular aggregate invasion in organotypic models of epithelial ovarian cancer intraperitoneal metastasis

Y Klymenko et al. Oncogene. .

Abstract

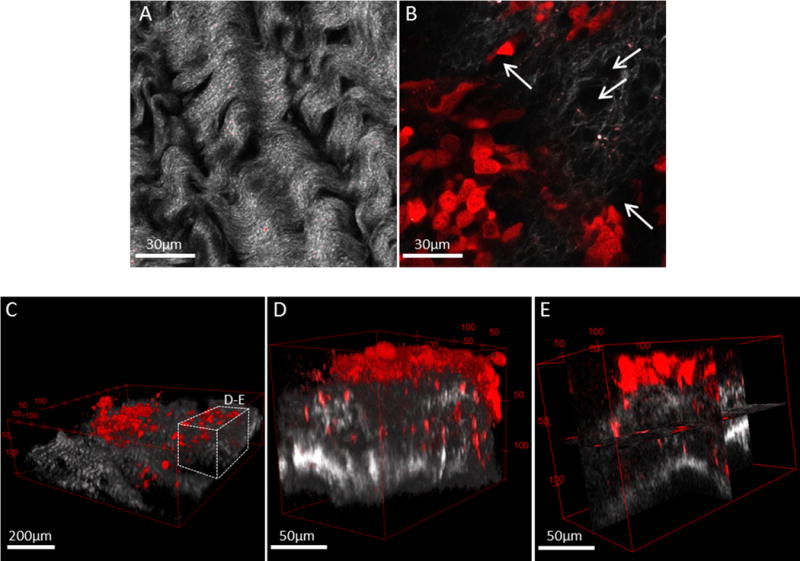
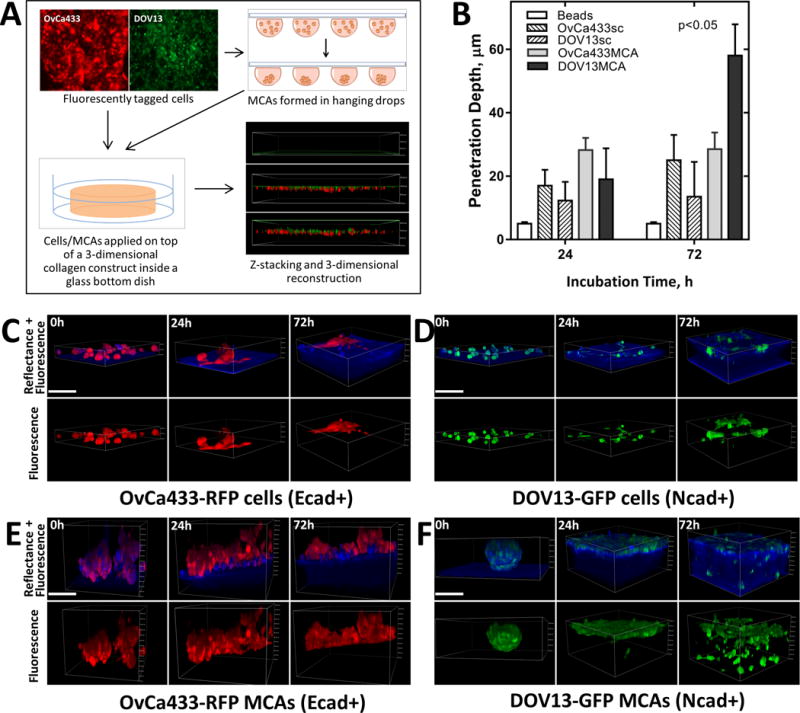
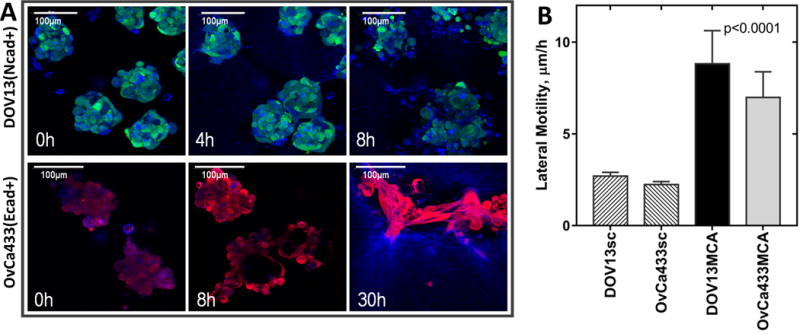
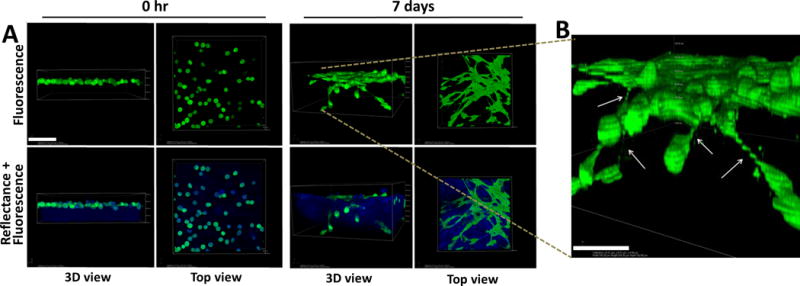
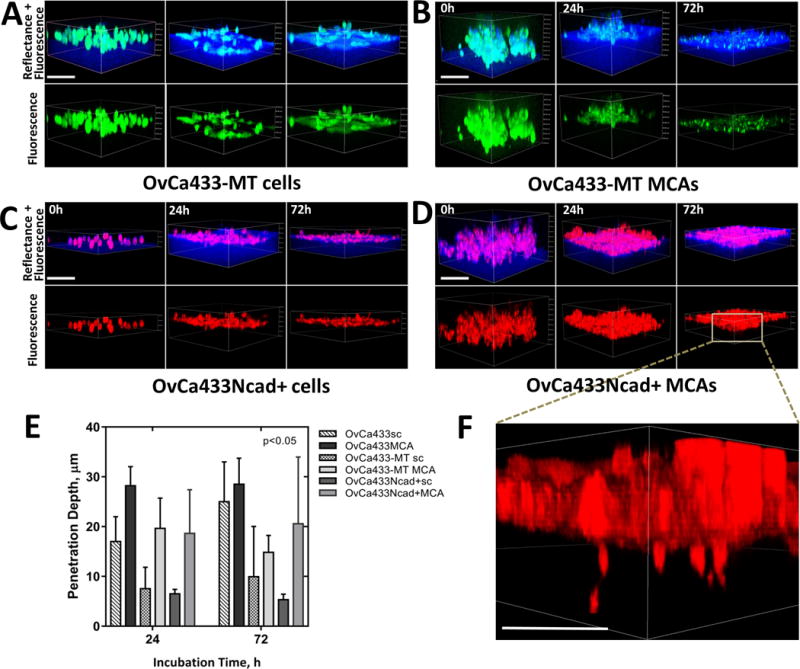
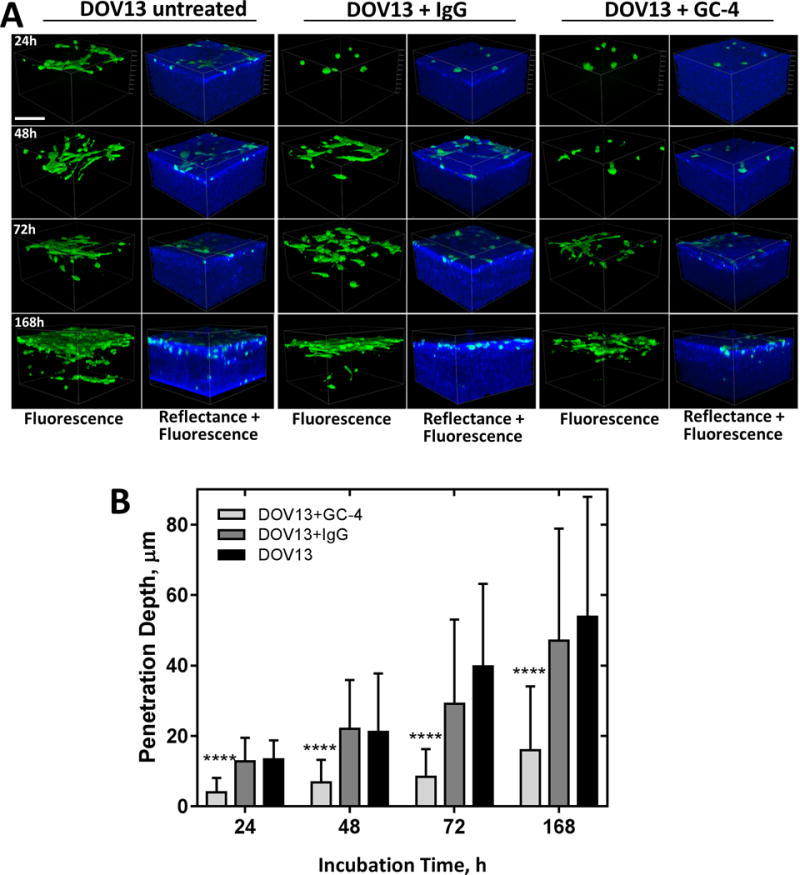
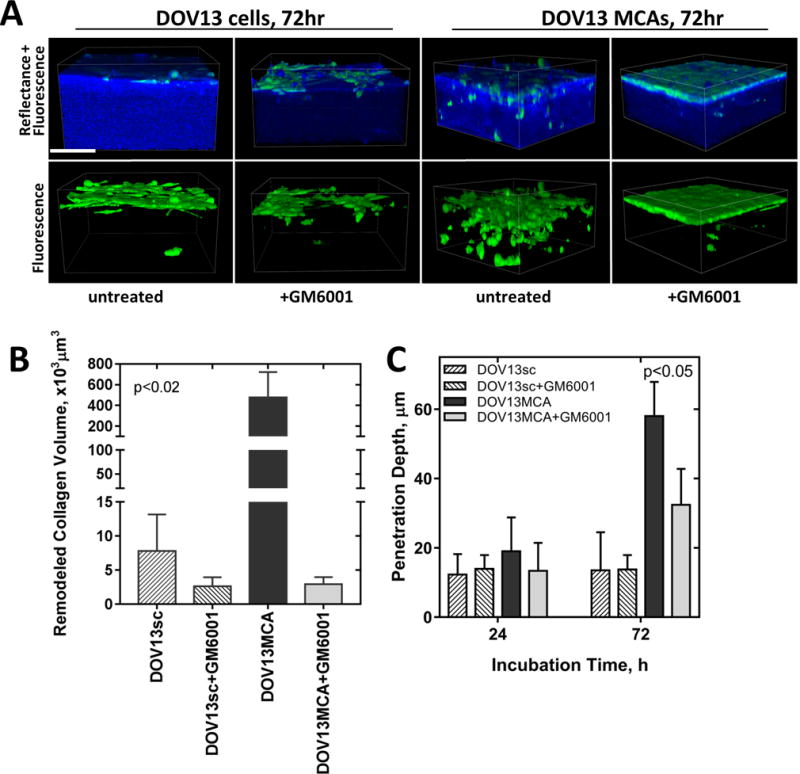
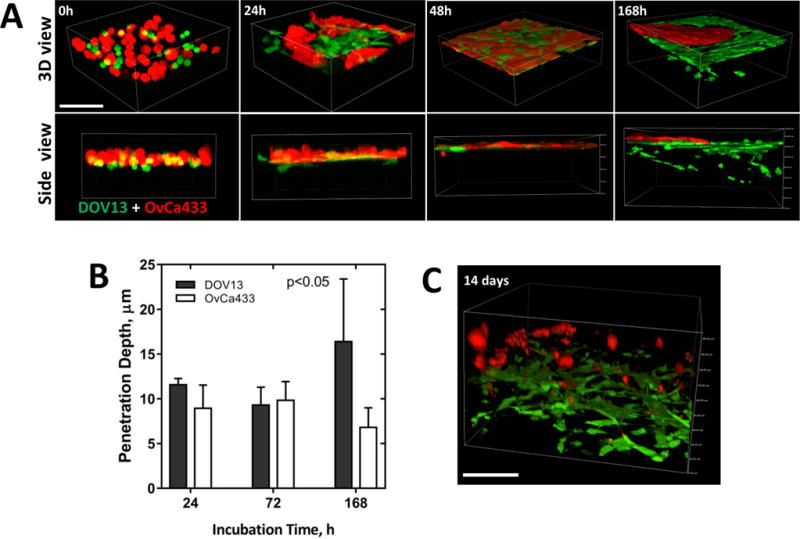
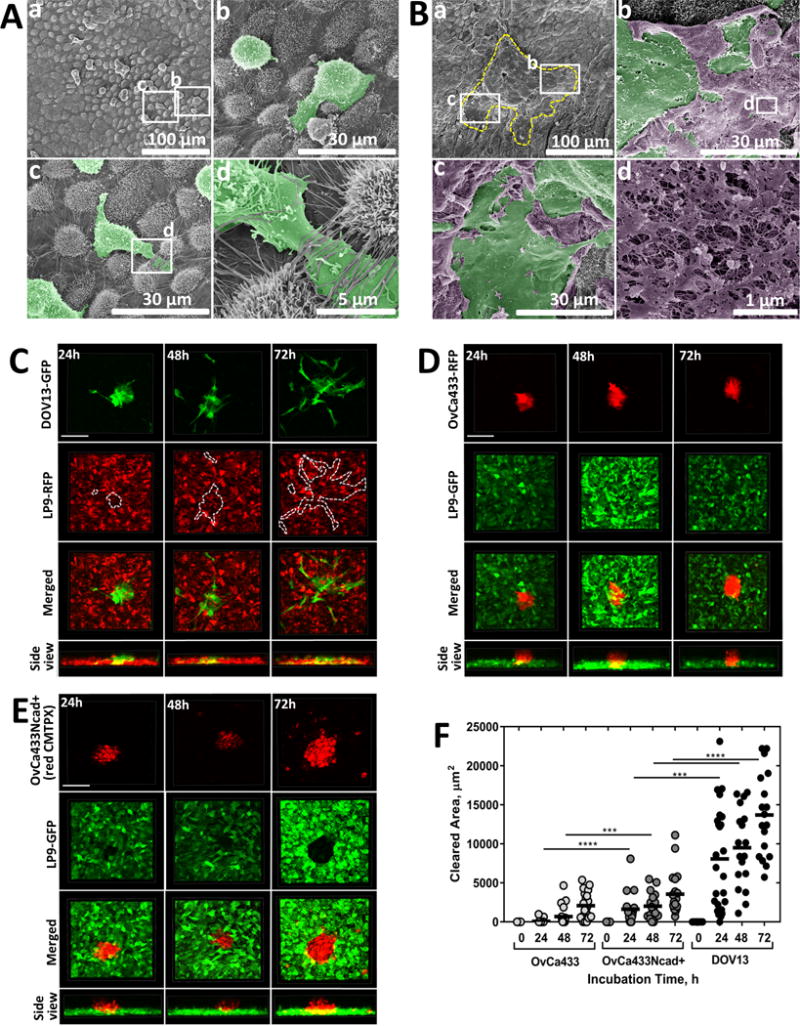
During epithelial ovarian cancer (EOC) progression, intraperitoneally disseminating tumor cells and multicellular aggregates (MCAs) present in ascites fluid adhere to the peritoneum and induce retraction of the peritoneal mesothelial monolayer prior to invasion of the collagen-rich submesothelial matrix and proliferation into macro-metastases. Clinical studies have shown heterogeneity among EOC metastatic units with respect to cadherin expression profiles and invasive behavior; however, the impact of distinct cadherin profiles on peritoneal anchoring of metastatic lesions remains poorly understood. In the current study, we demonstrate that metastasis-associated behaviors of ovarian cancer cells and MCAs are influenced by cellular cadherin composition. Our results show that mesenchymal N-cadherin-expressing (Ncad+) cells and MCAs invade much more efficiently than E-cadherin-expressing (Ecad+) cells. Ncad+ MCAs exhibit rapid lateral dispersal prior to penetration of three-dimensional collagen matrices. When seeded as individual cells, lateral migration and cell-cell junction formation precede matrix invasion. Neutralizing the Ncad extracellular domain with the monoclonal antibody GC-4 suppresses lateral dispersal and cell penetration of collagen gels. In contrast, use of a broad-spectrum matrix metalloproteinase (MMP) inhibitor (GM6001) to block endogenous membrane type 1 matrix metalloproteinase (MT1-MMP) activity does not fully inhibit cell invasion. Using intact tissue explants, Ncad+ MCAs were also shown to efficiently rupture peritoneal mesothelial cells, exposing the submesothelial collagen matrix. Acquisition of Ncad by Ecad+ cells increased mesothelial clearance activity but was not sufficient to induce matrix invasion. Furthermore, co-culture of Ncad+ with Ecad+ cells did not promote a 'leader-follower' mode of collective cell invasion, demonstrating that matrix remodeling and creation of invasive micro-tracks are not sufficient for cell penetration of collagen matrices in the absence of Ncad. Collectively, our data emphasize the role of Ncad in intraperitoneal seeding of EOC and provide the rationale for future studies targeting Ncad in preclinical models of EOC metastasis.


Conflict of interest statement

CONFLICT OF INTEREST

The authors declare no conflict of interest.

Figures

Figure 1
Figure 1. Murine allograft model of ovarian cancer metastasis demonstrates peritoneal seeding by cancer cells/MCAs with subsequent penetration and remodeling of sub-mesothelial collagen
C57Bl/6 female mice were injected intraperitoneally with ID8-RFP murine EOC cells and sacrificed at 8–10 weeks post injection. The parietal peritoneum was dissected and prepared for combined fluorescence/SHG microscopy as described in Methods. Shown are examples of (A) tumor-free mouse peritoneal explant (collagen, grey) and (B) peritoneal explant (collagen, grey) containing a metastatic lesion (cancer cells, red) exhibiting collagen reorganization and peri-cellular collagen clearance areas (arrows). Scale bars: as indicated. Murine metastatic lesions depict (C) seeding of cancer cells and cell clusters (red) atop of peritoneal collagen layer (grey), (D) 3D volume view and (E) orthoslice view of cancer cells penetrating the sub-mesothelial collagen layer. Scale bars: as indicated.
Figure 2
Figure 2. Cadherin composition impacts matrix invasion by EOC cells and MCAs
A) Overview of collagen invasion live imaging assay. EOC cells are fluorescently tagged with RFP or GFP via lentiviral transduction and applied as either individual cells or pre-formed MCAs on top of a 3D collagen gel (1.5mg/ml collagen concentration in complete medium) inside a glass-bottom dish. Continuous z-stack imaging of cell/MCA dynamics (green or red) and collagen (blue) was performed using confocal fluorescence and reflectance modes, respectively. B–F) Imaging and analysis of collagen invasion. Multiple representative z-stack snapshots of (C) OvCa433-RFP (Ecad+) cells, (D) DOV13-GFP (Ncad+) cells, (E) OvCa433-RFP (Ecad+) MCAs, (F) DOV13-GFP MCAs, and (Suppl. fig. 2) control fluorescent beads were obtained for up to 72h, and depth of penetration depth quantified (Mean±SD, N=100 in three assays);scale bar: 100μm. Statistical significance shown between the penetration depth of each cell line relative to fluorescent beads; p<0.05, Mann-Whitney U test.
Figure 3
Figure 3. EOC individual cells and MCAs exhibit distinct rates of lateral motility
DOV13-GFP (Ncad+) and OvCa433-RFP (Ecad+) individual cells or MCAs were applied on top of a 3D collagen gel construct (1.5mg/ml) inside a glass-bottom dish; 8-hour time-lapse confocal imaging of cell/MCAs (green or red) and collagen matrix (blue) was performed in fluorescent and reflectance modes, respectively. A) Representative images of DOV13-GFP and OvCa433-RFP MCA dynamics are shown at stated time points (scale bars as indicated). B) Evaluation of lateral motility for different cell types (Mean±SD); all assays were repeated in triplicate; statistical significance shown between the lateral motilities of each cell line and fluorescent beads; p<0.05, Mann-Whitney U test.
Figure 4
Figure 4. Lateral motility of mesenchymal-type Ncad+ cells creates an invasion-permissive cell:cell network
Individual DOV13 (Ncad+) cells were applied atop 3D collagen gels (1.5mg/ml) inside a glass-bottom dish, and series of z-stack confocal microscopy images were acquired using fluorescence and reflectance modes to visualize cells (green) and collagen (blue), respectively, during the course of incubation. A) Representative images demonstrate cellular network formation via tip-like cell:cell junctions (top view) and matrix invasion (3D view) by cancer cells after 7 days of incubation. Scale bar: 100μm. B) A magnified 3D volume view depicts cellular junctions between invading cells and adjacent superficially located cells (indicated by arrows). Scale bar: 50 μm.
Figure 5
Figure 5. Acquisition of MT1-MMP or Ncad by Ecad+ EOC cells is not sufficient to induce matrix invasion
Ecad+ OvCa433MT1 and OvCa433Ncad+ cells were transiently stained with green CMFDA or red CMTPX CellTracker dyes, respectively, as described in Methods, applied atop 3D collagen gels (1.5mg/ml) inside a glass-bottom dish as individual cells (A and C) or MCAs (B and D), and imaged in confocal fluorescence (cancer cells, green or red) and reflectance (collagen, blue) modes over the course of incubation. Scale bars: 100μm. E) Matrix invasion by cells evaluated in terms of cell penetration depth changes with incubation time (M±SD, N=100 single cells and 30 MCAs of three assays). Statistical significance shown between the penetration depths of each cell type and passive beads; p<0.05, Mann-Whitney U test. F) Enlarged 3D view of OvCa433Ncad+ MCA dispersed on collagen after 72h of incubation is shown. Scale bar: 50μm.
Figure 6
Figure 6. Blocking Ncad suppresses matrix invasion
A) Individual Ncad+ DOV13 cells were applied on top of a 3D collagen gel (1.5mg/ml) inside a glass-bottom dish, and incubated in the presence of Ncad-blocking antibody clone GC-4 (200μg/ml), isotype control IgG (200μg/ml), or no drug, as detailed in Methods. Representative reconstructed 3D images of cancer cells (green, fluorescence mode) and collagen matrix (blue, reflectance mode) acquired after 0h, 24h, 72h, and 7 days of incubation. Scale bar: 100μm. B) Evaluation of matrix invasion by EOC cells at different time points of incubation in terms of penetration depth changes (M±SD, N=100). Statistical significance shown between the penetration depths of each cell type and passive beads; ****p<0.0001, Mann-Whitney U test.
Figure 7
Figure 7. Inhibition of MT1-MMP modulates matrix invasion and collagen remodeling by EOC cells
A) Individual Ncad+ DOV13 cells (that endogenously express MT1-MMP) were applied atop 3D collagen gels (1.5mg/ml) inside a glass-bottom dish, and incubated with the broad spectrum MMP inhibitor GM6001 (25μM) or with no inhibitor, as detailed in Methods. Nikon A1R-MP confocal microscope was used for continuous z-stack imaging of cancer cells (green, fluorescence mode) and collagen (blue, reflectance mode). Representative images at 72h incubation time point are shown. Scale bar: 100μm. Evaluation of (B) peri-cellular collagen remodeling after 72hr of incubation, and (C) cell penetration depth at 24 and 72h. All assays were repeated in triplicate and statistical analysis was performed using Mann-Whitney U test. Statistical significance is shown for Ovca433MT1-MMP and OvCa433Ncad+ with respect to OvCa433 invasiveness.
Figure 8
Figure 8. Cadherin-dependent sorting of EOC cells does not promote collective migration
Ncad+ DOV13 and Ecad+ OvCa433 cells were applied atop 3D collagen gels (1.5mg/ml) inside a glass-bottom dish, and series of z-stack confocal images were acquired to observe cell-cell and cell-collagen interactions up to 14 days of incubation. Fluorescent and reflectance confocal modes were utilized to image cells (red, green) and collagen matrix (blue), respectively. A) Representative images of sorting and homotypic network formation (top view) and collagen invasion (3D view) at stated time points. Scale bar: 100μm. B) Evaluation of penetration depth of cell populations (M±SD, N=100 of three assays). Statistical significance is shown between the penetration depths of each cell line type and passive beads; p<0.05, Mann-Whitney U test. C) A representative 3D volume view of cellular dynamics after 14 days of incubation. Scale bar: 100μm.
Figure 9
Figure 9. Cadherin composition impacts mesothelial clearance in intact tissue explants and organotypic meso-mimetic cultures
(A–B) Ex vivo peritoneal adhesion and mesothelial clearance. Murine peritoneal tissue explants were dissected and pinned ‘mesothelium-side-up’ on optically clear silastic resin as described in Methods and incubated with (A) DOV13 cells (2h) or (B) DOV13 MCAs (4h). Explants were rinsed with ice-cold PBS 3 × 3 min, subjected to SEM processing and imaged with FEI-Magellan 400 field emission microscope (scale bars as indicated). For clarity of visualization, DOV13 cells (Ab–d) and MCAs (Bb–c) are pseudo-colored green while ruptured mesothelial cells are pseudo-colored purple (Bb–d). The yellow dashed line in (Ba) depicts the borders of the dispersed MCA in the lower magnification image while the white rectangles identify areas magnified in (Bb) and (Bc), respectively. The white rectangle in panel (Bb) identifies the area of ruptured mesothelium magnified in (Bd). (C–E) Imaging of MCA mesothelial clearance using in vitro meso-mimetic cultures. (C) DOV13-GFP, (D) OvCa433-RFP or (E) CMTPX-stained OvCa433Ncad+ MCAs were applied on top of (C) RFP-tagged or (D–F) GFP-tagged LP9 mesothelial cell layers grown in 35mm glass-bottom dishes to 100% confluence, and subsequent MCA dispersal and mesothelial clearance activity (indicated by dotted line for DOV13 MCAs, visually detectable for OvCa433 and OvCa433Ncad+ MCAs) were observed using confocal microscopy during the course of incubation. (F) Mesothelial clearance was quantified in terms of the LP9 cell area cleared by the individual EOC MCAs for different incubation time points (M±SD, N=16); ***p<0.001, ****p<0.0001, Mann-Whitney U test; statistical significance is shown between different cell types.

References

    1. Siegel RL, Miller KD, Jemal A. Cancer statistics, 2015. CA: a cancer journal for clinicians. 2015;65(1):5–29. - PubMed
    1. Howlader N, Noone A, Krapcho M, Neyman N, Aminou R, Waldron W, et al. SEER cancer statistics review 1975–2008. Bethesda, MD: National Cancer Institute; 2011. p. 19.
    1. Marcus CS, Maxwell GL, Darcy KM, Hamilton CA, McGuire WP. Current approaches and challenges in managing and monitoring treatment response in ovarian cancer. Journal of Cancer. 2014;5(1):25. - PMC - PubMed
    1. Auersperg N, Wong AST, Choi K, Kang SK, Leung PCK. Ovarian Surface Epithelium: Biology, Endocrinology, and Pathology. Endocr Rev. 2001;22(2):255–288. 04/01; 2015/03. - PubMed
    1. Hudson LG, Zeineldin R, Stack MS. Phenotypic plasticity of neoplastic ovarian epithelium: unique cadherin profiles in tumor progression. Clin Exp Metastasis. 2008;25(6):643–655. - PMC - PubMed

MeSH terms

Substances