. 2017 Jun 19;18(1):123.
doi: 10.1186/s12931-017-0610-1.

Forced expiration measurements in mouse models of obstructive and restrictive lung diseases

Affiliations

Forced expiration measurements in mouse models of obstructive and restrictive lung diseases

Fien C Devos et al. Respir Res. .

Abstract

Background: Pulmonary function measurements are important when studying respiratory disease models. Both resistance and compliance have been used to assess lung function in mice. Yet, it is not always clear how these parameters relate to forced expiration (FE)-related parameters, most commonly used in humans. We aimed to characterize FE measurements in four well-established mouse models of lung diseases.

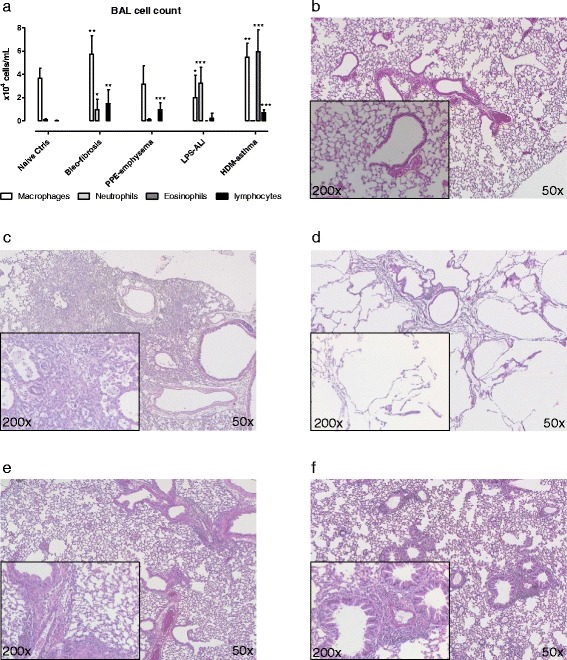
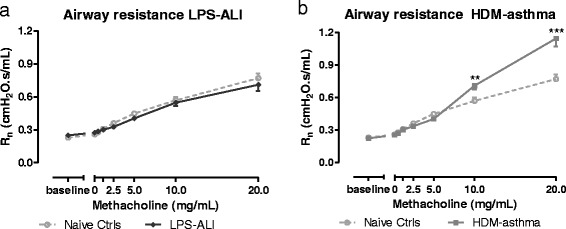
Method: Detailed respiratory mechanics and FE measurements were assessed concurrently in Balb/c mice, using the forced oscillation and negative pressure-driven forced expiration techniques, respectively. Measurements were performed at baseline and following increasing methacholine challenges in control Balb/c mice as well as in four disease models: bleomycin-induced fibrosis, elastase-induced emphysema, LPS-induced acute lung injury and house dust mite-induced asthma.

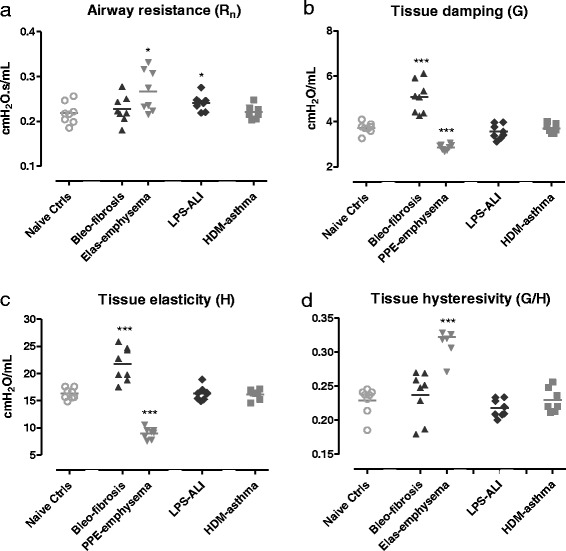
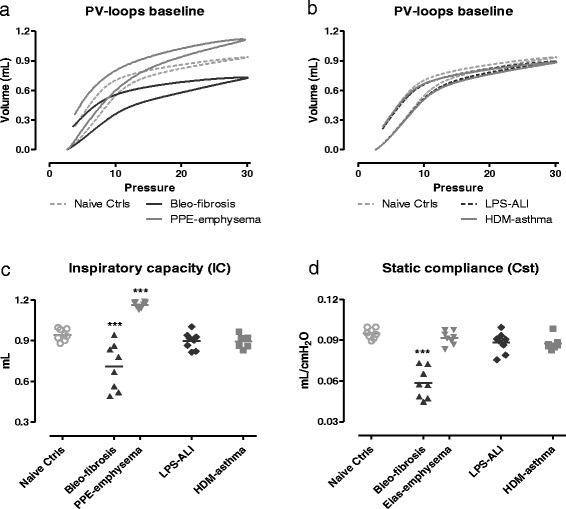
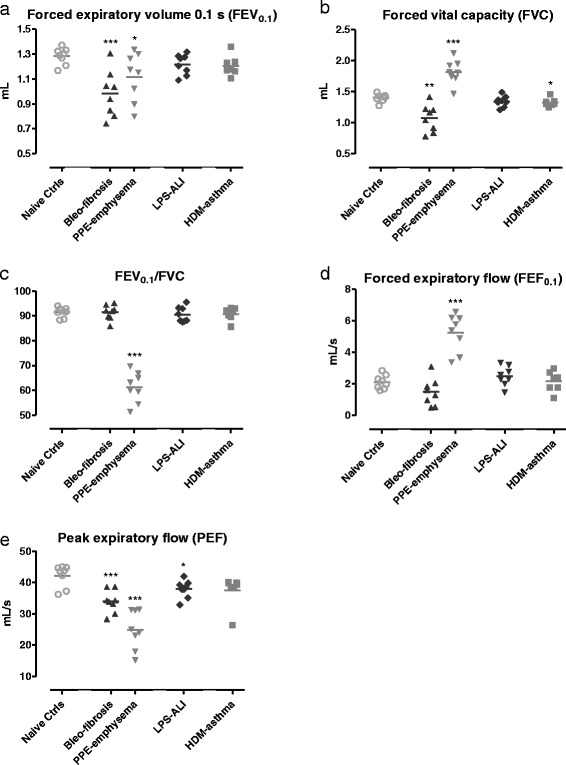
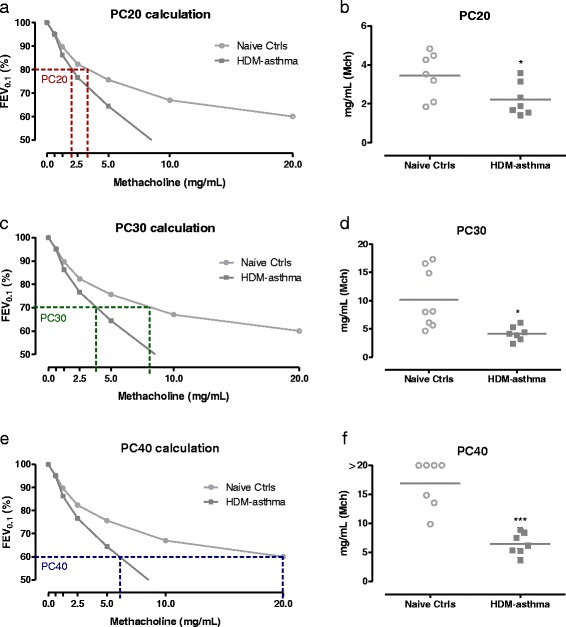
Results: Respiratory mechanics parameters (airway resistance, tissue damping and tissue elastance) confirmed disease-specific phenotypes either at baseline or following methacholine challenge. Similarly, lung function defects could be detected in each disease model by at least one FE-related parameter (FEV0.1, FEF0.1, FVC, FEV0.1/FVC ratio and PEF) at baseline or during the methacholine provocation assay.

Conclusions: FE-derived outcomes in four mouse disease models behaved similarly to changes found in human spirometry. Routine combined lung function assessments could increase the translational utility of mouse models.

Keywords: Acute lung injury; Airway resistance; Asthma; Emphysema; Fibrosis; Forced expiratory volume; Forced oscillations technique; Forced vital capacity; Mice; Negative pressure forced expiration; Tissue elastance.


Figures

Fig. 1
Fig. 1
Differential cell counts in bronchoalveolar lavage and histological analyses. Total numbers of macrophages, neutrophils, eosinophils and lymphocytes were determined in the bronchoalveolar lavage (BAL) fluid, obtained immediately after lung function measurements (a). Next, lungs were isolated and slides of the lungs from mice with different lung diseases were prepared and colored with H&E-staining for analysis at a magnification of 50× and 200×, shown for naive control group (b), Bleo-fibrosis (c), PPE-emphysema (d), LPS-ALI (e) and HDM-asthma (f). Data are presented as mean ± SD. * p < 0.05, ** p < 0.01 and *** p < 0.001 compared to the naive control group. n = 7 –8 per group
Fig. 2
Fig. 2
FOT respiratory mechanics parameters at baseline. Central airway resistance, Rn (a), tissue damping, G (b), tissue elastance, H (c) and tissue hysteresivity G/H (eta) (d) were measured using a prime-8 perturbation. Parameters are shown for each individual mouse, along with group means. * p < 0.05 and *** p < 0.001 compared to the naive control group. n = 7 –8 per group
Fig. 3
Fig. 3
Pressure-volume curves and related parameters at baseline. Pressure-volume (PV) loops were generated using a ramp-style pressure-volume maneuver (PVr-P). Mean PV loops are shown for each group, Bleo-fibrosis and PPE-emphysema in (a), LPS-ALI and HDM-asthma in (b), and represented together with the naive control group. Inspiratory capacity (c) was measured using a deep inflation maneuver, and the static compliance (d) was calculated directly from the deflating arm of the PV loop between 3 –7 cmH2O. Both parameters are shown for each individual mouse, along with group means. *** p < 0.001 compared to the naive control group. n = 7 –8 per group
Fig. 4
Fig. 4
Flow-volume loops at baseline. Negative pressure-driven forced expiration maneuvers were performed at baseline to generate flow-volume (FV) loops. Mean FV loops are shown for each group. Bleo-fibrosis and PPE-emphysema, both parenchymal disorders, are shown in (a), LPS-ALI and HDM-asthma are represented in (b), together with the naive control group. n = 7 –8 per group
Fig. 5
Fig. 5
FE-derived parameters at baseline. Forced expiratory volume at 0.1 s, FEV0.1 (a), forced vital capacity, FVC (b), FEV0.1/FVC ratio (c), forced expiratory flow at 0.1 s, FEF0.1 (d), and peak expiratory flow, PEF (e) were measured in mice by negative pressure-driven forced expiration. Parameters are shown for each individual mouse, along with group means. * p < 0.05, ** p < 0.01 and *** p < 0.001 compared to the naive control group. n = 7 –8 per group
Fig. 6
Fig. 6
Airway responsiveness to methacholine. Airway resistance (Rn) was measured in response to increasing aerosol challenges of methacholine (0 –20 mg/mL). Mean (± SD) concentration-response curves of Rn are shown for LPS-ALI in (a) and HDM-asthma in (b), and represented together with that of the naive control group. ** p < 0.01 and *** p < 0.001 compared to the naive control group.n = 7 –8 per group
Fig. 7
Fig. 7
Flow-volume loops. Negative pressure-driven forced expiration maneuvers were performed at baseline and following each methacholine aerosol challenge (0-20 mg/mL) to generate 8 successive FV-loops for each group. Mean FV-loops are shown for Naive Ctrls in (a), LPS-ALI in (b) and HDM-asthma in (c).n = 7 –8 per group
Fig. 8
Fig. 8
FE-derived parameters. Negative pressure-driven forced expiration maneuvers were performed at baseline and following each methacholine aerosol challenge (0 –20 mg/mL). Forced expiratory volume at 0.1 s, FEV0.1 (a, c), forced vital capacity, FVC (b, d) are shown for LPS-ALI (a, b) and HDM-asthma (c, d). The mean (± SD) concentration-response curve of each group is represented together with that of the naive control group. * p < 0.05, ** p < 0.01 and *** p < 0.001 compared to naive controls. n = 7 –8 per group
Fig. 9
Fig. 9
Provocative methacholine concentrations in mice. Mean FEV0.1 concentration-response curves to MCh are shown for HDM-asthma and naive controls, with indication of corresponding provocative concentration inducing a 20% (PC20) (a), 30% (PC30) (c), or 40% (PC40) (e) decrease in baseline FEV0.1. PC20, PC30, and PC40, calculated from the concentration-response data for each individual mouse and group means are shown in b, d, and f, respectively. * p < 0.05, *** p < 0.001 compared to naive control group. n = 7 –8 per group

References

    1. McGovern TK, Robichaud A, Fereydoonzad L, Schuessler TF, Martin JG. Evaluation of respiratory system mechanics in mice using the forced oscillation technique. J Vis Exp. 2013;15(75):e50172. - PMC - PubMed
    1. Hantos Z, Adamicza A, Govaerts E, Daroczy B. Mechanical impedances of lungs and chest wall in the cat. JApplPhysiol 1985. 1992;73:427–33. - PubMed
    1. Lovgren AK, Jania LA, Hartney JM, Parsons KK, Audoly LP, Fitzgerald GA, et al. COX-2-derived prostacyclin protects against bleomycin-induced pulmonary fibrosis. Am J Physiol Lung Cell MolPhysiol. 2006;291:L144–56. doi: 10.1152/ajplung.00492.2005. - DOI - PubMed
    1. Shim YM, Paige M, Hanna H, Kim SH, Burdick MD, Strieter RM. Role of LTB(4) in the pathogenesis of elastase-induced murine pulmonary emphysema. Am J Physiol Lung Cell MolPhysiol. 2010;299:L749–59. doi: 10.1152/ajplung.00116.2010. - DOI - PMC - PubMed
    1. Hartney JM, Robichaud A. Assessment of airway hyperresponsiveness in mouse models of allergic lung disease using detailed measurements of respiratory mechanics. Methods Mol Biol. 2013;1032:205–17. doi: 10.1007/978-1-62703-496-8_16. - DOI - PubMed

Publication types