. 2017 Jun 19;10(1):37.
doi: 10.1186/s13048-017-0336-1.

MicroRNA-130b is involved in bovine granulosa and cumulus cells function, oocyte maturation and blastocyst formation

Affiliations

MicroRNA-130b is involved in bovine granulosa and cumulus cells function, oocyte maturation and blastocyst formation

Pritam Bala Sinha et al. J Ovarian Res. .

Abstract

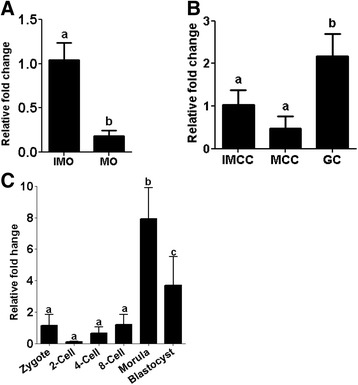
Background: Oocyte maturation and preimplantation embryo development are controlled by array of genes that are post-transcriptionally regulated by microRNAs. With respect to this, previously, we identified altered expression of microRNA-130b (miR-130b) during oocyte maturation. Here, we aimed to investigate the role of miR-130b in bovine granulosa and cumulus cell function, oocyte maturation and preimplantation embryo development using gain- and loss-of- function approach.

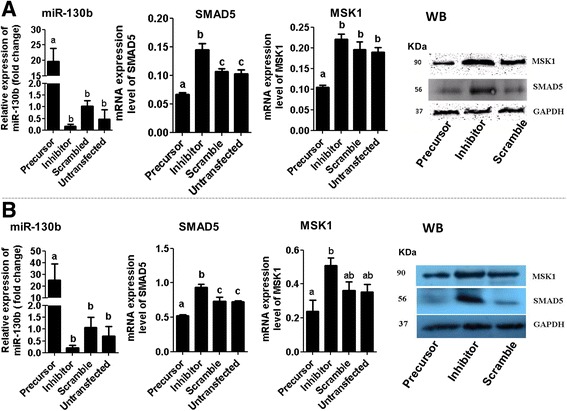
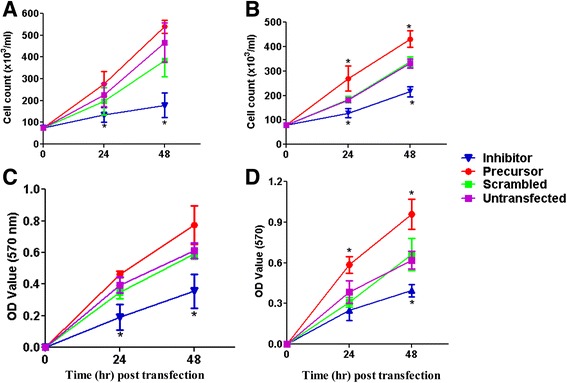
Methods: For this study, the granulosa cells, cumulus cells and the oocytes were collected from ovaries obtained from slaughterhouse. The genes targeted by miR-130b were identified using dual-luciferase reporter assay. The role of miR-130b in granulosa and cumulus cell function was investigated by increasing and inhibiting its expression in in vitro cultured cells using miR-130b precursor and inhibitor, respectively while the role of miR-130b on oocyte development, immature oocytes were microinjected with miR-130b precursor and inhibitor and the polar body extrusion, the proportion of oocytes reaching to metaphase II stage and the mitochondrial were determined in each oocyte group 22 h after microinjection. Moreover, to investigate the role of miR-130b during preimplantation embryo development, zygote stage embryos were microinjected with miR-130b precursor or inhibitor and the cleavage rate, morula and blastocyst formation was analyzed in embryos derived from each zygote group after in vitro culture.

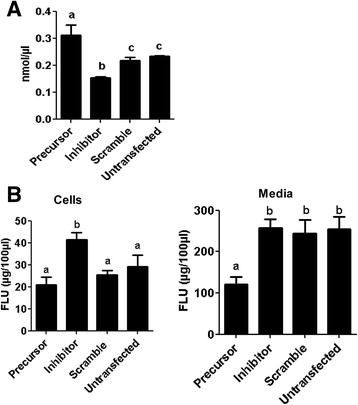
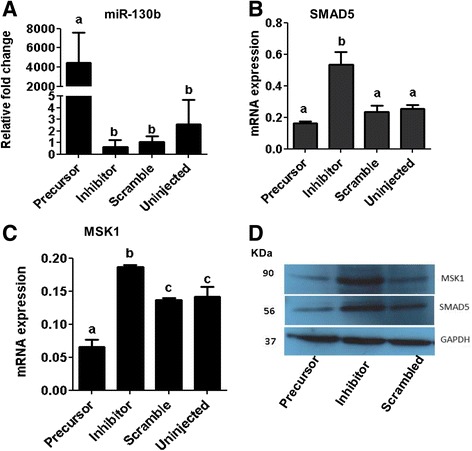
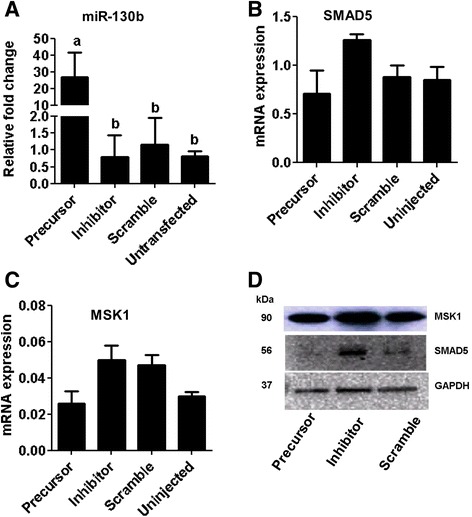
Results: The luciferase assay showed that SMAD5 and MSK1 genes were identified as the direct targets of miR-130b. Overexpression of miR-130b increased the granulosa and cumulus cell proliferation, while inhibition showed the opposite phenotype. Apart from these, modulation of miR-130b altered the lactate production and cholesterol biosynthesis in cumulus cells. Furthermore, inhibition of miR-130b expression during oocyte in vitro maturation reduced the first polar body extrusion, the proportion of oocytes reaching to metaphase II stage and the mitochondrial activity, while inhibition of miR-130b during preimplantation embryo development significantly reduced morula and blastocyst formation.

Conclusion: This study demonstrated that in vitro functional modulation of miR-130b affected granulosa and cumulus cell proliferation and survival, oocyte maturation, morula and blastocyst formation suggesting that miR-130b is involved in bovine oocyte maturation and preimplantation embryo development.

Keywords: Embryo; Mitochondrial activity; Oocyte; miR-130b.


Figures

Fig. 1
Fig. 1
The expression patterns of miR-130b in (a) mature (MO) and immature (IMO) oocytes, (b) immature (IMCC) cumulus, mature (MCC) cumulus and granulosa (GC) cells, (c) preimplantation stage embryos. The expression level of IMO was used as a reference sample to calculate the fold changes between IMO and MO, whereas the expression level of IMCC was used as a reference sample to calculate the fold changes between IMCC, MCC and GC. The expression level of zygotes was used as a reference sample to calculate the fold change expression of miR-130b between preimplantation stage embryos. Bars with different letters are statistically significant (p < 0.05). The bars graphs indicate the mean ± standard deviation (SD) from three independent biological samples of MO, IMO IMCC, MCC, zygotes; 2-cell, 4-cell, and 8-cell stage embryos; morula; and blastocysts
Fig. 2
Fig. 2
In situ localization of miR-130b in ovarian sections using 3′-digoxigenin labeled locked nucleic acid (LNA) microRNA probe. The signal intensity of miR-130b in primordial (a), primary follicle (b), secondary follicle (c) and antral follicles (d). The signal intensity of the U6 miRNA (positive control) is indicated in lanes (e) (antral follicle) and (f) (secondary follicle); whereas the signal intensity of the scramble miRNA probe (negative control) is indicated in panel (g) (antral follicle). The red color indicates the expression level of miR-130b, U6 or scramble miRNA probe while the blue color indicates the nuclear staining using 4′,6-diamidino-2-phenylindole (DAPI)
Fig. 3
Fig. 3
Whole-mount in situ detection of miR-130b expression in oocytes (immature COCs, mature COCs) and preimplantation embryos. The red color indicates the expression level of miR-130b or scramble miRNA probe, while the blue color indicates nuclear staining using 4′,6-diamidino-2-phenylindole (DAPI). The 2D and 3D indicate the two and three dimension images, respectively. COCs; cumulus oocyte complexes
Fig. 4
Fig. 4
Experimental validation of the target genes of the miR-130b using dual luciferase assay. a The luciferase reporter assay in cumulus cells co-transfected with miR-130b precursor or inhibitor and the pmirGLO vector construct harboring of the 3′ UTRs of the SMAD5 gene (SMAD5GLO) or non-target sequence (Non-targetGLO). b The luciferase reporter assay in cumulus cells co-transfected with miR-130b precursor or inhibitor and the pmirGLO vector construct harboring of the 3′ UTRs of the MSK1 gene (MSK1GLO) or non-target sequence (Non-targetGLO). The firefly and renilla activity ratio in cells transfected only with vector construct harboring the 3′ UTR of the miR-130b target genes or cells co-transfected along with the miRNA scramble sequence or the firefly and renilla activity ratio of cells co-transfected with miR-130b precursor or inhibitor along with the vector construct harboring the non-target sequence of miR-130b were used as controls. The assay was performed 24 h post transfection. Bars bars with different letters are statistically significant (p < 0.05). RE; relative expression; FL; firefly luminescent; RL; renilla luminescent. Bars graphs represent the mean ± standard deviation (SD) and the experiment was repeated three times in three independent samples
Fig. 5
Fig. 5
The mRNA abundance level of SMAD5 and MSK1 genes in (a) immature oocytes (IMO), mature oocytes (MO), immature cumulus (IMCC), mature cumulus cells (MCC), granulosa cells (GC) (a), and preimplantation stage embryos (b). Bars with different letters are statistically significant (p < 0.05). The bars graphs represent the mean ± standard deviation (SD) and the data was analyzed from three independent biological samples of MO, IMO IMCC, MCC, zygotes; 2-cell, 4-cell, and 8-cell stage embryos; morula; and blastocysts
Fig. 6
Fig. 6
The expression levels of miR-130b and its target genes in cumulus (a) and granulosa (b) cells transfected with 130b precursor, miR-130 inhibitor and scramble miRNA 24 h post transfection. Granulosa or cumulus cells transfected with scramble miRNA were used as a reference sample to calculate the fold change level of the miR-130b between the treatments. Bars with different letters are statistically significant (p < 0.05). The bars graphs indicate the mean ± standard deviation (SD) and the data was analyzed from three independent granulosa and cumulus cell cultures collected from ovaries obtained from slaughterhouse at different days. The GAPDH protein expression level was used to monitor the stability of the housekeeping gene between treatment groups. WB, western blot, KDa; kilo Dalton
Fig. 7
Fig. 7
The effect of miR-130b overexpression or inhibition on cumulus and granulosa cell survival and proliferation. The total number of live cumulus (a) and granulosa (b) cells 24 and 48 h post miR-130b precursor, miR-130b inhibitor, scramble miRNA transfection or untransfected cell groups. The initial plating density (7.5 × 104 cells/ml) was the same in each treatment group before transfection. Direct cell count was performed using trypanblue. The proliferation rate of cumulus (c) and granulosa (d) cells post miR-130b precursor, miR-130b inhibitor, scramble miRNA transfection and untransfected cell groups determined using MTT assay. Results represent the mean ± standard deviation (SD) of three independent replicates. Significant differences (p < 0.05) are indicated by star (*) symbol
Fig. 8
Fig. 8
The effect of miR-130b overexpression or inhibition on cumulus cell glycolytic activity (a) and cholesterol biosynthesis (b). The concentration of lactate which is the end product of glycolysis was determined in the cells, while the cholesterol concentration was determined both in the cells and culture media. RFU: Relative fluorescence units. Bars (mean ± standard deviation) with different letters are statistically significant (p < 0.05). The analysis was performed from three independent in vitro cumulus cell culture runs and the cumulus cells were obtained from the cumulus oocyte complexes (COCs) collected from ovaries obtained from slaughterhouse in different days
Fig. 9
Fig. 9
The expression level of miR-130b (a), SMAD5 (b) and MSK1(c) in oocytes derived from GV oocytes injected with miR-130b precursor, miR-130b inhibitor and scrambled miRNA 24 h post injection. The protein expression level of MSK1 and SMAD5 in miR-130b precursor, inhibitor and scrambled miRNA injected oocytes 24 h post injection (d). Bars [mean ± standard deviation (SD)] with different letters are statistically significant (p < 0.05). The analysis was performed from oocytes obtained from three independent in vitro maturation runs
Fig. 10
Fig. 10
The mitochondrial activity in MII oocytes derived from GV oocytes injected with miR-130b precursor, miR-130b inhibitor or scrambled miRNA
Fig. 11
Fig. 11
The expression levels of miR-130b and its target genes in blastocysts of different groups. The transcript levels of miR-130b (a), SMAD5 (b) and MSK1 (c) in blastocysts derived from zygotes injected with miR-130b precursor, miR-130b inhibitor, scrambled miRNA or uninjected group. Bars [mean ± standard deviation (SD)] with different letters are statistically significant (p < 0.05). The analysis was performed from blastocysts obtained from three independent in vitro cultures. Western blot analysis showing the protein expression level of SMAD5 and MSK1 in blastocyst derived from zygotes of different treatment groups (d)

References

    1. Hunt PA, Hassold TJ. Human female meiosis: what makes a good egg go bad? Trends Genet. 2008;24:86–93. doi: 10.1016/j.tig.2007.11.010. - DOI - PubMed
    1. Viswanathan SR, Mermel CH, Lu J, Lu CW, Golub TR, Daley GQ. MicroRNA expression during trophectoderm specification. PLoS One. 2009;4:6143. doi: 10.1371/journal.pone.0006143. - DOI - PMC - PubMed
    1. Petro Evi ML, Leroy JLMR, Covaci A, Fransen E. de ND, Dirtu AC, et al. Endocrine-disrupting chemicals in human follicular fluid impair in vitro oocyte developmental competence. Hum Reprod. 2012;27:1025–33. doi: 10.1093/humrep/der448. - DOI - PubMed
    1. Abrahante JE, Daul AL, Li M, Volk ML, Tennessen JM, Miller EA, et al. The Caenorhabditis elegans hunchback-like gene lin-57/hbl-1 controls developmental time and is regulated by microRNAs. Dev Cell. 2003;4:625–37. doi: 10.1016/S1534-5807(03)00127-8. - DOI - PubMed
    1. Lim LP, Lau NC, Weinstein EG, Abdelhakim A, Yekta S, Rhoades MW, et al. The microRNAs of Caenorhabditis elegans. Genes Dev. 2003;17:991–1008. doi: 10.1101/gad.1074403. - DOI - PMC - PubMed

MeSH terms

LinkOut - more resources