

doi: 10.1186/s12915-017-0393-3.
Q&A: Expansion microscopy
Affiliations
- PMID: 28629474
- PMCID: PMC5474863
- DOI: 10.1186/s12915-017-0393-3
Item in Clipboard
Q&A: Expansion microscopy
BMC Biol.
.
Abstract
Expansion microscopy (ExM) is a recently invented technology that uses swellable charged polymers, synthesized densely and with appropriate topology throughout a preserved biological specimen, to physically magnify the specimen 100-fold in volume, or more, in an isotropic fashion. ExM enables nanoscale resolution imaging of preserved samples on inexpensive, fast, conventional microscopes. How does ExM work? How good is its performance? How do you get going on using it? In this Q&A, we provide the answers to these and other questions about this new and rapidly spreading toolbox.
Figures
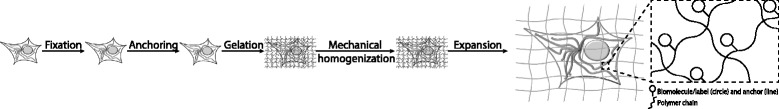
Expansion microscopy (ExM) workflow. First, a biological specimen is chemically fixed (Fixation). Next, the specimen is treated with compounds that bind to key biomolecules or labels (Anchoring), so they can be tethered to the hydrogel polymer chains synthesized in the next step. A hydrogel made of closely spaced, densely cross-linked, highly charged monomers is then polymerized evenly throughout the cells or tissue, intercalating between and around the biomolecules or labels (Gelation). Then the embedded specimen goes through a mechanical homogenization step involving denaturation and/or digestion of structural molecules (Mechanical homogenization). The specimen–hydrogel composite is now ready for physical expansion by dialysis in low-salt buffer or water (Expansion). Biomolecules or labels of interest remain bound to the expanded polymer network, which has pulled them apart (as schematized in the dashed box). Images were adapted by permission with Macmillan Publishers Ltd: Nature Biotechnology [4], copyright 2016
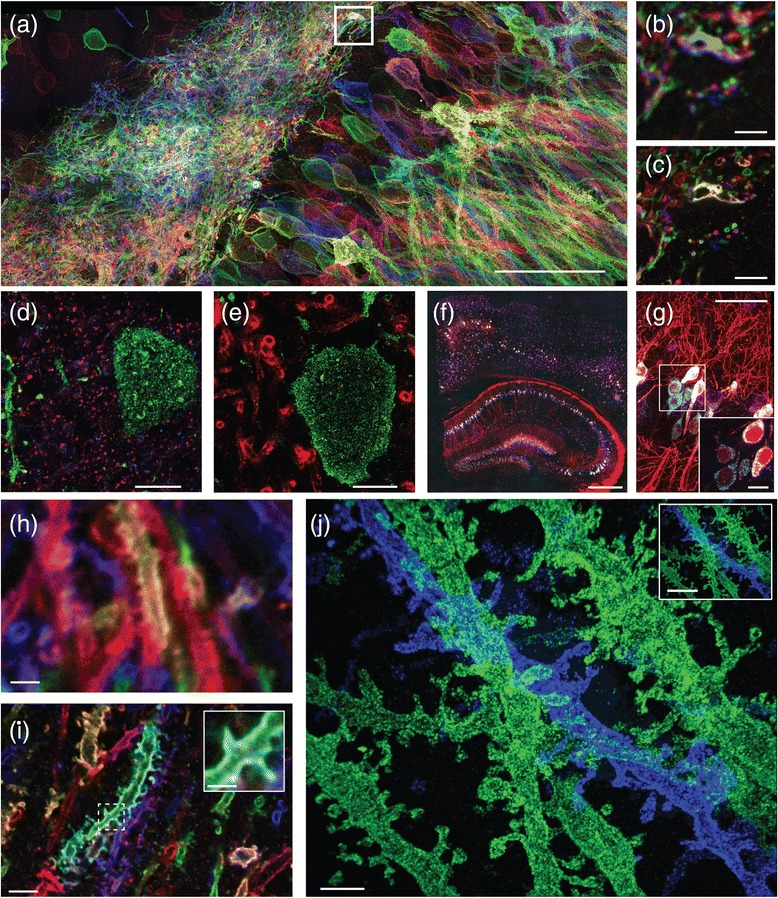
Nanoscale imaging with ExM. a–c Imaging at 60–70 nm resolution of mouse hippocampus after viral delivery of membrane-bound Brainbow3.0 followed by antibody staining, using protein retention ExM (proExM) and imaged on a confocal microscope. a Maximum intensity projection (MIP) of an image stack. b Pre-expansion image showing one optical section of the boxed region in a. c Post-expansion image of b. d, e Nanoscale imaging of mouse brain using proExM with post-expansion antibody delivery. d Post-expansion image of mouse cortex from Thy1-YFP mouse after high-temperature treatment, followed by immunostaining against bassoon (blue), homer (red), and YFP (green). e Post-expansion image of mouse cortex from Thy1-YFP mouse after high-temperature treatment, followed by immunostaining against myelin basic protein (red) and YFP (green). f, g Nanoscale imaging of RNA in Thy1–YFP mouse brain using expansion fluorescence in situ hybridization (ExFISH). f Wide-field image showing YFP protein (red), and hybridization chain reaction ExFISH (HCR-ExFISH) signals for YFP mRNA (cyan) and Gad1 mRNA (magenta). g Confocal image of mouse hippocampus from f. Inset: one plane of the boxed region. Colors as in f. h–j Imaging at ~25 nm resolution of mouse hippocampus using iterative expansion microscopy (iExM). h Image of unexpanded mouse hippocampus after viral delivery of membrane-bound Brainbow3.0, followed by antibody staining against EYFP (blue), TagBFP (red), and mTFP (green). i As in h, but expanded using proExM. Inset: a magnified image of spines from the dotted box of i. j MIP of an image stack of iExM-expanded mouse hippocampus with staining against EYFP (blue) and mCherry (green). Inset: zoomed-out view of the image of j. Scale bars, in biological units: a 50 μm (physical size post-expansion 198 μm); b 5 μm; c 5 μm (19.8 μm); d 5 μm (21 μm); e 5 μm (21 μm); f 500 μm (1450 μm); g 50 μm (145 μm), inset 10 μm (29 μm); h 3 μm; i 3 μm (14 μm), inset 1 μm (4.5 μm); j 1 μm (20 μm), inset 3 μm (60 μm). Images adapted by permission from Macmillan Publishers Ltd: Nature Biotechnology [4], copyright 2016; Nature Methods [5], copyright 2016; Nature Methods [6], copyright 2017
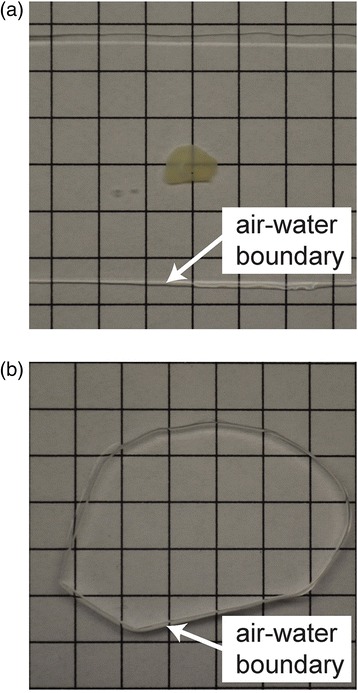
After expansion, the sample is 99% water and clear. Expansion significantly reduces scattering of the sample since the sample is mostly water. A 200-μm fixed brain slice is opaque primarily due to scattering (a). However, the post-ExM sample is transparent (b), facilitating light-sheet imaging and large-volume imaging. From [1]. Reprinted with permission from AAAS
References
-
- Cohen Y, Ramon O, Kopelman IJ, Mizrahi S. Characterization of inhomogeneous polyacrylamide hydrogels. J Polym Sci Part B Polym Phys. 1992;30:1055–67. doi: 10.1002/polb.1992.090300913. - DOI
-
- ExpansionMicroscopy.org. Physical specimen expansion enabling 3-D large volume, nanoscale imaging. http://expansionmicroscopy.org/.
MeSH terms
Substances
LinkOut - more resources
Full Text Sources
Other Literature Sources
