Review
. 2017 Jun 19;18(1):120.
doi: 10.1186/s13059-017-1250-y.

Genetic-epigenetic interactions in cis: a major focus in the post-GWAS era

Affiliations
Review

Genetic-epigenetic interactions in cis: a major focus in the post-GWAS era

Catherine Do et al. Genome Biol. .

Abstract

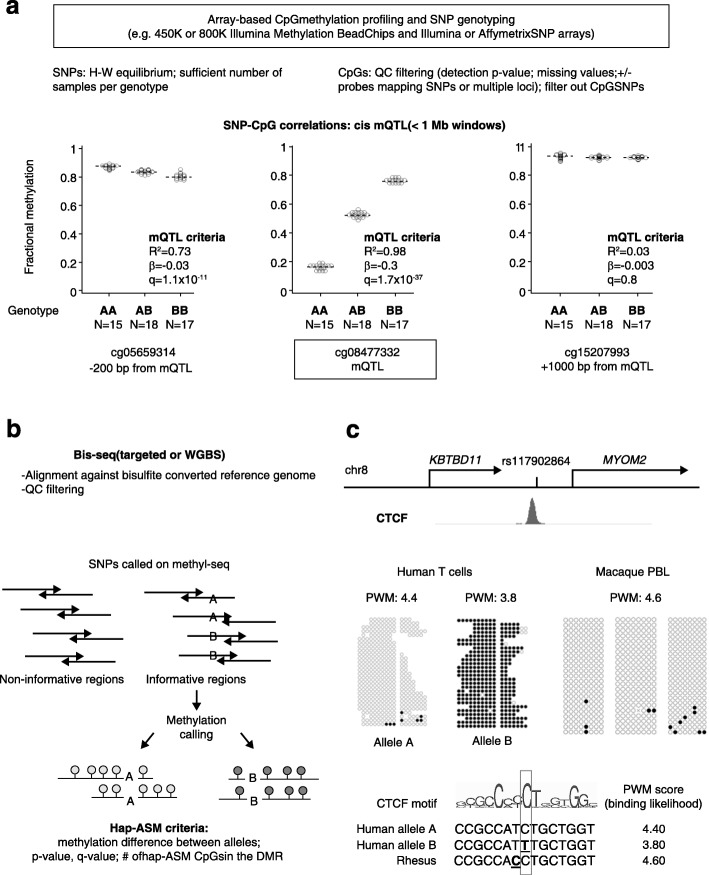
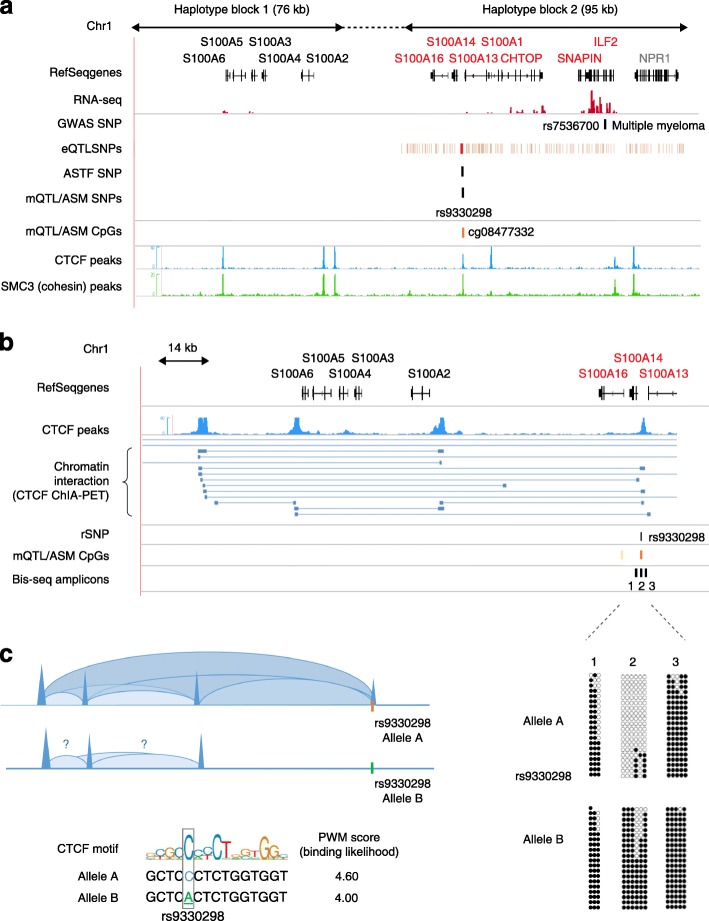
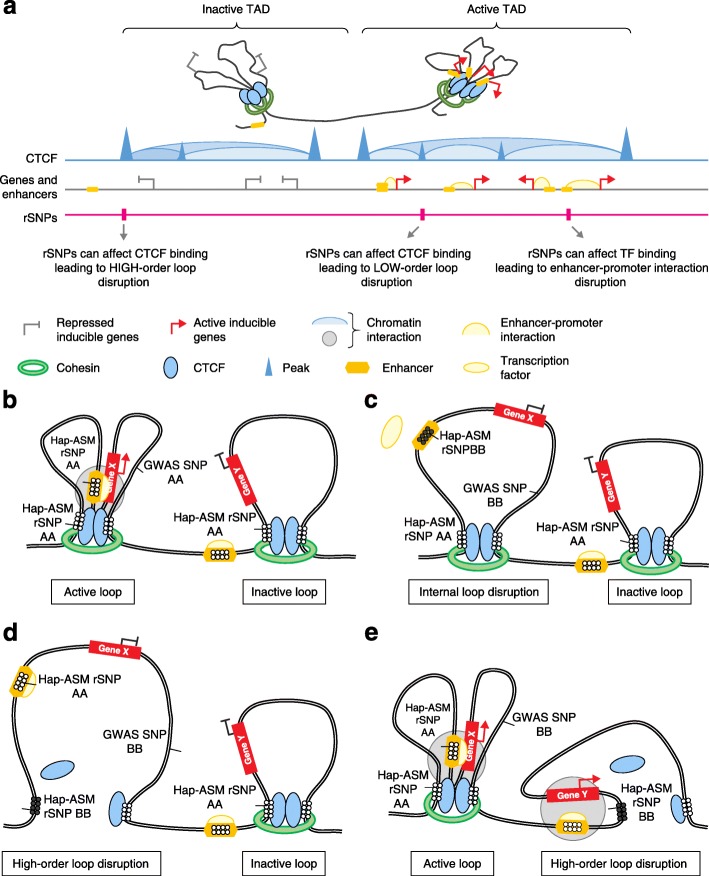
Studies on genetic-epigenetic interactions, including the mapping of methylation quantitative trait loci (mQTLs) and haplotype-dependent allele-specific DNA methylation (hap-ASM), have become a major focus in the post-genome-wide-association-study (GWAS) era. Such maps can nominate regulatory sequence variants that underlie GWAS signals for common diseases, ranging from neuropsychiatric disorders to cancers. Conversely, mQTLs need to be filtered out when searching for non-genetic effects in epigenome-wide association studies (EWAS). Sequence variants in CCCTC-binding factor (CTCF) and transcription factor binding sites have been mechanistically linked to mQTLs and hap-ASM. Identifying these sites can point to disease-associated transcriptional pathways, with implications for targeted treatment and prevention.


Figures

Fig. 1
Fig. 1
Approaches for mapping mQTLs and hap-ASM DMRs. Haplotype-dependent allelic methylation asymmetry (hap-ASM) can be assessed using two different approaches, methylation quantitative trait locus (mQTL) and hap-ASM analysis. The mQTL approach is based on correlations of (biallelic) net methylation to genotypes across individuals, whereas sequencing-based approaches are based on direct comparisons between alleles in single (heterozygous) individuals. a To identify mQTLs, correlations between single nucleotide polymorphism (SNP) genotypes and net methylation at nearby CpGs are measured in groups of samples. Methylation and genotyping data are generated in separate assays, which are usually array-based, and correlations are computed using linear regression or Spearman’s rank correlation. The mQTLs are defined using q value (false discovery rate [FDR]-corrected p value), effect size (β value), and goodness of fit of the linear model (R square). An example of a mQTL in the S100A gene cluster [49] is shown. The genotype of the index SNP, rs9330298, correlates with the methylation at cg08477332 by stringent criteria (β > 0.1, R2 > 0.5, q value <0.05). Lack of correlations between the index SNP and more distant CpGs corresponds to a discrete hap-ASM region spanning approximately 1 kb. b Hap-ASM is analyzed directly, using targeted bis-seq or whole genome bisulfite sequencing (WGBS) in single individuals. Deep long-read sequencing is desirable to generate reads mapping both CpG sites and common SNPs because the statistical power depends on the number of reads per allele. Alignment is performed against bisulfite-converted reference genomes, which can be done, for example, using Bismark [169], BSMAP [170], or Bison [171]. Alignment against personalized diploid genomes (constructed using additional genotyping data) or SNP-masked reference genomes, can decrease alignment bias toward the reference allele. Quality control (QC) filtering is based on Phred score, read length, duplicates, number of mismatches, ambiguous mapping, and number of reads per allele. CpG SNPs can be tagged or filtered out by intersecting CpG and common SNP coordinates. After alignment and quality control of the bis-seq data, SNP calling is performed, for example, using BisSNP [172]. For C/T and G/A SNPs, the distinction between the alternative allele and bisulfite conversion is possible only on one of the DNA strands (the G/A strand). Methylation levels are determined separately for the two alleles, both for individual CpGs and for groups of CpGs in genomic windows, and compared using, for example, Fisher’s exact test or Wilcoxon test, respectively. Both p value (and corrected p value) and effect size metrics (number of significant CpGs in the DMR and methylation difference across all covered CpGs) are used to define hap-ASM regions. c Example of a hap-ASM DMR, located downstream of the KBTBD11 gene [49]. The hap-ASM region in T cells overlaps a CTCF ChIP-Seq peak. The index SNP (rs117902864) disrupts a canonical CTCF motif as reflected by a lower position weight matrix (PWM) score associated with allele B. This result implicates CTCF allele-specific binding as a mechanism for hap-ASM at this locus. Consistent with this hypothesis, the NHP (Rhesus macaque) sequence differs from the human reference allele (allele A) by one nucleotide (bold and underlined) which does not affect the binding affinity, and the observed methylation levels are very low in the macaque blood samples, similar to allele A in the human T cells. PWM position weight matrix
Fig. 2
Fig. 2
Integrative “post-GWAS” mapping of allele-specific marks for identifying disease-associated regulatory sequence variants. Genome-wide association studies (GWAS) typically implicate a haplotype block spanning tens to hundreds of kilobases, with resolution limited by the fact that all single nucleotide polymorphisms (SNPs) that are in strong linkage disequilibrium (LD) with the index SNP will show a similar disease association. A combination of post-GWAS modalities using maps of allele-specific marks can help to localize the causal genes and the underlying regulatory sequences. a The S100A*-ILF2 region exemplifies this approach. The map shows the index SNPs for expression quantitative trait loci (eQTLs), methylation quantitative trait loci (mQTLs), haplotype-dependent allele-specific DNA methylation (hap-ASM), and allele-specific transcription factors (ASTF). The suggestive (sub-threshold) GWAS signal for multiple myeloma susceptibility (rs7536700, p = 4 × 10−6) tags a haplotype block of 95 kb, which was defined using 1000 Genome data [186] with an algorithm that emphasizes D-prime values [187, 188]. The GWAS SNP overlaps no known regulatory element or transcription factor (TF) binding site. Numerous cis-eQTL SNPs correlating with several genes within 1 MB have been identified in this haplotype block (eQTL-tagged genes indicated in red), so identifying the causal regulatory SNP(s) is not possible solely from eQTL data. However, several SNPs in the block identify mQTLs, all correlating with the same CpG site, cg08477332. Fine mapping using targeted bis-seq [49] confirmed a discrete hap-ASM differentially methylated region (DMR; orange) spanning ~1 kb. The hap-ASM index SNP rs9330298 is in strong LD with rs7536700 (D′ = 1), is the closest SNP to the DMR, and is an eQTL correlating with S100A13 expression. In addition, this DMR coincides with a CTCF peak that shows allele-specific binding in chromatin immunoprecipitation-sequencing (ChIP-Seq) data, nominating the disruption of CTCF binding by rs9330298 as a candidate mechanism underlying susceptibility to multiple myeloma, either by direct effects in B cells or via effects on immune surveillance by T cells. The eQTL and ASTF data are from the Genotype-Tissue Expression project (GTEx) and alleleDB, respectively [47, 180]. RNA-seq data in GM12878 cell lines were downloaded from ENCODE. The mQTL and hap-ASM data are from [49], and the CTCF ChIP-seq data (GM12878 LCL) from ENCODE. The dashed line represents a genomic region lacking defined LD structure. b Map showing three-dimensional chromatin interactions in the S100A* gene cluster. The hap-ASM region coincides with a CTCF-mediated chromatin anchor site, as suggested by chromatin interaction analysis by paired-end tag sequencing (ChIA-PET) data (K562 cell line) [122]. This evidence suggests that disruption of the CTCF-binding site by the candidate regulatory SNP (rSNP), rs9330298, might abrogate the formation of one or more chromatin loops. c Bis-seq (closed circles, methylated CpGs; open circles, unmethylated CpGs) confirms that the hap-ASM DMR overlaps a CTCF-binding site (amplicon 2) and the lower position weight matrix (PWM) score for allele B of rs9330298 predicts allele-specific disruption of CTCF binding, consistent with the allele-specific binding seen in the ChIP-seq data. The disruption of this CTCF-mediated chromatin anchor site could account for eQTLs in this region, where the S100A cluster genes are no longer insulated from the active enhancers of neighboring genes, such as ILF2 or CHTOP, which have higher expression levels in blood
Fig. 3
Fig. 3
Cis-acting genetic–epigenetic interactions can lead to inter-individual differences in DNA looping, gene expression, and disease susceptibility. Simplified representations of three-dimensional chromatin structure in haplotype blocks containing genome wide association study (GWAS) peaks, highlighting the potential effects of regulatory sequence variants (rSNPs) on DNA methylation, interactions between regulatory elements (insulators, enhancers and promoters), topologically associating domain (TAD) structures, gene expression, and disease susceptibility. a CTCF-mediated chromatin looping leading to formation of “active” and “inactive” TADs. Chromatin interaction analysis by paired-end tag sequencing (ChIA-PET) and Hi-C have mapped chromatin interactions and have identified TADs as large-scale chromatin structures, with CTCF or cohesin enriched at the TAD boundaries [103]. The chromatin loops promote intra-domain interactions between regulatory elements, such as enhancers and gene promoters (which induce gene expression), while preventing inter-domain contacts in order to minimize promiscuous gene expression. In this model, regulatory variants at TAD boundaries or intra-domain contacts (sub-TAD boundaries) can induce high- or low-order chromatin configuration changes that disrupt the insulated neighborhoods formed by the looping, thereby causing either the abolition of enhancer–promoter interactions (in active TADs) or the formation of ectopic enhancer–promoter interactions (in inactive TADs). Additionally, regulatory variants at active transcription factor (TF)-bound enhancers can directly affect enhancer–promoter interactions. Variants that affect the integrity of TAD structures and chromatin interactions are more likely to have functional effects and to be rSNPs, which can sometimes lead to disease susceptibility. b Chromatin looping leads to active or inactive insulated chromatin neighborhoods, which can vary between individuals because of haplotype-dependent allele-specific DNA methylation (hap-ASM) rSNPs and can therefore influence DNA methylation patterns and disease susceptibility. In this genomic configuration (AA alleles at the enhancer SNP of gene X, AA alleles at the CTCF-binding site SNP of the gene-X-containing loop, and AA alleles at the CTCF-binding site SNP of the gene-Y-containing loop), both of the TAD anchor sites have a high affinity for CTCF. In the chromatin loop associated with gene X, the formation of the loop brings the enhancer and promoter into close proximity. The active enhancer is bound by TFs and RNA polymerase interacts with the gene X promoter to induce transcription [122, 189]. Conversely, the chromatin loop containing gene Y enforces gene silencing by isolating the promoter away from neighboring enhancers. CTCF and TF occupancy is associated with low methylation at the TAD anchor sites and in enhancer sequences, expression of gene X, silencing of gene Y, and no disease susceptibility. c In this configuration (BB at the enhancer SNP of gene X, AA at the CTCF-binding site SNP of the gene-X-containing loop, and AA at the CTCF-binding site SNP of the gene-Y-containing loop), the anchor sites bind CTCF with high affinity. Although the CTCF-anchored loops are not altered, the rSNP at the enhancer of gene X disrupts the binding of the TF and RNAPII complex, resulting in a high methylation level at the enhancer and gene silencing. In this scenario, the silencing of gene X leads to disease susceptibility, associated with the GWAS index SNP allele BB, which is in linkage disequilibrium (LD) with the functional rSNP allele BB at the enhancer of gene X. d In this configuration (AA at the enhancer SNP of gene X, BB at the CTCF-binding site SNP of the gene-X-containing loop, and AA at the CTCF-binding site SNP of the gene-Y-containing loop), allele BB at the CTCF-dependent TAD anchor site associated with gene X leads to a low affinity for CTCF. The loss of CTCF binding disrupts the higher-order chromatin loop, and the promoter–enhancer interaction of gene X is no longer facilitated, although TF binding is not altered at the enhancer. e In this configuration (AA at the enhancer SNP of gene X, AA at the CTCF-binding site SNP of the gene-X-containing loop, BB at the CTCF-binding site SNP of the gene-Y-containing loop), allele BB at the CTCF-mediated TAD anchor site of the gene-Y-containing loop has a low affinity for CTCF. The loss of CTCF binding disrupts the chromatin loop, such that the promoter of gene Y is no longer isolated from the active enhancer of the neighboring expressed gene, which induces an ectopic enhancer–promoter interaction. This loss of CTCF occupancy is associated with a high methylation level at one of the anchor sites of gene-Y-containing TAD, and expression of gene Y. In this scenario, the expression of gene Y leads to a disease phenotype associated with the GWAS peak SNP allele BB, which is in LD with the causal rSNP allele BB at the CTCF-binding site

Similar articles

Cited by

References

    1. Visscher PM, Brown MA, McCarthy MI, Yang J. Five years of GWAS discovery. Am J Hum Genet. 2012;90:7–24. doi: 10.1016/j.ajhg.2011.11.029. - DOI - PMC - PubMed
    1. Korf BR. Integration of genomics into medical practice. Discov Med. 2013;16:241–8. - PubMed
    1. Couch FJ, Kuchenbaecker KB, Michailidou K, Mendoza-Fandino GA, Nord S, Lilyquist J, et al. Identification of four novel susceptibility loci for oestrogen receptor negative breast cancer. Nat Commun. 2016;7:11375. doi: 10.1038/ncomms11375. - DOI - PMC - PubMed
    1. Reeves GK, Travis RC, Green J, Bull D, Tipper S, Baker K, et al. Incidence of breast cancer and its subtypes in relation to individual and multiple low-penetrance genetic susceptibility loci. JAMA. 2010;304:426–34. doi: 10.1001/jama.2010.1042. - DOI - PubMed
    1. Muranen TA, Mavaddat N, Khan S, Fagerholm R, Pelttari L, Lee A, et al. Polygenic risk score is associated with increased disease risk in 52 Finnish breast cancer families. Breast Cancer Res Treat. 2016;158:463–9. doi: 10.1007/s10549-016-3897-6. - DOI - PMC - PubMed

Publication types