. 2017 Jun 20:6:e25887.
doi: 10.7554/eLife.25887.

Microbiota regulates visceral pain in the mouse

Affiliations

Microbiota regulates visceral pain in the mouse

Pauline Luczynski et al. Elife. .

Abstract

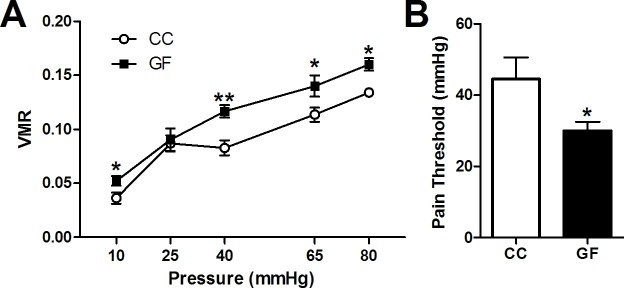
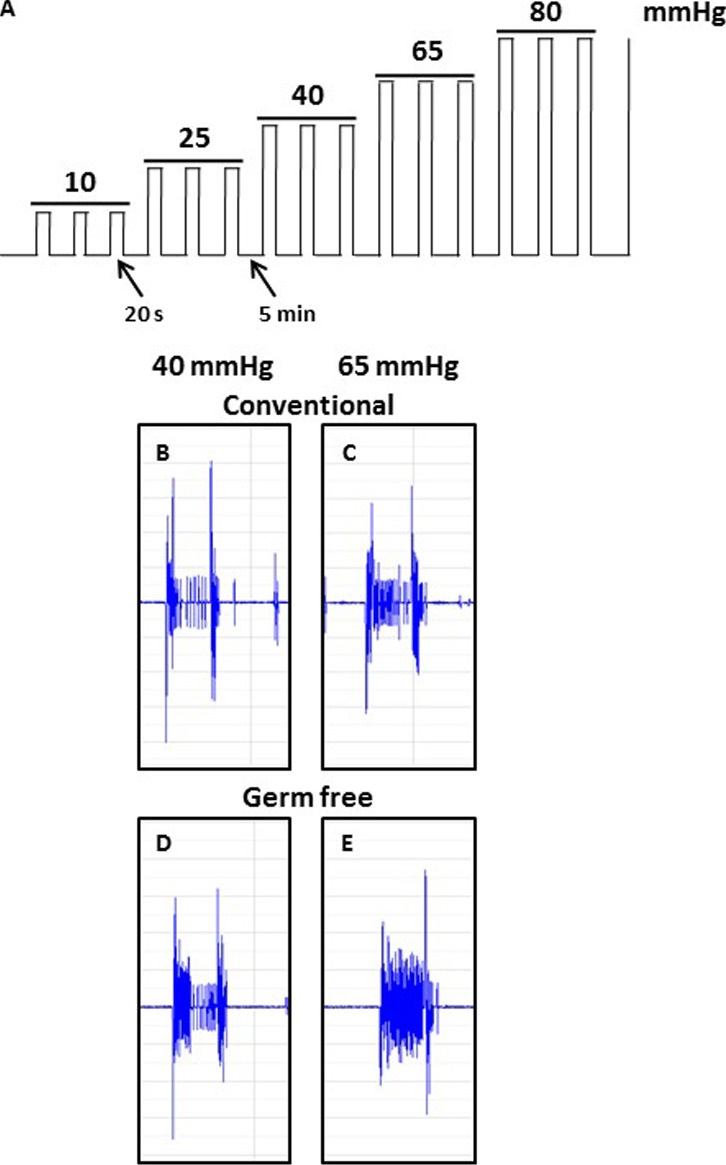
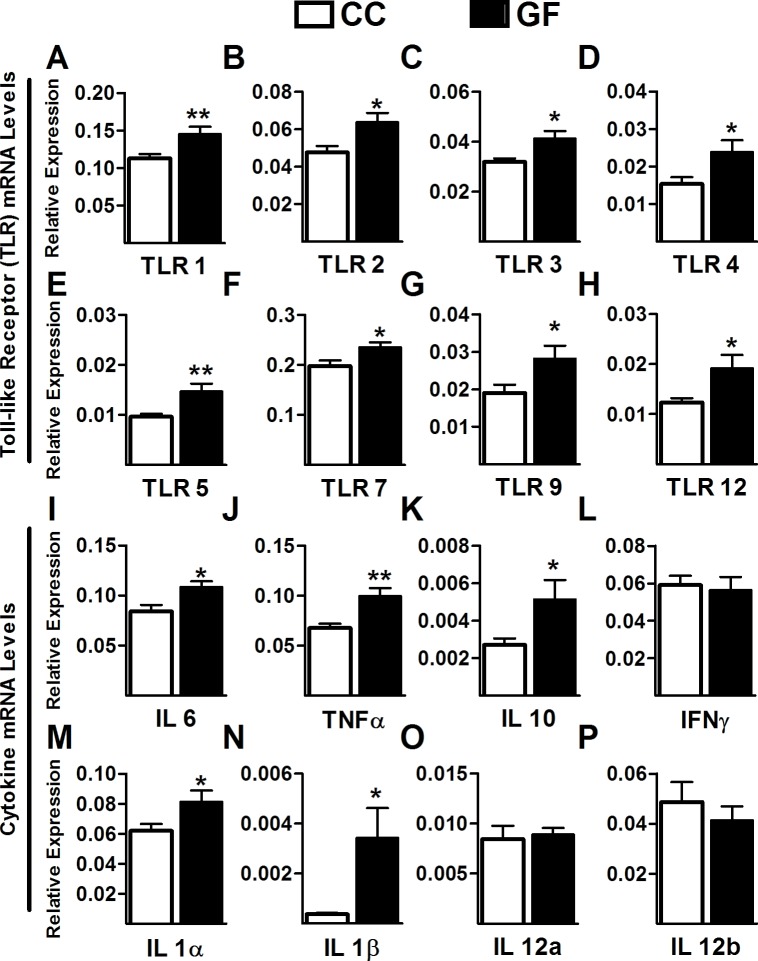
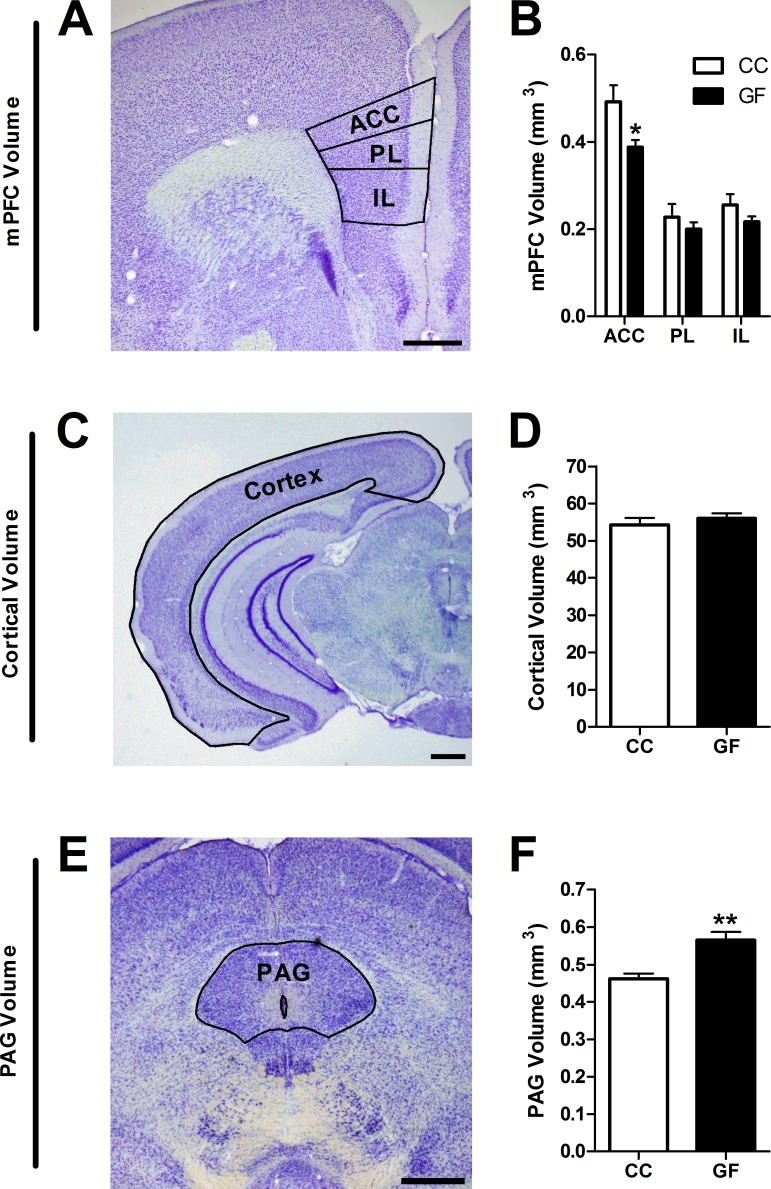
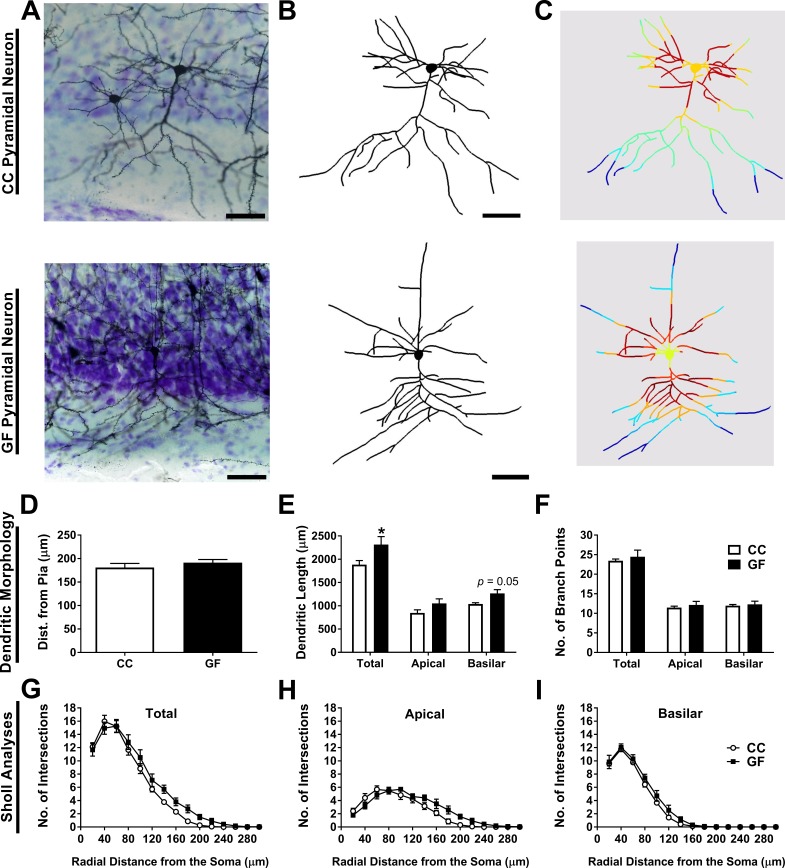
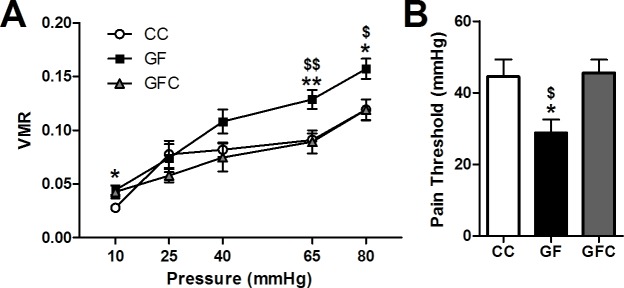
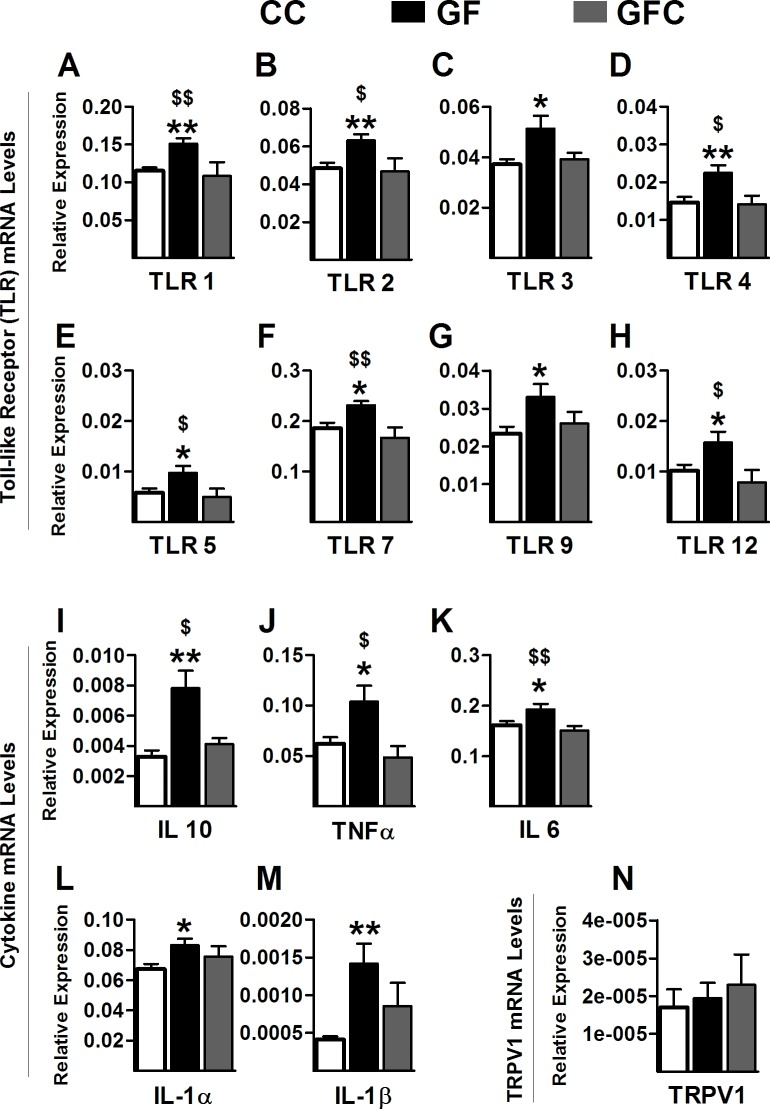
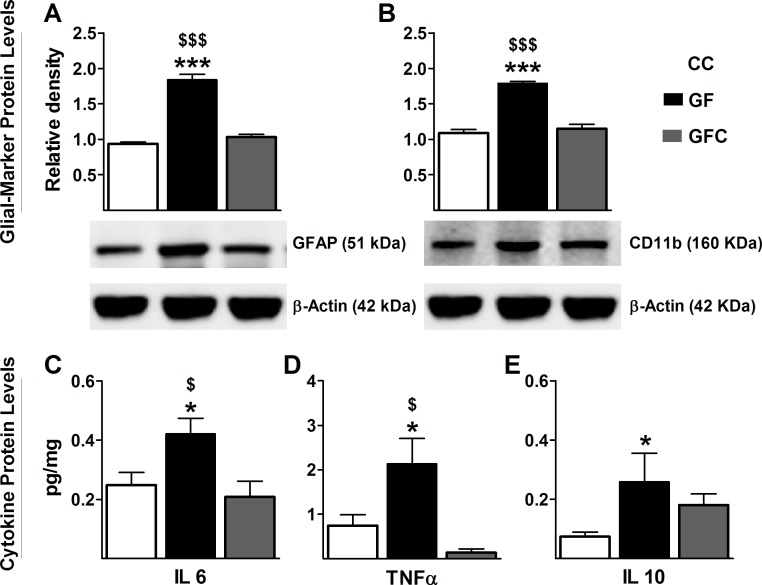
The perception of visceral pain is a complex process involving the spinal cord and higher order brain structures. Increasing evidence implicates the gut microbiota as a key regulator of brain and behavior, yet it remains to be determined if gut bacteria play a role in visceral sensitivity. We used germ-free mice (GF) to assess visceral sensitivity, spinal cord gene expression and pain-related brain structures. GF mice displayed visceral hypersensitivity accompanied by increases in Toll-like receptor and cytokine gene expression in the spinal cord, which were normalized by postnatal colonization with microbiota from conventionally colonized (CC). In GF mice, the volumes of the anterior cingulate cortex (ACC) and periaqueductal grey, areas involved in pain processing, were decreased and enlarged, respectively, and dendritic changes in the ACC were evident. These findings indicate that the gut microbiota is required for the normal visceral pain sensation.

Keywords: Irritable Bowel Syndrome; infectious disease; microbiology; microbiome; microbiota-gut-brain axis; mouse; neuroscience; periaqueductal gray; stress; toll-like receptor.


Conflict of interest statement

The authors declare that no competing interests exist.

Figures

Figure 1.
Figure 1.. Visceral hypersensitivity in GF mice.
Visceral sensitivity to colorectal distention (CRD; ascending paradigm from 10 to 80 mm Hg) was assessed as the number of visceromotor responses (VMR) over pressures. (A) GF mice displayed increased visceral pain responses compared to controls. (B) The pain threshold was lower in GF compared to CC mice. In this and subsequent figures, *p≤0.05, **p<0.01, and ***p<0.001 versus CC animals. CC, n = 10; GF, n = 9. DOI: http://dx.doi.org/10.7554/eLife.25887.003
Figure 1—figure supplement 1.
Figure 1—figure supplement 1.. Schematic illustration showing the ascending phasic distension paradigm (10–80 mmHg) (A) and representative CRD traces at the pressure of 40 mmHg and 65 mmHg for conventional (B,C) or germ-free (D, E) mice. The paradigm consists of three repeated pulses at each pressure level, with a pulse duration of 20 s at 5-min intervals.
DOI: http://dx.doi.org/10.7554/eLife.25887.004
Figure 2.
Figure 2.. Increased Toll-like receptor and cytokine gene expression in the spinal cord of GF mice.
(A–H) Gene expression levels of the Toll-like receptors TLR1 (A), TLR2 (B), TLR3 (C), TLR4 (D), TLR5 (E), TLR7 (F), TLR9 (G), and TLR12 (H) were significantly elevated in the spinal cord of GF versus CC mice. (I–M) When compared to controls, GF mice showed increased gene expression levels of the cytokines IL6 (I), TNFα (J), IL10 (K), IL1α (M), and IL1β (N). There was no change in the gene expression of the cytokines IFNγ (L), IL12α (O), and IL12β (P). CC, n = 9–10; GF, n = 9–10. DOI: http://dx.doi.org/10.7554/eLife.25887.005
Figure 3.
Figure 3.. Reduction in ACC and increase in PAG volume in GF mice.
(A,C,E), Representative thionin-stained section of the mPFC (A), cortex (C), and PAG (E). The volumes of the defined (black lines) subregions of interest were estimated using Cavalieri’s principle. Scale bars = 0.5 mm. (B) In GF mice, the volume of the ACC was reduced. (D) Cortical volume did not differ between CC and GF mice. (F) The PAG was larger in GF versus CC mice. CC, n = 5; GF, n = 6–7. DOI: http://dx.doi.org/10.7554/eLife.25887.006
Figure 4.
Figure 4.. Basilar dendritic elongation in ACC pyramidal neurons of GF mice.
(A,B,C) Representative images of Golgi-stained layer II/III pyramidal neurons of CC and GF mice (A). Neurons were reconstructed in 3D using morphometric software (B). Sholl analysis was performed on 2D renderings of the neurons (incremental radii from the soma are indicated by the color gradient; C). Scale bars = 50 μm. (D) There was no group difference in the topographical location (i.e. cell layer) of the neurons in the ACC. (E) When compared to controls, the dendrites of ACC pyramidal neurons of GF mice were longer. This elongation was principally localized to the basilar dendritic arbor. (F) There was no change in the number of branch points of ACC pyramidal neurons between groups. (G) Sholl analysis of the total dendritic arbor revealed no difference in dendritic complexity between CC and GF mice. (H) In GF mice, the apical dendritic arbor showed altered dendritic complexity; however, post hoc comparisons revealed no statistically significant distances in which this change occurred. (I) There was no group difference in the complexity of basilar dendrites. For both CC and GF mice, n = 5. DOI: http://dx.doi.org/10.7554/eLife.25887.007
Figure 4—figure supplement 1.
Figure 4—figure supplement 1.. Increase of thin and stubby spines on ACC pyramidal neurons of GF mice.
(A) Image of a dendritic segment with examples of thin, stubby, and mushroom spines. (B,C) Representative images of dendritic spine density from ACC pyramidal neurons of CC (B) and GF mice (C). Scale bars = 10 μm. (D,E) There was no group difference in spine width (D) or length (E). (F) In GF mice, spine density was increased over the entire dendritic arbor. (G) When compared to controls, thin spine density was higher in GF mice, with a trend toward an increase in thin spines on basilar dendrites. (H) In GF mice, stubby spine density was increased overall and on basilar dendrites. (I) There was no significant difference in mushroom spine density in CC compared to GF mice. For both CC and GF mice, n = 5. DOI: http://dx.doi.org/10.7554/eLife.25887.008
Figure 5.
Figure 5.. Normalization of visceral hypersensitivity following colonization of GF mice.
(A,B) Microbial colonization restored normal visceral pain responsivity (A) and pain threshold (B). For this and subsequent figures, *p<0.05, **p<0.01, and ***p<0.001 versus CC mice; $p < 0.05; $$p < 0.01 versus GFC mice. CC, n = 10; GF, n = 8; GFC, n = 9. DOI: http://dx.doi.org/10.7554/eLife.25887.009
Figure 6.
Figure 6.. Normalization of toll-like receptor and cytokine gene expression in the spinal cord of GF mice following microbial colonization.
(A–H) Microbial colonization normalized the increased gene expression levels of the toll-like receptors TLR1 (A), TLR2 (B), TLR4 (D), TLR5 (E), TLR7 (F), and TLR12 (H) observed in the spinal cord of GF mice. No changes were observed in the expression levels of TLR3 (C) and TLR9 (G) between GFC and GF mice. (I–M) Microbial colonization reversed the elevated gene expression of the cytokines IL6 (I), TNFα (J), and IL10 (K) in the spinal cord of GF mice. No changes were observed in the expression levels of IL1α (L) and IL1β (M) between GFC and GF mice. (N) No group changes were observed in the expression levels of TRPV1. CC, n = 16–20; GF, n = 15–20; GFC, n = 7–10. DOI: http://dx.doi.org/10.7554/eLife.25887.010
Figure 7.
Figure 7.. Normalization of glial activation and cytokine protein expression in spinal cord of GF mice following microbial colonization.
Western blot analysis was performed for GFAP (astrocyte marker) and Cd11b (microglial marker) in the lumbosacral region of the spinal cord in CC, GF, and GFC mice. (A,B), The increased expression of both GFAP (A) and CD11b (B) in GF mice was normalized following colonization. (C–E) ELISA assays were performed to assess the protein levels of cytokines. Microbial colonization similarly normalized the elevated protein levels of the cytokines IL6 (C) and TNFα (D) in the spinal cord. However, no change was observed in the expression of IL10 (E) between GFC and GF mice. CC, n = 5–11; GF, n = 6–10; GFC, n = 4–8. DOI: http://dx.doi.org/10.7554/eLife.25887.011

Similar articles

Cited by

References

    1. Ait-Belgnaoui A, Han W, Lamine F, Eutamene H, Fioramonti J, Bueno L, Theodorou V. Lactobacillus farciminis treatment suppresses stress induced visceral hypersensitivity: a possible action through interaction with epithelial cell cytoskeleton contraction. Gut. 2006;55:1090–1094. doi: 10.1136/gut.2005.084194. - DOI - PMC - PubMed
    1. Apkarian AV, Bushnell MC, Treede RD, Zubieta JK. Human brain mechanisms of pain perception and regulation in health and disease. European Journal of Pain. 2005;9:463. doi: 10.1016/j.ejpain.2004.11.001. - DOI - PubMed
    1. Apkarian AV, Hashmi JA, Baliki MN. Pain and the brain: specificity and plasticity of the brain in clinical chronic pain. Pain. 2011;152:S49–S64. doi: 10.1016/j.pain.2010.11.010. - DOI - PMC - PubMed
    1. Bignami A, Eng LF, Dahl D, Uyeda CT. Localization of the glial fibrillary acidic protein in astrocytes by immunofluorescence. Brain Research. 1972;43:429–435. doi: 10.1016/0006-8993(72)90398-8. - DOI - PubMed
    1. Bliss TV, Collingridge GL, Kaang BK, Zhuo M. Synaptic plasticity in the anterior cingulate cortex in acute and chronic pain. Nature Reviews Neuroscience. 2016;17:485–496. doi: 10.1038/nrn.2016.68. - DOI - PubMed

Publication types