. 2017 Oct:106:1-13.
doi: 10.1016/j.nbd.2017.06.008. Epub 2017 Jun 17.

Alzheimer's brains show inter-related changes in RNA and lipid metabolism

Affiliations

Alzheimer's brains show inter-related changes in RNA and lipid metabolism

Shahar Barbash et al. Neurobiol Dis. 2017 Oct.

Abstract

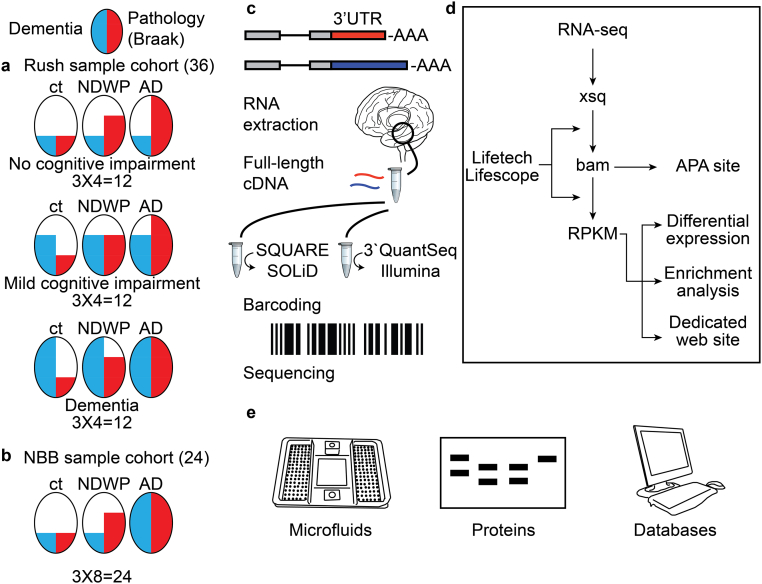
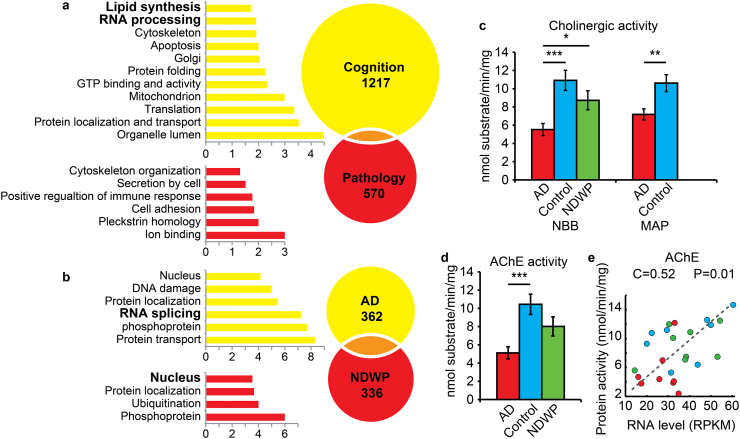
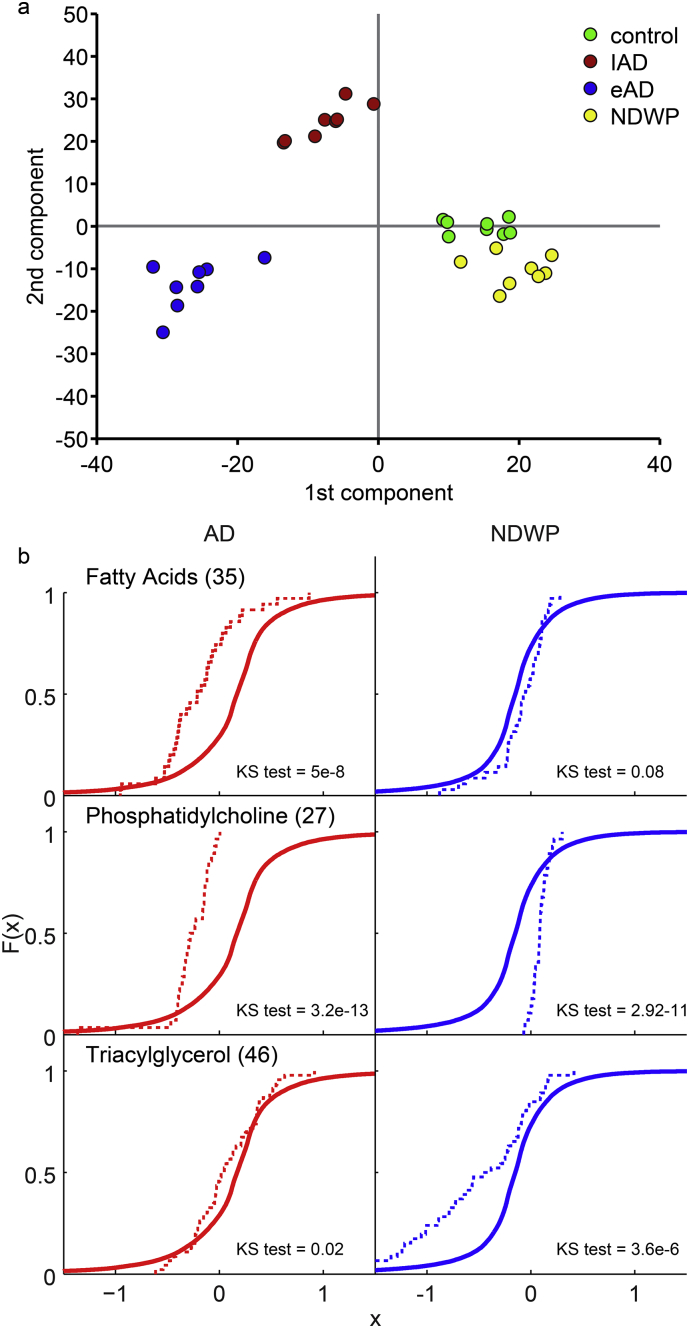
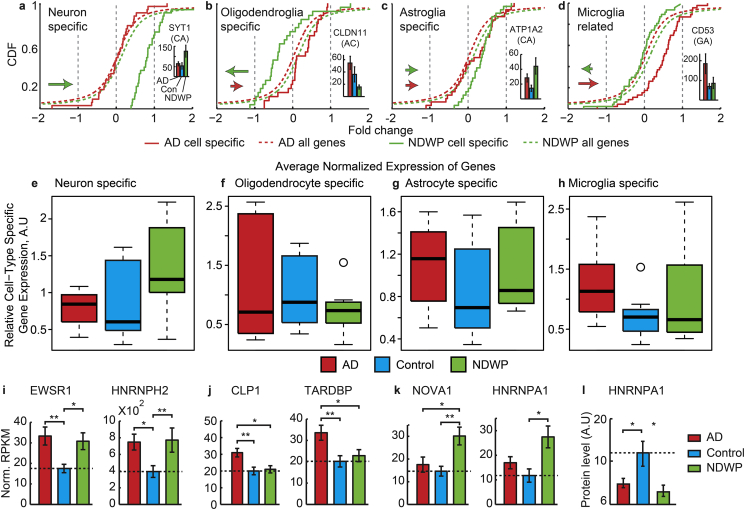
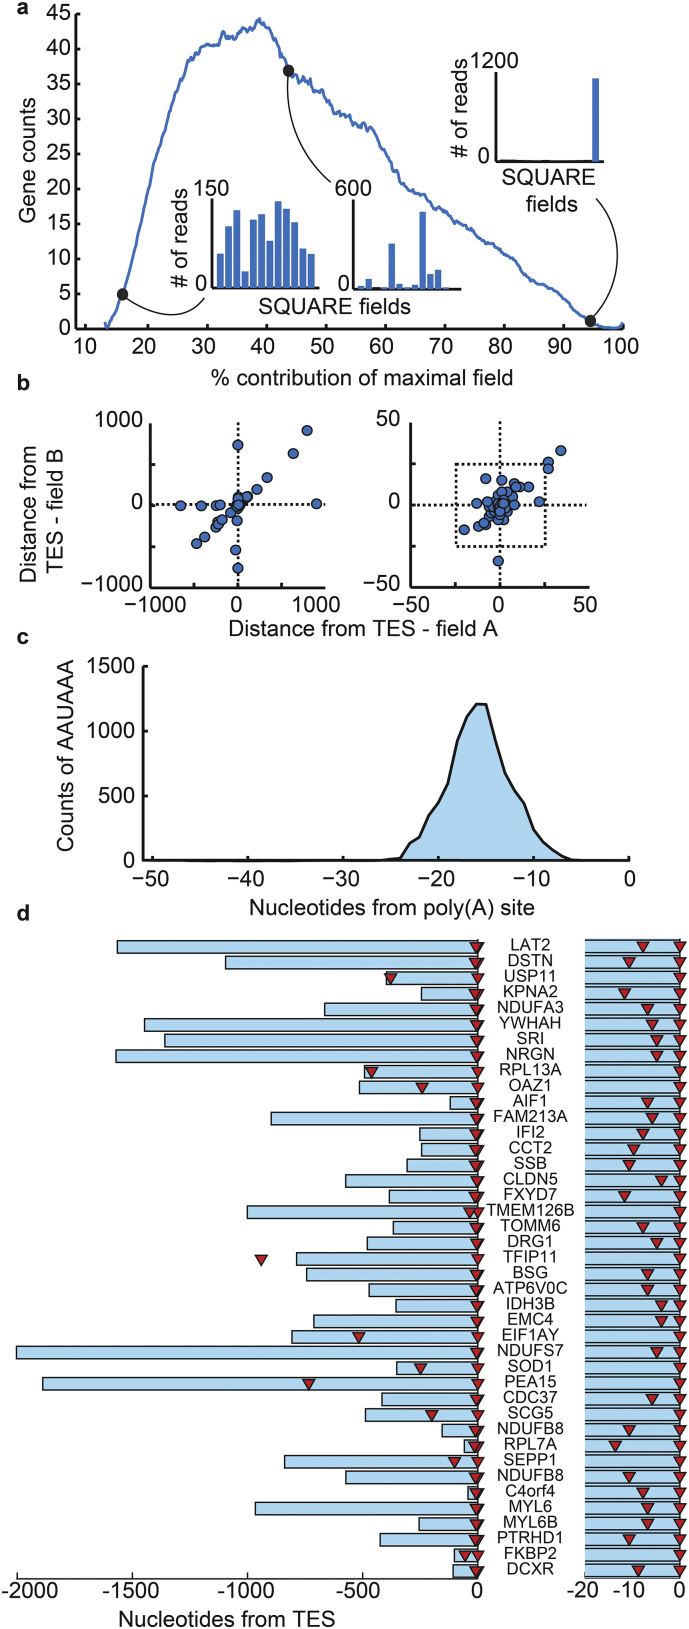
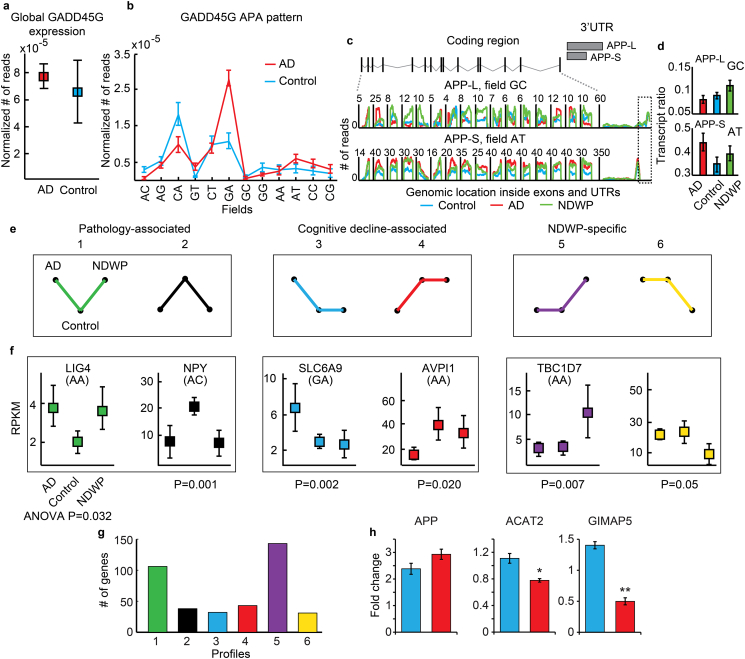
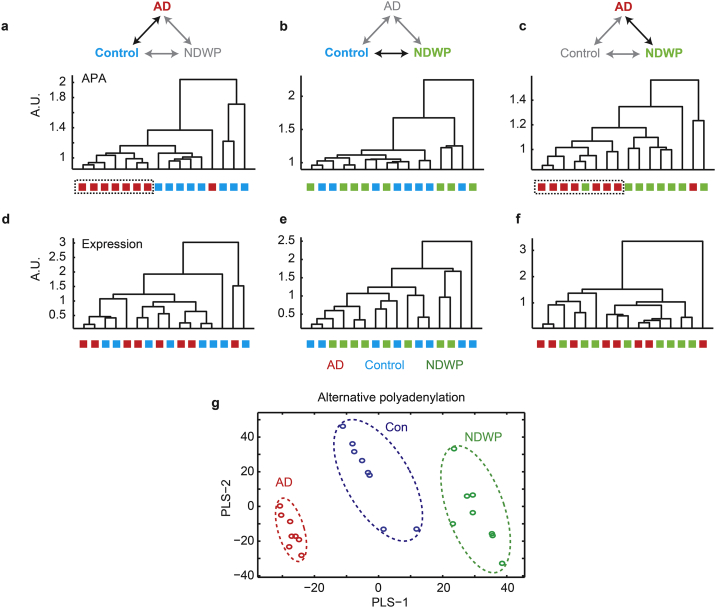
Alzheimer's disease (AD) involves changes in both lipid and RNA metabolism, but it remained unknown if these differences associate with AD's cognition and/or post-mortem neuropathology indices. Here, we report RNA-sequencing evidence of inter-related associations between lipid processing, cognition level, and AD neuropathology. In two unrelated cohorts, we identified pathway-enriched facilitation of lipid processing and alternative splicing genes, including the neuronal-enriched NOVA1 and hnRNPA1. Specifically, this association emerged in temporal lobe tissue samples from donors where postmortem evidence demonstrated AD neuropathology, but who presented normal cognition proximate to death. The observed changes further associated with modified ATP synthesis and mitochondrial transcripts, indicating metabolic relevance; accordingly, mass-spectrometry-derived lipidomic profiles distinguished between individuals with and without cognitive impairment prior to death. In spite of the limited group sizes, tissues from persons with both cognitive impairment and AD pathology showed elevation in several drug-targeted genes of other brain, vascular and autoimmune disorders, accompanied by pathology-related increases in distinct lipid processing transcripts, and in the RNA metabolism genes hnRNPH2, TARDBP, CLP1 and EWSR1. To further detect 3'-polyadenylation variants, we employed multiple cDNA primer pairs. This identified variants that showed limited differences in scope and length between the tested cohorts, yet enabled superior clustering of demented and non-demented AD brains versus controls compared to total mRNA expression values. Our findings indicate inter-related cognition-associated differences in AD's lipid processing, alternative splicing and 3'-polyadenylation, calling for pursuing the underlying psychological and therapeutics implications.

Keywords: Alternative polyadenylation; Alzheimer's disease; Cognitive decline; Lipidomics; Neuropathology; RNA sequencing.


Figures

Fig. 1
Fig. 1
Research outline. (a) Rush groups (b) NBB groups, with three sets of brain tissues from donors at three levels of dementia and pathology: apparently healthy controls (Braak stage = 0), documented early pathology (Braak stages 3–4) but no discernible dementia (NDWP) and advanced AD pathology and cognitive decline (Braak stages 5,6). Numbers of analyzed samples are noted above. (c) Sequencing data from the two cohorts were generated with two methods of library construction for RNA sequencing: 3′-QuantSeq, generating one most 3′-directed read per transcript, and SQUARE, identifying transcript variants with alternative 3′-UTR-APA by the 3′-segregation approach (scheme), based on 12 reverse-transcription sets using distinct poly(A)-adjacent 3′-primers (Methods), followed by barcoding and sequencing. (d) Schematic analytic design. Sequencing xsq files derived in both methods were processed with Liftech Lifescope software. Aligned bam files served to calculate RPKM values and detect APA sites, differential expression and enrichment results. (e) Validation tests involved: high-throughput Microfluidic RT-PCR, specific protein blots and enzyme activity tests and comparison to other databases.
Fig. 2
Fig. 2
Identifying strong cognition-associated expression differences. (a) Shown are histograms of the specific P values of 2-Way-ANOVA in which pathology and cognition served as the two parameters for the Rush groups. The Y axis shows cumulative counts of all transcripts. Circles show the numbers of genes changed with cognition (yellow) or pathology (red) in AD patients, and the overlap between them. Columns show the GO categories ranked by the P value of their enrichment score. (b) Venn diagram of differentially expressed genes in the AD and NDWP NBB groups and their associated GO enrichment terms, with the scale showing enrichment scores. (c) Cholinesterase activity changes in the NBB and Rush groups. (d) Expression fold change of AChE transcript levels in the three NBB patient groups (Mean ± SEM). One-way-ANOVA P < 0.05. (e) Scatter plot and correlation across the NBB patient groups of AChE RNA level with AChE enzymatic activity.
Fig. 3
Fig. 3
Inverse patterns of lipid profile differences in NDWP and AD. (a) Cumulative distribution functions of specific lipid subgroup levels for the AD and NDWP groups, each versus controls. KS = Kolmogorov Smirnov test for comparing distributions. (c) Partial least Square and discriminant analysis for lipid levels shown as scatter plot on the first and second components of the analysis. Controls (green) are inseparable from NDWP (yellow) while the early (blue) and late AD (red) groups are separable from one another.
Fig. 4
Fig. 4
In-depth sequencing identifies cell type-specific, cognition- and pathology-associated transcript differences. (a–h) NDWP NBB brains show up-regulated neuronal transcripts and down-regulated transcripts in other cell types. (a–d) Shown are cumulative distribution functions (CDFs) for the global change between AD or NDWP and control (dashed lines, red and blue, correspondingly) for the subgroups of cell type-specific genes, following Cahoy et al. (Cahoy et al., 2008) (solid lines, same colors). (a) Neuronal genes are sharply up-regulated in NDWP (a; Kolmogorov Smirnov (KS) P value < 0.0001). Columns: APA variant of the calcium sensor SYT1 with a 3′-CA terminus. (b) Oligodendroglia genes were down regulated in NDWP and up-regulated in AD (KS P value < 0.001). Columns: a 3′-AC-terminated variant of the central nervous system myelin-associated CLDN11 gene. (c) Astroglial genes were moderately up-regulated in both disease groups (KS P value < 0.01). Columns: a CA variant of the metabolic regulator ATP1A2. (d) Microglia-related genes were up regulated in both NDWP and AD. Columns: a 3′- GA variant of the differentiation marker CD53 and following Zhang (Zhang et al., 2013). (e–h) Parallel box plot presentation of normalized values for a different list of human cell-type characteristic genes, following Darmanis (Darmanis et al., 2015) with healthy control levels referred to as 1. Note parallel differences in this analysis as well. (i) AD-related differences in RNA metabolism genes: normalized RPKM values across the three patient groups (mean ± SEM) for EWSR1 and HNRNPH2 (One-way-ANOVA P values = 0.02 and 0.04, correspondingly), CLP1 and TARDBP (One-way-ANOVA P values = 0.005 and 0.02, correspondingly), and NOVA1 and HNRNPA1 (One-way-ANOVA P values = 0.005 and 0.02, correspondingly).
Fig. 5
Fig. 5
Characteristics of APA variations in the NBB groups. (a) Most transcripts show diverse APA variations. The histogram shows the % contribution of the maximal field to the observed reads for each transcript. Insets show distribution of expression across the fields for three examples. (b) Distance in nucleotides from RefSeq TES for the first (field A) and second (field B) major products, for a single patient. Right graph is zoom-in of left graph as shown on the X and Y axes. (c) Number of the poly(A) site consensus sequence ‘AAUAAA’ as distance from poly(A) site in sequencing reads. (d) 3′-UTR regions for representative genes with at least 2 poly(A) sites identified, aligned according to their transcription end site (Gaugler et al., 2014). Proximal and distal APA variants are marked as red triangles. Right side part: zoom-in for the TES-adjacent 20 nucleotide region for each of the genes shown. Note that the APA distance is shorter than 20 nucleotides for over 80% of these transcripts.
Fig. 6
Fig. 6
APA variants classify patient groups better than cumulative transcripts from all fields together. (a) Expression levels of GADD45G in AD patients and controls. (b) APA pattern of GADD45G in AD (red) and controls (blue). Shown are averages ± SEM of expression in each SQUARE field in the patient groups, note switch between the proximal and distal products from controls to AD. Fields ‘CA’ and ‘GA’, but none of the others neither the global transcript counts show significant change. (c) APP gene structure with two APA variants; one with a long (APP-L) and one with a short 3′-UTR (APP-S). Numbers of sequencing reads across APP exons in SQUARE fields ‘GC’ and ‘AT’. The unique 3′-UTR region of APP-L is marked in a dashed rectangle. (d) Number of reads in specific SQUARE fields divided by the number of total transcript reads in each sample for APP-L and APP-S. In both cases One-way-Anova-P value has been < 0.05. (e) Predicted profiles of expression differences between the groups may reflect association with pathology, cognitive decline or NDWP-specific features. (f) Mean ± 95% confidence level for the exemplary genes LIG4, NPY, SLC6A9, AVPI1, TBC1D7, and NDUFA3, each presenting a distinct profile (colors as in a). (g) Bar graph for transcript APA counts in each profile (colors as in e). (h): Normalized luciferase activity for transcripts harboring the long (L – blue bars) or the short (S – red bars) 3′UTRs of APP, ACAT2 and GIMAP5. Briefly, the complete 3′-UTRs of human APP, ACAT2 and GIMAP5 were amplified from genomic DNA, and cloned downstream of the Renilla luciferase gene in psiCHECK2 (Clonetech) using XhoI and NotI. To create vectors expressing the short 3′-UTR alone, this region of the 3′- UTR from each of the cloned transcripts was similarly sub-cloned into psiCHECK2. To obtain expression of the long 3′ UTR isoform alone, the proximal polyadenylation site was mutated from AAUAAA to ACUCAA (APP, ACAT2) and AAUAGA to AAUCGA (GImAP5) using QuickChange Site Directed Mutagenesis (Agilent). HEK-293 cells were cultured in DMEM supplemented with 10% fetal bovine serum and transfected with TransIT-X2 (Mirus) according to the manufacturer's instructions. Cells were then incubated overnight before performing luciferase assays. Luciferase activity was assessed using the Dual-Glo system (Promega) performed according to the manufacturer's instructions. Renilla fluorescence was normalized to firefly signal, and results are presented as this ratio.
Fig. 7
Fig. 7
Alternative polyadenylation segregates AD from NDWP and controls better than the summated total expression values. (a–c) Dendrograms based on APA ratio correlation for AD vs. controls (a), NDWP vs. controls (b) and AD vs. NDWP (c) based on all SQUARE fields and therein segregated transcripts. (d–f) Dendrograms based on total expression values obtained by pooling of all SQUARE fields for AD vs. controls (d), NDWP vs. controls (e) and AD vs. NDWP (f). (g) Patients' PLS differentiates AD from NDWP and controls based on alternative polyadenylation values.

References

    1. An J.J. Distinct role of long 3′ UTR BDNF mRNA in spine morphology and synaptic plasticity in hippocampal neurons. Cell. 2008;134:175–187. - PMC - PubMed
    1. Andrade-Moraes C.H. Cell number changes in Alzheimer's disease relate to dementia, not to plaques and tangles. Brain. 2013;136:3738–3752. - PMC - PubMed
    1. Arancillo M. Titration of Syntaxin1 in mammalian synapses reveals multiple roles in vesicle docking, priming, and release probability. J. Neurosci. 2013;33:16698–16714. - PMC - PubMed
    1. Balla T. Phosphoinositides: tiny lipids with giant impact on cell regulation. Physiol. Rev. 2013;93:1019–1137. - PMC - PubMed
    1. Bandaru V.V. ApoE4 disrupts sterol and sphingolipid metabolism in Alzheimer's but not normal brain. Neurobiol. Aging. 2009;30:591–599. - PMC - PubMed