. 2017 Aug;206(4):1747-1761.
doi: 10.1534/genetics.117.203521. Epub 2017 Jun 19.

Toward Universal Forward Genetics: Using a Draft Genome Sequence of the Nematode Oscheius tipulae To Identify Mutations Affecting Vulva Development

Affiliations

Toward Universal Forward Genetics: Using a Draft Genome Sequence of the Nematode Oscheius tipulae To Identify Mutations Affecting Vulva Development

Fabrice Besnard et al. Genetics. 2017 Aug.

Abstract

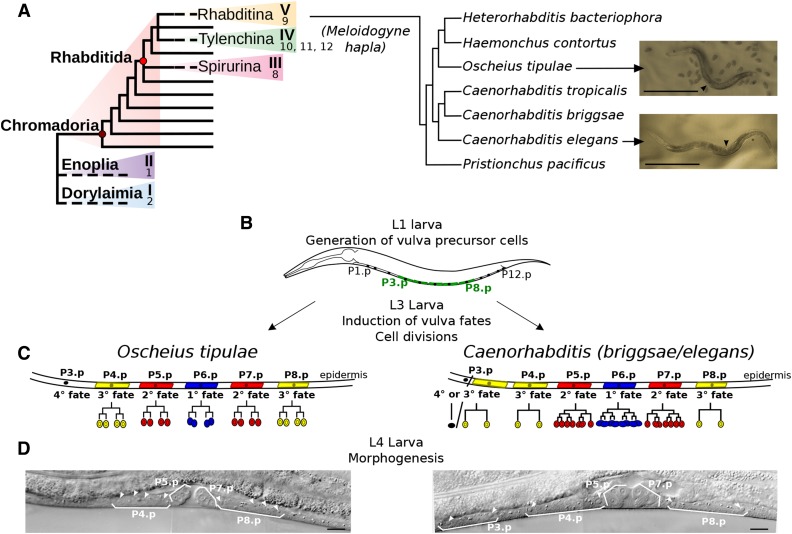
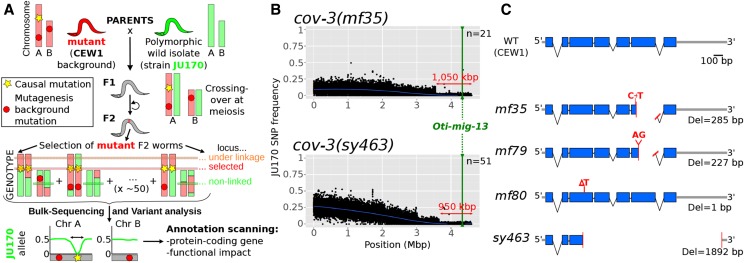
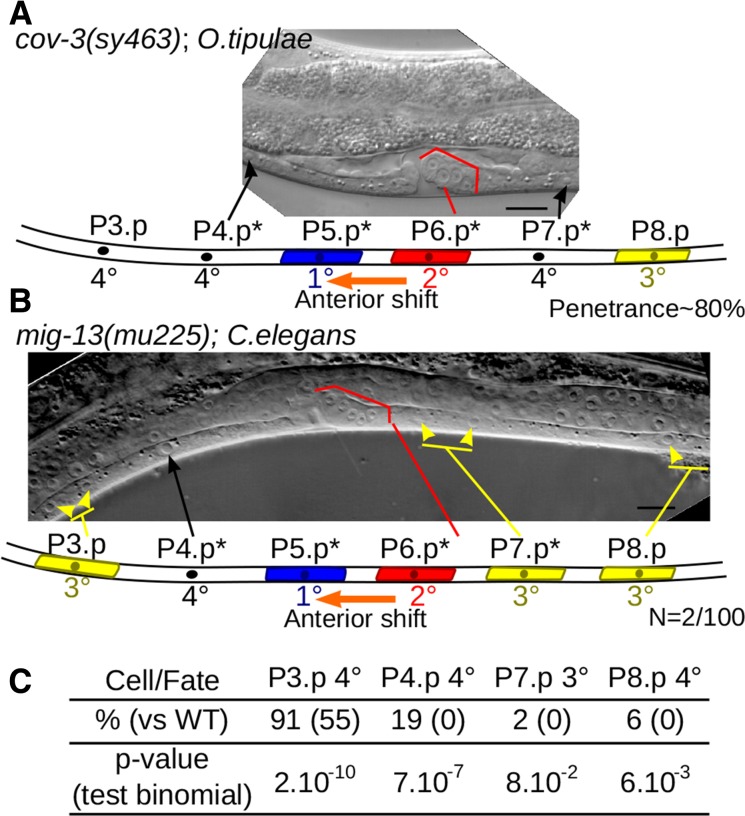
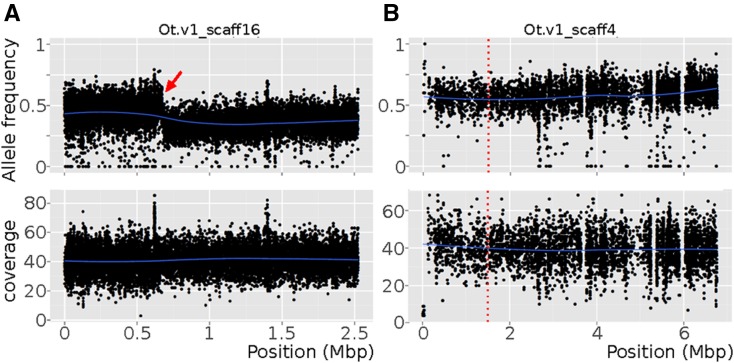
Mapping-by-sequencing has become a standard method to map and identify phenotype-causing mutations in model species. Here, we show that a fragmented draft assembly is sufficient to perform mapping-by-sequencing in nonmodel species. We generated a draft assembly and annotation of the genome of the free-living nematode Oscheius tipulae, a distant relative of the model Caenorhabditis elegans We used this draft to identify the likely causative mutations at the O. tipulae cov-3 locus, which affect vulval development. The cov-3 locus encodes the O. tipulae ortholog of C. elegans mig-13, and we further show that Cel-mig-13 mutants also have an unsuspected vulval-development phenotype. In a virtuous circle, we were able to use the linkage information collected during mutant mapping to improve the genome assembly. These results showcase the promise of genome-enabled forward genetics in nonmodel species.

Keywords: Oscheius tipulae; genome assembly; mapping-by-sequencing; mig-13; vulva development.


Figures

Figure 1
Figure 1
Phylogenetic relationships of O. tipulae and comparison of vulva development with C. elegans. (A) Cartoons showing (left) the systematic structure phylum Nematoda [clades I–V or 1–12 defined according to Blaxter et al. (1998), p. 199, and van Megen et al. (2009), respectively] and (right) the relationship of O. tipulae to key Rhabditina species discussed in the text. Pictures of young adult hermaphrodites of O. tipulae and C. elegans are shown on the right (arrowhead pointing to the vulva). Bar, 0.5 mm. (B–D) Vulva development in O. tipuale and C. elegans. (B) Ventral epidermal cells called P3.p to P8.p are specified as vulva precursor cells in young L1 larvae. (C) Conserved anteroposterior pattern of cell fates, despite variation in cell lineages: P6.p occupies the central position and adopts a 1° fate, P5.p and P7.p are induced to follow a 2° fate, and their daughters will form the border of the vulval invagination. Other cells (P3,4,8.p) differentiate into nonvulval epidermal fates, either with or without one round of division (3° or 4° fates, respectively). (D) Nomarski images of wild-type, L4-stage hermaphrodites (left, O. tipulae; right, C. elegans), highlighting the daughter cells of the Pn.p cells (arrowheads). Bar, 10 µm.
Figure 2
Figure 2
Mapping-by-sequencing of O. tipulae vulva mutants and identification of cov-3 mutations in the Oti-mig-13 gene. (A) Principle of the mapping-by-sequencing approach, involving the wild isolate JU170 as a mapping strain and whole-genome resequencing of a bulk of mutant F2 grand-progeny (see text for details). The phenotype-causing mutation is mapped genetically by the cross as the region of low frequency of JU170 alleles. Final identification requires scanning of this interval for variations specific to the mutant background. (B) JU170 allele frequency plots in scaffold 1 (genome version nOt.2.0.) in bulk-sequencing data generated with the independent cov-3 alleles mf35 and sy463 (upper and lower plots respectively). On each plot, the blue line is a local regression of the JU170 allele frequency, the red arrow indicates the mapping interval size, the green line the position of the mig-13 gene, and n the number of F2 lines pooled in each mapping population. (C) Cartoon depicting the structure of the wild-type Oti-mig-13 gene and the alterations found in all independent alleles isolated so far. Mutations are indicated in red, exons are blue boxes, introns thin black lines, and intergenic regions thick gray lines. Del, deletion; WT, wild type.
Figure 3
Figure 3
Conservation and evolution of MIG-13 between C. elegans and O. tipulae. (A) Typical phenotype of a Oti-cov-3 mutant, shown in a Nomarski picture and an interpretation cartoon below: an anterior shift (1° fate shifted from P6.p to P5.p) is coupled to a reduced competence of vulva precursor cells. * indicates Pn.p cells with a modified fate compared to the wild type. (B) A cov-3-like phenotype can be observed at very low frequency in a mig-13 null mutant, Cel-mig13(mu225), of C. elegans. (C) Reduced competence of P3,4,8.p cells in Cel-mig-13(mu225) is indicated by increased frequency of 4° fate vs. 3° fate. WT, wild type.
Figure 4
Figure 4
Mapping-by-sequencing detects mis-assembly. Variant analysis was performed using the preliminary assembly (nOt.1.0). Plots obtained from mapping-by-sequencing data set from the cov-3(sy463) mapping population. JU170 allele frequency is plotted in upper graphs for each SNP along (A) contig 16 or (B) contig 4 and the coverage is indicated below. Blue lines are local regressions of the allele frequency or of the coverage. (A) Contig 16: ← indicates a sudden shift in JU170 allele frequencies in the scaffold. (B) Contig 4: a REAPR FCD threshold score was deduced from plots with obvious breaks and applied to all scaffolds. Overscaffolding was detected in scaffold 4 (red vertical dotted line) in the absence of any conspicuous break in SNP frequency.
Figure 5
Figure 5
Building a chromosome-scale assembly of the O. tipulae draft assembly. (A) The O. tipulae cluster of scaffolds that correspond to the X chromosome. This cluster was selected from a global clustering based on JU170 allele mean frequency across 18 F2 mapping populations. The entire heatmap is shown in Figure S8. Each column of the heatmap corresponds to an independent F2 mapping population (Table S3) and each rectangle to the mean frequency of JU170 alleles in a scaffold. Scaffold identifiers are listed on the right side of the heatmap and the color scale is given above. If available, the prediction made from orthology-driven clusters (Figure S9) is indicated on the left side of the heat map. * indicates scaffolds where the causative cov-3 mutation has been found. (B) Method to distinguish autosome-linked vs. X-linked loci. a and b loci are on an autosome (Aut.) and the X chromosome, respectively, and are polymorphic between two strains (alleles x and y). While F1 hermaphrodites are heterozygotes for both loci, F1 males are homozygotes for the X-linked locus and bear the maternal allele. (C and D) Pyrograms of an F1 male progeny (left) from a CEW1 hermaphrodite (middle) and a JU170 male (right): genotyping was performed with polymorphic markers in scaffold 14 and 31 (assembly nOt.2.0.), which are placed in genetic clusters (C and D), respectively. Scaffold 14 is linked to X while scaffold 31 is linked to an autosome. (E) Cumulative length of each cluster of scaffolds. Numbers within bars are percent of the whole assembly, numbers below the chart count the number of scaffolds in each cluster. ♀, female; ♂, male; blind, scaffolds bearing no genomic variants between JU170 and CEW1; low, scaffolds with consistent low mean JU170 allele frequency; roman numbers, chromosomes; Un., unplaced scaffolds.

References

    1. Abe A., Kosugi S., Yoshida K., Natsume S., Takagi H., et al. , 2012. Genome sequencing reveals agronomically important loci in rice using MutMap. Nat. Biotechnol. 30: 174–178. - PubMed
    1. Ahn I. Y., Winter C. E., 2006. The genome of Oscheius tipulae: determination of size, complexity, and structure by DNA reassociation using fluorescent dye. Genome 49: 1007–1015. - PubMed
    1. Anderson P., 1995. Mutagenesis. Methods Cell Biol. 48: 31–58. - PubMed
    1. Andrews, S., 2010 FastQC A Quality Control Tool for High Throughput Sequence Data. http://www.bioinformatics.babraham.ac.uk/projects/fastqc/.
    1. Baïlle D., Barrière A., Félix M.-A., 2008. Oscheius tipulae, a widespread hermaphroditic soil nematode, displays a higher genetic diversity and geographical structure than Caenorhabditis elegans. Mol. Ecol. 17: 1523–1534. - PubMed

Publication types

Substances