. 2017 Aug 8;199(17):e00111-17.
doi: 10.1128/JB.00111-17. Print 2017 Sep 1.

Polar Organizing Protein PopZ Is Required for Chromosome Segregation in Agrobacterium tumefaciens

Affiliations

Polar Organizing Protein PopZ Is Required for Chromosome Segregation in Agrobacterium tumefaciens

Haley M Ehrle et al. J Bacteriol. .

Abstract

Despite being perceived as relatively simple organisms, many bacteria exhibit an impressive degree of subcellular organization. In Caulobacter crescentus, the evolutionarily conserved polar organizing protein PopZ facilitates cytoplasmic organization by recruiting chromosome centromeres and regulatory proteins to the cell poles. Here, we characterize the localization and function of PopZ in Agrobacterium tumefaciens, a genetically related species with distinct anatomy. In this species, we find that PopZ molecules are relocated from the old pole to the new pole in the minutes following cell division. PopZ is not required for the localization of the histidine kinases DivJ and PdhS1, which become localized to the old pole after PopZ relocation is complete. The histidine kinase PdhS2 is temporally and spatially related to PopZ in that it localizes to transitional poles just before they begin to shed PopZ and disappears from the old pole after PopZ relocalization. At the new pole, PopZ is required for tethering the centromere of at least one of multiple replicons (chromosome I), and the loss of popZ results in a severe chromosome segregation defect, aberrant cell division, and cell mortality. After cell division, the daughter that inherits polar PopZ is shorter in length and delayed in chromosome I segregation compared to its sibling. In this cell type, PopZ completes polar relocation well before the onset of chromosome segregation. While A. tumefaciens PopZ resembles its C. crescentus homolog in chromosome tethering activity, other aspects of its localization and function indicate distinct properties related to differences in cell organization.IMPORTANCE Members of the Alphaproteobacteria exhibit a wide range of phenotypic diversity despite sharing many conserved genes. In recent years, the extent to which this diversity is reflected at the level of subcellular organization has become increasingly apparent. However, which factors control such organization and how they have changed to suit different body plans are poorly understood. This study focuses on PopZ, which is essential for many aspects of polar organization in Caulobacter crescentus, but its role in other species is unclear. We explore the similarities and differences in PopZ functions between Agrobacterium tumefaciens and Caulobacter crescentus and conclude that PopZ lies at a point of diversification in the mechanisms that control cytoplasmic organization and cell cycle regulation in Alphaproteobacteria.

Keywords: Agrobacterium; PopZ; cell division; cell polarity; chromosome segregation.


Figures

FIG 1
FIG 1
Growth characteristics of wild-type and ΔpopZ cells. (A) The table records average doubling times of the indicated strains growing at exponential phase in ATGN medium at 30°C. Through observation by phase-contrast microscopy, cells with sidewall extensions or forked poles were distinguishable from normal rod-shaped cells and counted as Y-forms. Data were collected from >250 cells, counting 40 to 60 individuals from two representative fields in three separate experiments. (B) Phase-contrast images of cells growing at exponential phase. Examples of Y-form cells are marked by asterisks. (C) A time course showing a ΔpopZ cell elongating and splitting at the growth pole to produce two growth poles (arrowheads). Phase-contrast images are shown in grayscale and time is displayed in minutes.
FIG 2
FIG 2
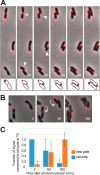
Dynamic subcellular localization and long-term stability of PopZ. (A) Time-lapse images of cells expressing mChy-PopZ (red), overlaid on a phase-contrast background (grayscale), with time displayed in minutes. Arrowheads indicate newborn daughter cells in which mChy-PopZ foci are relocated from old pole to new pole. The asterisk indicates a cell in which mChy-PopZ accumulates at the site of cell division before the daughter cells are clearly separated. For clarity, the lower cell is drawn in cartoon form at the bottom of the images. (B) Time-lapse images showing the fate of mEos3.2-PopZ after photoconversion into the red form at the 0-min time point (T0). Arrows indicate the transition from old pole to new pole. (C) Quantitative analysis of mEos3.2-PopZ localization dynamics. We identified 20 cells that divided and completed the transition in mEos3.2-PopZ localization during a 180-min time course in each of three separate experiments. For each cell, the fluorescence intensity of photoconverted mEos3.2-PopZ at the new pole or the old pole at the indicated time was divided by the intensity of photoconverted mEos3.2-PopZ at the original pole at T0. The chart shows average values and standard deviations from the means.
FIG 3
FIG 3
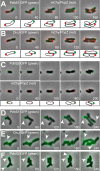
Subcellular localization of polar regulator proteins in wild-type and ΔpopZ mutants. (A to C) PdhS1-GFP, DivJ-GFP, or PdhS2-GFP was coexpressed with mChy-PopZ in wild-type cells, and the localization patterns were observed by time-lapse fluorescence microscopy. In panel C, red and green fluorescence channels from the same dividing cells are compared in separate image sequences. For clarity, the cells are drawn in cartoon form at the bottom of the image panels. (D to F) PdhS1-GFP, DivJ-GFP, or PdhS2-GFP was expressed in ΔpopZ cells, and localization was observed by time-lapse fluorescence microscopy. Arrowheads indicate polar fluorescent foci. In all panels, each image shows an individual frame from a time-lapse series, with time in minutes shown. Fluorescence images (in red and green) are overlaid on a phase-contrast background.
FIG 4
FIG 4
Dynamic localization of chromosome I centromeres in wild-type and ΔpopZ mutant cells. (A) YFP-ParBI expression was used to track the position of chromosome I centromeres in wild-type cells in a time-lapse image series. Arrowheads point to YFP-ParBI foci that are moving toward the new cell poles, indicating chromosome I segregation. (B) The frequency distribution of the number of YFP-ParBI foci in wild-type and ΔpopZ cells. Corresponding cell lengths with standard deviations are indicated. (C) The locations of YFP-ParBI centromeres were plotted as a function of cell length in cells with one and two foci. Blue points indicate the positions of centromeres nearest to a cell pole, and orange points indicate the position of the other centromere. (D and E) Time-lapse image series showing YFP-ParBI localization in ΔpopZ cells. For panel E, time-lapse microscopy was performed on cells in which total DNA was labeled with DAPI (blue). Asterisks indicate daughter cells that fail to inherit a YFP-ParB focus and, in panel E, very little total DNA. The arrow points to an old pole that acquires a YFP-ParBI focus after centromere duplication. (F) Quantitative analysis of YFP-ParBI localization in time-lapse experiments. In panels A, D, and E, individual frames from time lapse series are shown, with time in minutes displayed. Fluorescence images are overlaid on a phase-contrast background. For clarity, the cells are drawn in cartoon form at the bottom of the images. Quantitative data shown in panels B, C, and F were collected from >250 cells, counting 40 to 60 individuals from two representative fields in three separate experiments.
FIG 5
FIG 5
Analysis of chromosome I segregation with respect to dynamic PopZ localization and cell length. (A) Cells expressing YFP-ParBI (green) and mChy-PopZ (red) were observed by time-lapse fluorescence microscopy. Fluorescence images were overlaid on a phase-contrast image (grayscale), and time in minutes is displayed. For clarity, the upper cell is drawn in cartoon form at the tops of the images. Cells that inherit a bright focus of mChy-PopZ (closed red stars) are distinguished from their siblings (open red stars). For each cell, the segregating centromere (arrowhead) and the first appearance of a clear mChy-PopZ focus at the new cell pole (asterisk) are indicated. (B) Box plots showing the difference in the time of initiation of chromosome I segregation (green) and in the appearance of a distinct focus of mChy-PopZ at the new pole (red) between the two distinct daughter cell types. Initiation of chromosome segregation was marked as the first time frame that showed two YFP-ParBI foci. For mChy-PopZ, a distinct focus was scored if at least four adjacent pixels had intensity values that were higher than local background noise. (C) Box plots showing the difference in time between the appearance of distinct mChy-PopZ foci at the new pole and the initiation of chromosome I segregation in the two distinct daughter cell types. A negative value indicates that chromosome segregation was observed after the appearance of a polar focus of mChy-PopZ. (D) Box plots showing the length of time between the initiation of chromosome centromere I segregation and the arrival of one copy of centromere I at the new pole. (E) Box plots showing the cell length ratio for the two daughter cell types at the time of the initiation of chromosome I segregation and at cell division. (F) A scatter plot showing the relationship between cell length at birth and the time until the initiation of chromosome I segregation for the two distinct daughter cell types. Linear regressions and their associated R-squared values are indicated. For the box plots shown in panels B to E, 20 cells were measured from each of three separate time-lapse experiments. The midlines in the boxes indicate median values, the top and bottom edges of the boxes encompass the first and third quartiles of the data points, and whiskers mark one standard deviation from the sample mean. P values from a 1-tailed paired-value Student t test indicates that the differences are statistically significant.
FIG 6
FIG 6
Model of chromosome I segregation and dynamic polar regulatory protein localization in A. tumefaciens. This model shows the relative positions of chromosome I, PopZ, and other polar regulatory proteins over the course of a normal A. tumefaciens cell cycle. Note that the daughter cells differ in polar inheritance and cell cycle progression, yet they produce a similar predivisional cell.

Similar articles

Cited by

References

    1. Davis BM, Waldor MK. 2013. Establishing polar identity in gram-negative rods. Curr Opin Microbiol 16:752–759. doi:10.1016/j.mib.2013.08.006. - DOI - PMC - PubMed
    1. Tsokos CG, Laub MT. 2012. Polarity and cell fate asymmetry in Caulobacter crescentus. Curr Opin Microbiol 15:744–750. doi:10.1016/j.mib.2012.10.011. - DOI - PMC - PubMed
    1. Kirkpatrick CL, Viollier PH. 2012. Decoding Caulobacter development. FEMS Microbiol Rev 36:193–205. doi:10.1111/j.1574-6976.2011.00309.x. - DOI - PubMed
    1. Collier J. 2016. Cell cycle control in Alphaproteobacteria. Curr Opin Microbiol 30:107–113. doi:10.1016/j.mib.2016.01.010. - DOI - PubMed
    1. Van der Henst C, Beaufay F, Mignolet J, Didembourg C, Colinet J, Hallet B, Letesson J-J, De Bolle X. 2012. The histidine kinase PdhS controls cell cycle progression of the pathogenic alphaproteobacterium Brucella abortus. J Bacteriol 194:5305–5314. doi:10.1128/JB.00699-12. - DOI - PMC - PubMed

MeSH terms