. 2017 Jul 3;216(7):2217-2230.
doi: 10.1083/jcb.201601109. Epub 2017 Jun 19.

Extracellular vesicles of stromal origin target and support hematopoietic stem and progenitor cells

Affiliations

Extracellular vesicles of stromal origin target and support hematopoietic stem and progenitor cells

Gregoire Stik et al. J Cell Biol. .

Abstract

Extracellular vesicles (EVs) have been recently reported as crucial mediators in cell-to-cell communication in development and disease. In this study, we investigate whether mesenchymal stromal cells that constitute a supportive microenvironment for hematopoietic stem and progenitor cells (HSPCs) released EVs that could affect the gene expression and function of HSPCs. By taking advantage of two fetal liver-derived stromal lines with widely differing abilities to maintain HSPCs ex vivo, we demonstrate that stromal EVs play a critical role in the regulation of HSPCs. Both supportive and nonsupportive stromal lines secreted EVs, but only those delivered by the supportive line were taken up by HSPCs ex vivo and in vivo. These EVs harbored a specific molecular signature, modulated the gene expression in HSPCs after uptake, and maintained the survival and clonogenic potential of HSPCs, presumably by preventing apoptosis. In conclusion, our study reveals that EVs are an important component of the HSPC niche, which may have major applications in regenerative medicine.


Figures

Figure 1.
Figure 1.
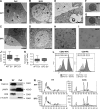
Characterization of AFT- and BFC-released EVs. (A–I) Electron microscopy characterization. (A and C) AFT (A) and BFC (C) cell lines showing MVB structures (arrowheads) in the cell cytoplasm. (B) MVB magnification of AFT MVBs showing round structures (arrows) of EV size. (D) Same as B, but with BFC. (E) AFT cell releasing EVs (arrows). The dotted line depicts the connection between the MVB and the cell surface. (F) AFT EV observed by cryoTEM. (G) BFC EV observed by cryoTEM. Double-headed arrows indicate the external lipid bilayer. (H and I) AFT EV (H) and BFC EV (I) observed at a larger scale. Bars: (A and C) 5 µm; (B and D) 500 nm; (E) 2 µm; (F–I) 50 nm. (J and K) Size measurement (J) and total protein quantification (K) of AFT and BFC EVs. (L) Flow cytometric analysis of CD63 (left) and CD9 (right) expression on the EV fraction from AFT and BFC cell culture medium. Box and whisker plots describe interquartile ranges and SD. Tot, total. (M) Western blot analysis of TSG101, LAMP1, CD9, and α-tubulin expression in AFT EVs and cells. (N) Bioanalyzer sizing and quantification of AFT and BFC RNA from EVs and cells. FU, fluorescent unit.
Figure 2.
Figure 2.
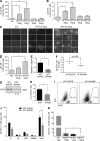
Internalization of AFT- and BFC-derived EVs. (A) Quantification of AFT and BFC EV internalization by LSK cells analyzed by ImageStreamX (Amnis; n = 3). (B) Representative micrographs of LSK cells. Green dots show PKH67-stained EVs (600× magnification). (C) AFT cell expressing CD63-GFP in close contact with a hematopoietic cell (white arrow; 400× magnification). (D) Coculture of AFT-CD63-GFP with LSK cells. ImageStreamX analysis with GFP and CD45 expression. The hematopoietic cell population is contained within the red-framed area R4. R3 represents CD45+ GFP+ double-positive cells. Percentages are indicated below the graph. (E) Cell representative of R3. (F) Internalization of AFT EV by CD45, CD45+, and LSK cells 24 h after intrafemoral injection. Error bars show SEM. *, P < 0.05.
Figure 3.
Figure 3.
Role of stromal EVs in HSPC maintenance ex vivo. (A) Proliferation of LSK cells cocultured 96 h with two quantities of stromal EVs in the absence of cytokines (n = 6). (B) Clonogenic potential of LSK cells cocultured 96 h with two quantities of stromal EVs (n = 6). (C) Representative micrographs depicting colony-forming units (CFUs). Note the difference in number (nb) and size between the two doses of AFT EVs. These figures are composites of multiple separate images. (D) Dose effect of AFT EVs on the maintenance of LSK cells after 96 h (n = 3). (E) Quantitative PCR measurement of RalB expression in AFT-shSCR– or AFT-shRalB–transduced cells. (F) Total protein quantification of EVs collected after culture of AFT-shSCR or AFT-shRalB cells. (G) Western blot analysis of CD63 protein expression in AFT-shSCR or AFT-shRalB cells. (H) Percentage of CD45+ cells after LSK/AFT-shSCR or AFT-shRalB cocultures during 96 h. (I) Representative flow cytometry analysis of CD45 expression in cocultures. (J) Clonogenic potential of LSK cocultures with AFT-shSCR or AFT-shRalB cells (n = 3). G, granulocyte; GEMM, granulocyte/erythrocyte/macrophage/megakaryocyte; GM, granulocyte/macrophage; M, macrophage. (K) Clonogenic potential of LSK cocultures with AFT cells or different fractions of AFT CM after sequential centrifugation at 300 g (CM AFT-300g), 2,000 g (CM AFT-2kg), and 110,000 g (CM AFT-110kg; n = 3). Error bars show SEM. *, P < 0.05.
Figure 4.
Figure 4.
RNA-seq analysis of the molecular signatures displayed by the stromal cells and the EV. (A) Workflow chart of the RNA-seq analysis. NGS, next-generation sequencing. (B and C) Global analysis of the small RNA (B) and poly-A–RNA (C) libraries. For the small RNA libraries, all the sequenced reads are represented, and for the poly-A–RNA libraries, only the most abundant genes (RPKM > 100) are represented. (D) PCA of the global miRNA (left) and poly-A RNA (right) transcriptomes.
Figure 5.
Figure 5.
Analysis of the poly-A RNA and small RNA signatures. (A) Venn diagrams showing the intersections of the specific mRNA sets. DEGs between categories are filtered (P < 0.0001 and fold change >2); intersections and subtractions are performed to obtain minimal gene sets specific for each category. Numbers in bold represent the gene set specific for each category and were used to perform GO analysis using the DAVID database. (B) PCA based on the GO scores obtained for each gene set (left). The loading plot (right) shows the most relevant categories correlated with the axes. Adh, cell adhesion; Anion, anion channel activity; Apop, apoptosis; Ccy, cell cycle; Chro, chromosome; EGF, EGF motif; Hep b, heparin binding; Junc, cell junction; Kina, kinase; Mig, migration; Orga, nonmembrane-bound organelle; Ribo, ribosome; Sign, signal; Vess, vessel; WD40, WD40 repeat. (C) Venn diagrams showing the intersections of the specific miRNA sets. Differentially expressed miRNAs between categories were filtered (P < 0.0001 and fold change >2), and intersections were performed to obtain minimal miRNA sets specific for each category. Numbers in bold represent the gene set specific for each category and were used to perform GO analysis of the miRNA-predicted targets using the miRsystem database. (D) PCA based on the GO scores obtained for each gene set. (E) Enrichment scores of GO categories of the putative targets of each specific miRNA set (miRsystem).
Figure 6.
Figure 6.
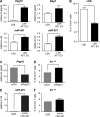
mRNAs and miRNAs transfer from AFT EVs to LSK cells and apoptotic assay. (A) Expression changes of Peg10 and Bag1 mRNAs and miR-451 and miR-221 miRNAs in LSK cells after contact with AFT EVs. Quantitative PCR analyses were normalized using GAPDH for mRNAs and U6 internal control for miRNAs (n = 3). (B) Measurement of apoptosis by annexin V (AnnV) and 7AAD staining in LSK cells cocultured for 18 h with or without AFT EVs in the absence of cytokines (n = 3). (C and E) Expression of Peg10 and miR-451 in lineage-negative cells transfected with siPeg10 (C) or mimic-451 (E). (D and F) Measurement of apoptosis using annexin V and 7AAD staining in lineage-negative cells transfected with siPeg10 (D) and mimic-451 (F; n = 3). All the cultures were performed in absence of cytokines. Error bars show SEM. *, P < 0.05.
Figure 7.
Figure 7.
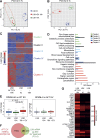
RNA signature changes in LSK cells after contact with AFT EVs. (A) PCA on the global transcriptomes of LSK-naive cells (LSK t0) and LSK cells cultured without cytokines during 18 h with or without AFT EVs (LSK+EV 18h and LSK 18h, respectively). (B) PCA based on the 2,051 DEGs between LSK 18 h and LSK 18 h + EV (one way ANOVA; P < 0.05). (C) Heat map and k-mean hierarchical clustering based on the 2,051 DEGs revealed five gene clusters. (D) GO enrichment analysis of the clusters. FAD, flavin adenine dinucleotide. (E) Relative mean expression of highly expressed AFT EV genes (RPKM >50) in LSK cells before and after contact. (F) Venn diagram of the most abundant genes in AFT EVs and genes highly up-regulated in LSK cells after EV treatment. FC, fold change. (G) Heat map of the common genes in F.

References

    1. Abkowitz J.L., Persik M.T., Shelton G.H., Ott R.L., Kiklevich J.V., Catlin S.N., and Guttorp P.. 1995. Behavior of hematopoietic stem cells in a large animal. Proc. Natl. Acad. Sci. USA. 92:2031–2035. 10.1073/pnas.92.6.2031 - DOI - PMC - PubMed
    1. Anzai N., Lee Y., Youn B.S., Fukuda S., Kim Y.J., Mantel C., Akashi M., and Broxmeyer H.E.. 2002. C-kit associated with the transmembrane 4 superfamily proteins constitutes a functionally distinct subunit in human hematopoietic progenitors. Blood. 99:4413–4421. 10.1182/blood.V99.12.4413 - DOI - PubMed
    1. Baglio S.R., Rooijers K., Koppers-Lalic D., Verweij F.J., Pérez Lanzón M., Zini N., Naaijkens B., Perut F., Niessen H.W., Baldini N., and Pegtel D.M.. 2015. Human bone marrow- and adipose-mesenchymal stem cells secrete exosomes enriched in distinctive miRNA and tRNA species. Stem Cell Res. Ther. 6:127 10.1186/s13287-015-0116-z - DOI - PMC - PubMed
    1. Bruno S., Grange C., Deregibus M.C., Calogero R.A., Saviozzi S., Collino F., Morando L., Busca A., Falda M., Bussolati B., et al. . 2009. Mesenchymal stem cell-derived microvesicles protect against acute tubular injury. J. Am. Soc. Nephrol. 20:1053–1067. 10.1681/ASN.2008070798 - DOI - PMC - PubMed
    1. Charbord P. 2010. Bone marrow mesenchymal stem cells: Historical overview and concepts. Hum. Gene Ther. 21:1045–1056. 10.1089/hum.2010.115 - DOI - PMC - PubMed

MeSH terms