. 2017 Jul 3;114(27):6972-6977.
doi: 10.1073/pnas.1701170114. Epub 2017 Jun 19.

Efficient transport of tropospheric aerosol into the stratosphere via the Asian summer monsoon anticyclone

Affiliations

Efficient transport of tropospheric aerosol into the stratosphere via the Asian summer monsoon anticyclone

Pengfei Yu et al. Proc Natl Acad Sci U S A. .

Abstract

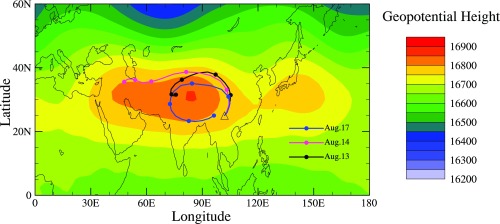
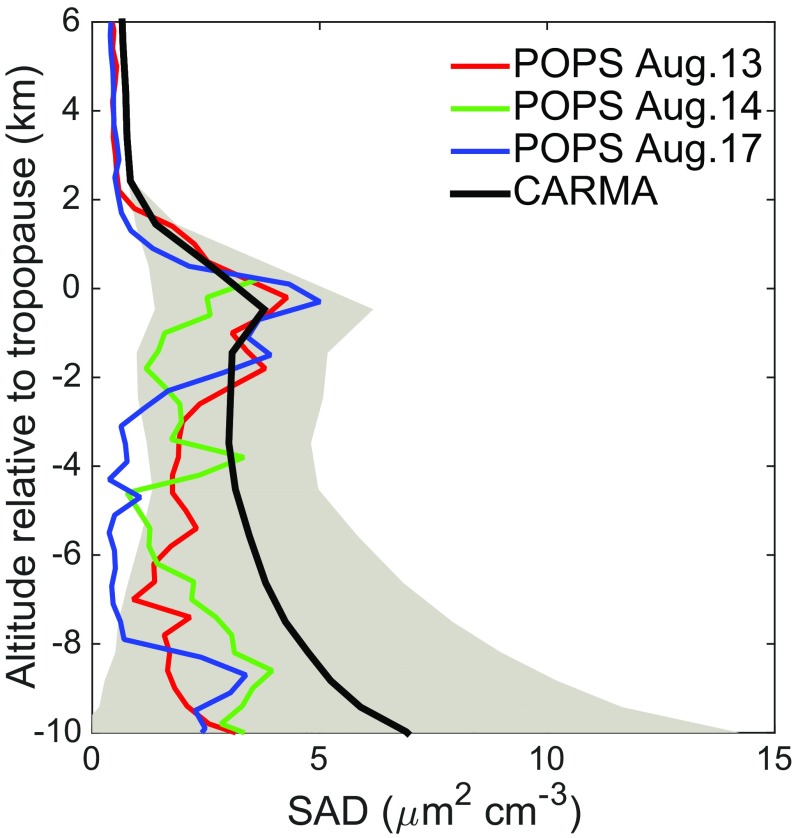
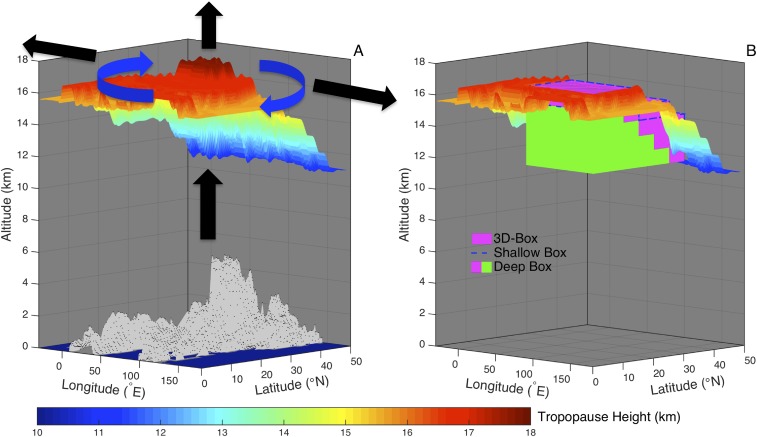
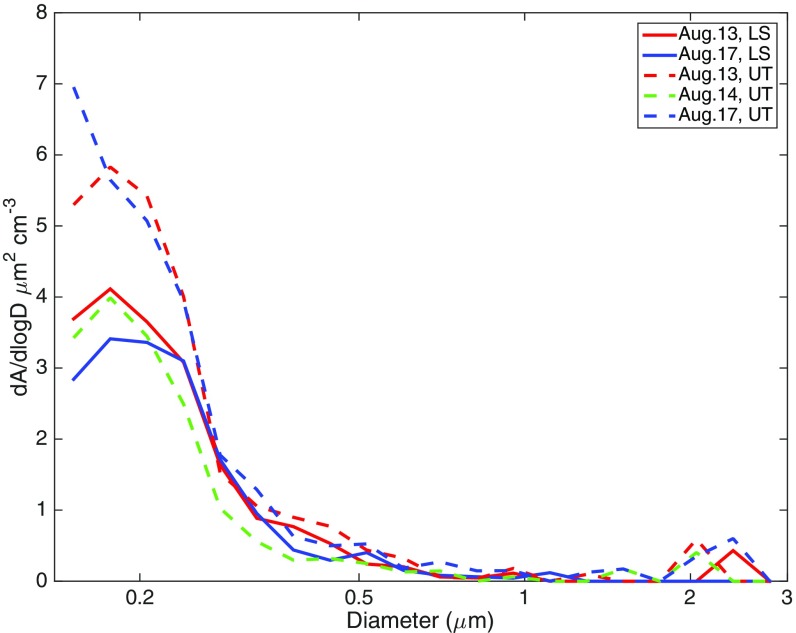
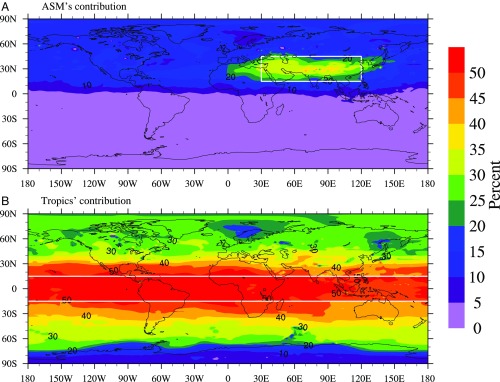
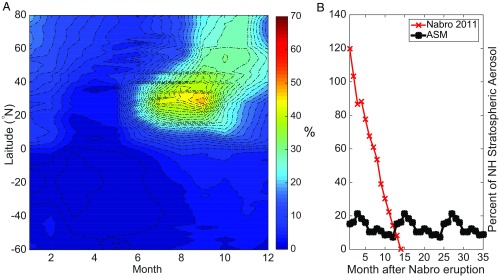
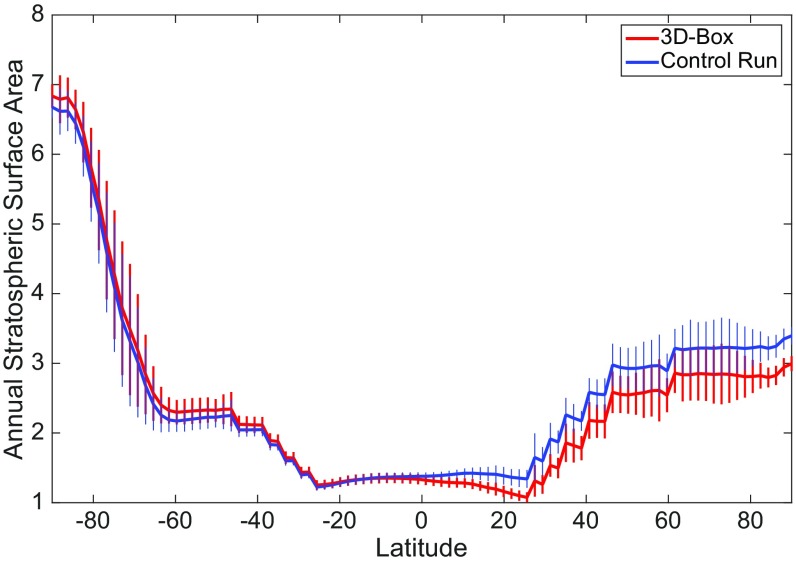
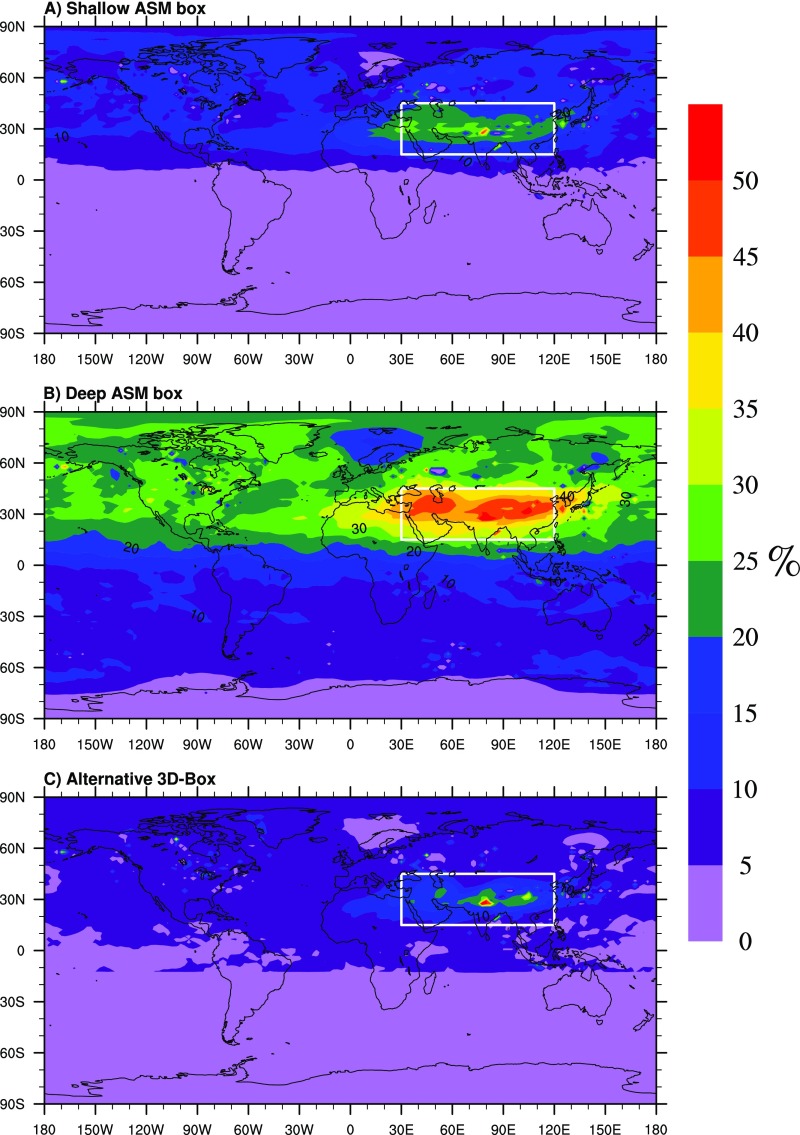
An enhanced aerosol layer near the tropopause over Asia during the June-September period of the Asian summer monsoon (ASM) was recently identified using satellite observations. Its sources and climate impact are presently not well-characterized. To improve understanding of this phenomenon, we made in situ aerosol measurements during summer 2015 from Kunming, China, then followed with a modeling study to assess the global significance. The in situ measurements revealed a robust enhancement in aerosol concentration that extended up to 2 km above the tropopause. A climate model simulation demonstrates that the abundant anthropogenic aerosol precursor emissions from Asia coupled with rapid vertical transport associated with monsoon convection leads to significant particle formation in the upper troposphere within the ASM anticyclone. These particles subsequently spread throughout the entire Northern Hemispheric (NH) lower stratosphere and contribute significantly (∼15%) to the NH stratospheric column aerosol surface area on an annual basis. This contribution is comparable to that from the sum of small volcanic eruptions in the period between 2000 and 2015. Although the ASM contribution is smaller than that from tropical upwelling (∼35%), we find that this region is about three times as efficient per unit area and time in populating the NH stratosphere with aerosol. With a substantial amount of organic and sulfur emissions in Asia, the ASM anticyclone serves as an efficient smokestack venting aerosols to the upper troposphere and lower stratosphere. As economic growth continues in Asia, the relative importance of Asian emissions to stratospheric aerosol is likely to increase.

Keywords: Asian Tropopause Aerosol Layer; Asian summer monsoon; pollution; small volcanoes; stratospheric aerosol.


Conflict of interest statement

The authors declare no conflict of interest.

Figures

Fig. 1.
Fig. 1.
Geopotential height at 100 hPa from the GEOS5 data assimilation, averaged from August 13–21, 2015. The black triangle denotes Kunming, China (25.1°N, 102.7°E). Five-days backward trajectories at 100 hPa over Kunming on August 13, 14, and 17 are shown in colored lines and dots on each trajectory line indicate positions at 1-d intervals. The 5-d trajectory uncertainties are estimated as ±5° latitude and ±11° longitude.
Fig. 2.
Fig. 2.
Aerosol SAD (square micrometers per cubic centimeter) vertical profiles in the UT and LS measured by POPS above Kunming, China (25°N, 102°E) on August 13, 14, and 17, 2015 (red, blue, and green lines) and simulated by CARMA averaged over the anticyclone region (black line). Gray shading denotes the range of spatial–temporal variability in the modeled profiles over the anticyclone region. The vertical coordinate is altitude relative to the tropopause.
Fig. S1.
Fig. S1.
(A) Schematic showing air transport during the ASM. The modeled tropopause (from a June run) is denoted by the colored surface. Black arrows denote vertical and horizontal air transport. Blue arrows denote the anticyclone circulation. The ocean surface is shown in blue and land topography in light gray. The ASM dome is the higher tropopause heights denoted with orange and red colors. (B) Schematic showing the default 3D Box (in magenta), the shallow 3D box (in dashed blue), and the deep 3D box (magenta and green) with the modeled tropopause denoted by the colored surface.
Fig. S2.
Fig. S2.
Aerosol SAD distribution as a function of particle diameter for 1-km layers above and below the tropopause. The high-resolution data required for this plot above the tropopause on August 14 were not available. These curves indicate that the POPS measurements have generally captured over 60% of the aerosol surface area in the accumulation mode.
Fig. 3.
Fig. 3.
(A) Contribution (percent) to the annual mean particle surface area in the stratosphere from aerosol that is transported through the ASM 3D box (15°–45°N, 30°–120°E, June–September). (B) Contribution to the annual mean particle surface area in the stratosphere from aerosol that is transported through the tropics (15°S–15°N, 0°–360°E, entire year). The white box in A shows the spatial extent of the region included in the 3D box where we scrub the aerosol and aerosol precursors.
Fig. 4.
Fig. 4.
(A) Contribution (percent) of the zonal-mean column SAD of stratospheric aerosol that was produced in or transported through the 3D box (15°–45°N, 30°–120°E, June to September). (B) Percentage of background NH stratospheric aerosol column surface area due to the Nabro 2011 eruption (in red) and ASM (in black).
Fig. S3.
Fig. S3.
Zonal mean annual column SAD (square micrometers per square centimeter) of stratospheric aerosols from two simulations. The control run is shown by the blue line, and the 3D-box run is shown by the red line. Error bars denote data variability (1 SD).
Fig. S4.
Fig. S4.
(A) Contribution (percent) to the annual mean particle surface area in the stratosphere from aerosol that is transported through the shallow Asian 3D box (15°–45°N, 30°–120°E, June–September). (B) Same as A but for the deep 3D box run. (C) Same as A but for the alternative 3D-box method for estimating the lower limit discussed in Results and Discussion.
Fig. S5.
Fig. S5.
(A) Modeled net heating rates for July 2015 within the inner ASM (25°–40°N, 70°–110°E; in red) and in the adjacent region outside of the ASM (25°–40°N, 150°–210°E; in blue). Error bars include several sources of uncertainties: radiative transfer model differences (∼0.1 K/d, estimated from ref. 27) and ozone and water vapor variations (assuming 20% uncertainties in the abundances). (B) Clear-sky net heating rate during July at a grid box within the ASM (29°N, 77°E) anticyclone simulated by CESM (dashed blue line) and the Fu-Liou (solid red line; see ref. 28) radiative transfer models.

References

    1. Solomon S, et al. The persistently variable “background” stratospheric aerosol layer and global climate change. Science. 2011;333:866–870. - PubMed
    1. Neely RR, et al. Recent anthropogenic increases in SO2 from Asia have minimal impact on stratospheric aerosol. Geophys Res Lett. 2013;40:999–1004.
    1. Yu P, et al. Radiative forcing from anthropogenic sulfur and organic emissions reaching the stratosphere. Geophys Res Lett. 2016;43:9361–9367.
    1. Brock CA, Hamill P, Wilson JC, Jonsson HH, Chan KR. Particle formation in the upper tropical troposphere: A source for the stratospheric aerosol. Science. 1995;270:1650–1653.
    1. Pan LL, et al. Transport of chemical tracers from the boundary layer to stratosphere associated with the dynamics of the Asian summer monsoon. J Geophys Res Atmos. 2016;121:14159–14174.

Publication types

LinkOut - more resources