. 2017 Jul 3;114(27):E5362-E5369.
doi: 10.1073/pnas.1702983114. Epub 2017 Jun 19.

Bacteria-mediated hypoxia functions as a signal for mosquito development

Affiliations

Bacteria-mediated hypoxia functions as a signal for mosquito development

Kerri L Coon et al. Proc Natl Acad Sci U S A. .

Abstract

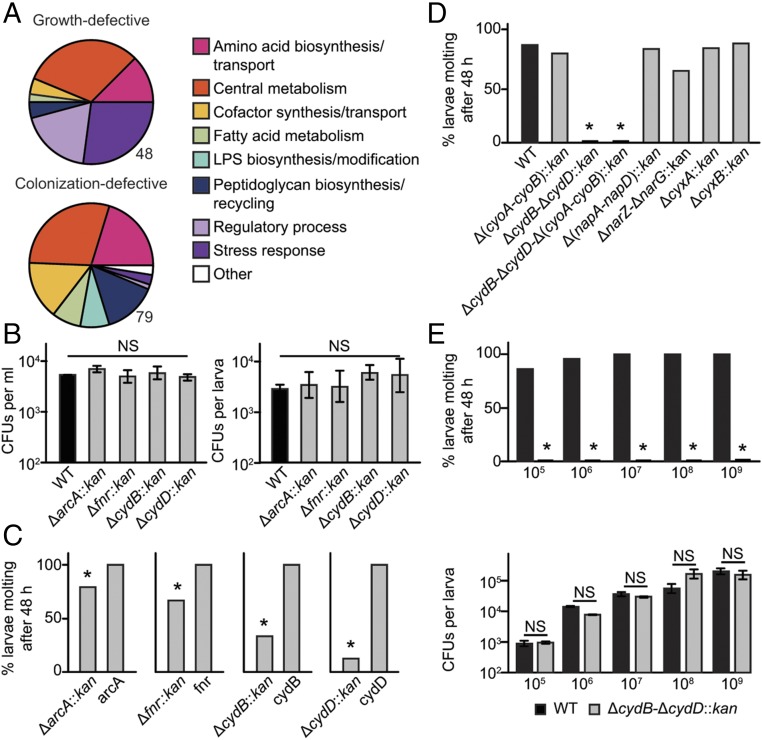
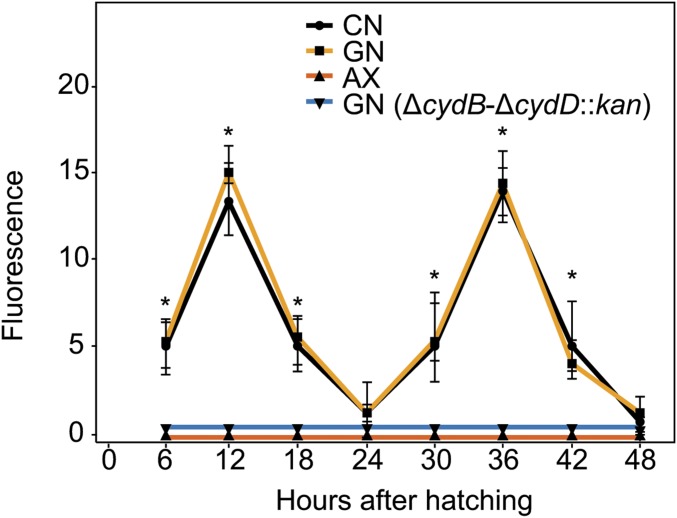
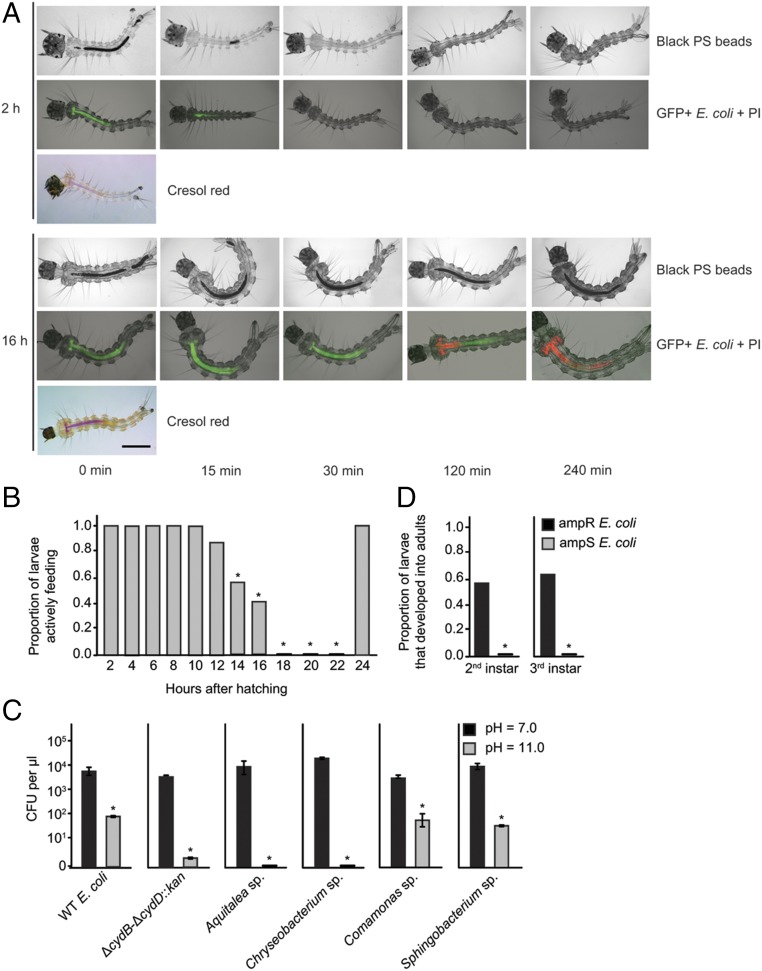
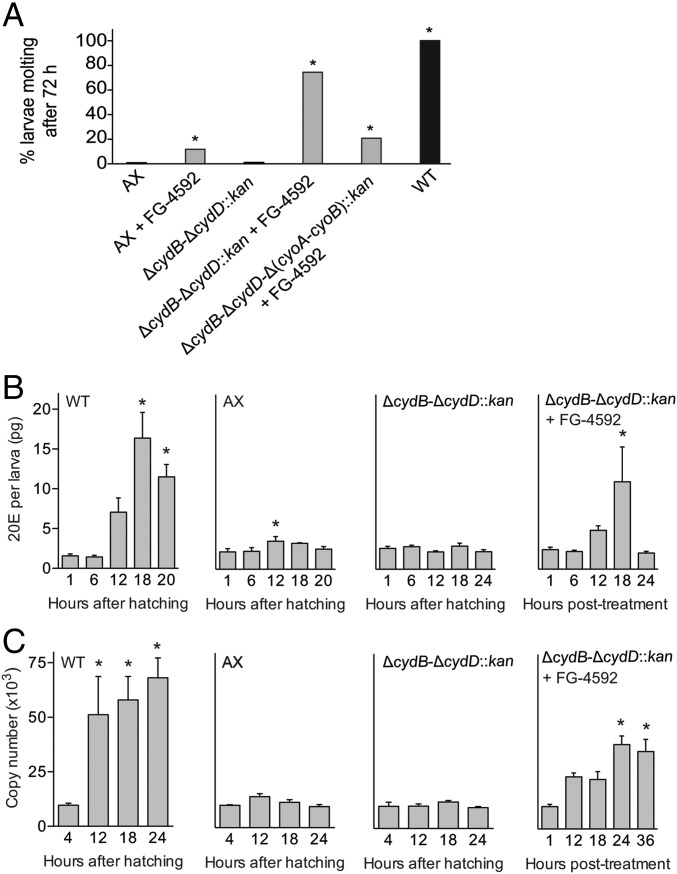
Mosquitoes host communities of microbes in their digestive tract that consist primarily of bacteria. We previously reported that several mosquito species, including Aedes aegypti, do not develop beyond the first instar when fed a nutritionally complete diet in the absence of a gut microbiota. In contrast, several species of bacteria, including Escherichia coli, rescue development of axenic larvae into adults. The molecular mechanisms underlying bacteria-dependent growth are unknown. Here, we designed a genetic screen around E. coli that identified high-affinity cytochrome bd oxidase as an essential bacterial gene product for mosquito growth. Bioassays showed that bacteria in nonsterile larvae and gnotobiotic larvae inoculated with wild-type E. coli reduced midgut oxygen levels below 5%, whereas larvae inoculated with E. coli mutants defective for cytochrome bd oxidase did not. Experiments further supported that hypoxia leads to growth and ecdysone-induced molting. Altogether, our results identify aerobic respiration by bacteria as a previously unknown but essential process for mosquito development.

Keywords: bacteria; growth; hypoxia; insect; microbiota.


Conflict of interest statement

The authors declare no conflict of interest.

Figures

Fig. 1.
Fig. 1.
Multiple E. coli mutants affect growth and molting of Ae. aegypti larvae. (A) Functional clustering of the 48 growth-defective and 79 colonization-defective single-gene deletion mutants. Pie charts show the gene ontology (GO) categories to which deleted genes in the mutants belonged. Genes that fell into multiple GO categories are grouped together in the category designated as “Other.” (B) Abundance of the four rescue-defective mutants and wild-type (WT) E. coli in cultures (Left) and larvae (Right) at 24 h postinoculation. A minimum of four replicates were assayed per treatment. Each bar indicates mean ± SE colony-forming units. ANOVA detected no differences between treatments for either water (F4,14 = 1.385, P = 0.289) or larvae (F4,14 = 1.536, P = 0.245). (C) Percentage of first instars that molted when inoculated with each rescue-defective mutant vs. the same mutant transformed with an expression plasmid containing the deleted gene. An asterisk (*) indicates molting significantly differed between the two treatments, with all rescued mutants stimulating 100% of larvae to molt (P < 0.05, Fisher’s exact test). At least 24 larvae were assayed per treatment. (D) Percentage of first-instar larvae molting to the second instar when inoculated with WT E. coli or the mutants Δ(cyoA-cyoB)::kan, ΔcydB-ΔcydD::kan, ΔcydB-ΔcydD-Δ(cyoA-cyoB)::kan, Δ(napA-napD)::kan, ΔnarZ-ΔnarG::kan, ΔcyxA::kan, and ΔcyxB::kan. An asterisk (*) indicates a significant difference for a given mutant relative to the WT positive control (P < 0.0001, Fisher’s exact test). At least 72 larvae were assayed per treatment. (E, Upper) Percentage of first instars molting to the second instar when cultures were inoculated with 105–109 cfu of WT vs. ΔcydB-ΔcydD::kan E. coli. An asterisk (*) indicates a significant difference between treatments (P < 0.0001, Fisher’s exact test). At least 72 larvae were assayed per treatment. (E, Lower) Mean ± SE colony-forming units present per larva at 24 h postinoculation for the cultures shown above. For each inoculation amount, t tests detected no significant difference (NS) in colony-forming units per larva between treatments (P > 0.05). A minimum of four individuals were assayed per treatment.
Fig. 2.
Fig. 2.
Quantitation of Image iT fluorescence in the midguts of conventional larvae (CN), gnotobiotic larvae inoculated with WT E. coli (GN), axenic larvae (AX), and gnotobiotic larvae inoculated with ΔcydB-ΔcydD::kan E. coli [GN (ΔcydB-ΔcydD::kan)]. Individual larvae for each treatment were examined by confocal microscopy from 6 to 48 h posthatching. Fluorescence intensity in the midgut was measured in 10 larvae per treatment and time point using the Pixel Intensity plug-in from ImageJ software (NIH). Mean pixel intensity values ± SD are presented. An asterisk (*) at a given time point indicates that the pixel intensity significantly differed for the CN and GN treatments relative to the AX and GN (ΔcydB-ΔcydD::kan) treatments (ANOVA followed by a post hoc Tukey–Kramer honest significant difference test, P < 0.05). Corresponding confocal images are shown in SI Appendix, Figs. S2 and S3.
Fig. 3.
Fig. 3.
Pre- and postcritical size larvae exhibit differences in food excretion and viability of gut bacteria. (A) Images show 2-h posthatching (precritical size) or 16-h posthatching (postcritical size) first instars that were monitored over a 240-min observation period. The head of each larva is oriented to the left (anterior). (Upper) Black polystyrene (PS) beads in the midgut (Mg) and hindgut (Hg) over the 240-min observation period. The Mg and Hg are filled with beads at 0 min in 2-h and 16-h larvae. All beads have been excreted by 30 min in 2-h larvae, whereas most beads remain present after 240 min in 16-h larvae. (Middle) E. coli expressing GFP+ and PI staining of bacteria. The Mg is filled with GFP+ bacteria (green) at 0 min in 2-h and 16-h larvae. No PI staining (red) is visible, indicating bacteria are viable. All bacteria have been excreted by 30 min in 2-h larvae, whereas bacteria remain present after 240 min in 16-h larvae. Bacteria in the anterior Mg are stained by PI at 120 min, whereas bacteria in both the anterior and posterior Mg are stained at 240 min. (Lower) Two-hour and 16-h larvae at 0 min after ingestion of the pH indicator cresol red. The magenta color in the anterior Mg extending to the posterior Mg indicates a strongly alkaline pH (>10). (Scale bar, 200 μm.) (B) Proportion of larvae from 2 to 24 h posthatching that excreted all PS beads and bacteria within 30 min. An asterisk (*) indicates time points when the proportion of larvae that have excreted beads in 30 min was significantly lower than the 2-h time point (P < 0.0001, Fisher’s exact test). At least 29 larvae were assayed per time point. (C) Sensitivity of WT E. coli, ΔcydB-ΔcydD::kan E. coli, and four abundant bacterial species present in conventionally reared larvae (Aquitalea sp., Chryseobacterium sp., Comamonas sp., and Sphingobacterium sp.) to culture at pH 7 vs. pH 11. Bacteria were incubated for 2 h in neutral or alkaline LB K medium and then plated on neutral LB agar to determine the number of colony-forming units per microliter. For each species, an asterisk (*) indicates a significant difference between treatments (t test, P < 0.01). Three replicate cultures were tested per species and pH treatment. (D) Proportion of larvae that molted and successfully developed into adults when inoculated with ampicillin-susceptible (ampS) or ampicillin-resistant (ampR) WT E. coli and subsequently treated with ampicillin. Larvae were treated with the antibiotic immediately after molting to the second or third instar. An asterisk (*) indicates a significant difference between treatments (P < 0.0001, Fisher’s exact test). At least 60 larvae were assayed per instar and treatment.
Fig. 4.
Fig. 4.
FG-4592 stimulates molting of gnotobiotic larvae inoculated with ΔcydB-ΔcydD::kan E. coli. (A) Percentage of axenic (AX) and gnotobiotic larvae inoculated with ΔcydB-ΔcydD::kan, ΔcydB-ΔcydD-Δ(cyoA-cyoB)::kan, or wild-type (WT) E. coli that molted to the second instar in the presence and absence of FG-4592. At least 40 larvae were assayed per treatment. An asterisk (*) indicates a given treatment significantly differed from untreated AX larvae (negative control) (P < 0.01, Fisher’s exact test). (B) Mean 20E titers (±SE) in gnotobiotic first instars inoculated with WT E. coli (WT), axenic first instars (AX), gnotobiotic first instars inoculated with ΔcydB-ΔcydD::kan E. colicydB-ΔcydD::kan), and gnotobiotic first instars inoculated with ΔcydB-ΔcydD::kan E. coli treated with FG-4592 (ΔcydB-ΔcydD::kan + FG-4592). Titers were measured from 1 to 24 h posthatching for the WT, AX, and ΔcydB-ΔcydD::kan treatments. FG-4592 treatment began at 12 h posthatching, with titers measured from 1 to 24 h after treatment began. For each treatment, an asterisk (*) indicates the time point significantly differed from the 1-h time point (P < 0.05, ANOVA followed by a post hoc Dunnett’s test). A minimum of four larvae were analyzed per treatment and time point. Methods used for titer determination are discussed in SI Appendix, Supplemental Experimental Procedures. (C) Transcript abundance of the Ae. aegypti E74B gene in the WT, AX, ΔcydB-ΔcydD::kan, and ΔcydB-ΔcydD::kan + FG-4592 treatments. Larvae were collected from 4 to 24 h posthatching or 4–36 h posttreatment with FG-4592, followed by extraction of total RNA and RT-quantitative PCR analysis (SI Appendix, Supplemental Experimental Procedures). The bars in each graph show the copy number of each gene (±SE) per 500 ng of total RNA. For each treatment, an asterisk (*) indicates the time point significantly differed from the 4-h time point (P < 0.05, ANOVA followed by a post hoc Dunnett’s test). A minimum of four independent biological replicates were analyzed per treatment and time point.

References

    1. Engel P, Moran NA. The gut microbiota of insects–Diversity in structure and function. FEMS Microbiol Rev. 2013;37:699–735. - PubMed
    1. Sommer F, Bäckhed F. The gut microbiota–Masters of host development and physiology. Nat Rev Microbiol. 2013;11:227–238. - PubMed
    1. Merritt RW, Dadd RH, Walker ED. Feeding behavior, natural food, and nutritional relationships of larval mosquitoes. Annu Rev Entomol. 1992;37:349–376. - PubMed
    1. Clements AN. The Biology of Mosquitoes, Development, Nutrition, and Reproduction. Vol 1 Chapman & Hall; New York: 1992.
    1. Minard G, Mavingui P, Moro CV. Diversity and function of bacterial microbiota in the mosquito holobiont. Parasit Vectors. 2013;6:146. - PMC - PubMed

Publication types

MeSH terms

LinkOut - more resources