. 2017 Jul 3;114(27):6930-6935.
doi: 10.1073/pnas.1700197114. Epub 2017 Jun 19.

Heat exchange between a bouncing drop and a superhydrophobic substrate

Affiliations

Heat exchange between a bouncing drop and a superhydrophobic substrate

Samira Shiri et al. Proc Natl Acad Sci U S A. .

Abstract

The ability to enhance or limit heat transfer between a surface and impacting drops is important in applications ranging from industrial spray cooling to the thermal regulation of animals in cold rain. When these surfaces are micro/nanotextured and hydrophobic, or superhydrophobic, an impacting drop can spread and recoil over trapped air pockets so quickly that it can completely bounce off the surface. It is expected that this short contact time limits heat transfer; however, the amount of heat exchanged and precise role of various parameters, such as the drop size, are unknown. Here, we demonstrate that the amount of heat exchanged between a millimeter-sized water drop and a superhydrophobic surface will be orders of magnitude less when the drop bounces than when it sticks. Through a combination of experiments and theory, we show that the heat transfer process on superhydrophobic surfaces is independent of the trapped gas. Instead, we find that, for a given spreading factor, the small fraction of heat transferred is controlled by two dimensionless groupings of physical parameters: one that relates the thermal properties of the drop and bulk substrate and the other that characterizes the relative thermal, inertial, and capillary dynamics of the drop.

Keywords: droplets; feathers; heat transfer; microtexture; wetting.


Conflict of interest statement

The authors declare no conflict of interest.

Figures
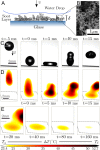
Fig. 1.
Fig. 1.
The finite-time heat exchange between a drop and a superhydrophobic substrate. (A) A water drop impacts a glass substrate coated with a thin layer δ30μm of soot. (B) A scanning electron microscope image of the soot layer reveals the submicrometer roughness responsible for the substrate superhydrophobicity. (C) High-speed images show that the water drop bounces, residing on the surface for a finite time tr=11.8ms. Here the drop radius is R=1.2mm and the impact velocity is U=0.74ms1. (D) Simultaneous thermographic images, from an orthogonal perspective, show a temperature map of the drop surface and substrate during impact. (E) The drop leaves a thermal footprint on the substrate that decays over time. Note that the spatial information from the thermal camera suffers from motion blur due to the 8-ms time response in the uncooled sensor. This exposure time is too long to accurately resolve details during the impact, but is short enough to characterize the thermal footprint left from the drop.
Fig. S1.
Fig. S1.
A composite image illustrating a soot layer coating on a glass slide obtained with an optical microscope. Here the average thickness of the soot layer is δ=28μm with a root-mean-square roughness of 2μm.
Fig. 2.
Fig. 2.
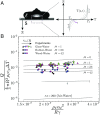
Extraction of the maximum contact radius rm and transferred heat Q for the drop illustrated in Fig. 1. (A) Plot of the contact radius r(t) normalized by drop radius R. (B) Average temperature of the drop footprint T¯ on the substrate surface (z=0) over time t. The transferred heat Q is calculated by fitting a one-dimensional, semiinfinite heat exchange model (dotted line) as the surface returns to its ambient temperature Ts. Here ks and αs are the substrate thermal conductivity and diffusivity, respectively.
Fig. S2.
Fig. S2.
The footprint temperature as a function of radial position r and time t for the drop illustrated in Fig. 1 of the main text. The spatial average of the temperature T¯(z= 0,t) for each time is depicted in Fig. 2 of the main text.
Fig. 3.
Fig. 3.
Measurements of heat transferred by drops. (A) The exchanged heat Q varies with the drop size R; the temperature difference ΔT between the drop and substrate (symbol orientation); and the extent of spreading, or spreading factor, rm/R (symbol color). The black arrows illustrate drops bouncing off of the substrate, leaving behind either a warm or cool footprint. (B) The data collapse into single curves for fixed rm/R when the transferred heat Q is normalized by the initial temperature difference ΔT, showing a power-law dependence on the drop radius R. Note that the larger triangle corresponds to the specific drop illustrated in Fig. 2.
Fig. 4.
Fig. 4.
Comparison between model and experiment. (A) The model assumes that during the residence time tr, the temperatures of the drop T and solid Ts contact along a plane z=0 and the heat transfer leads to self-similar temperature profiles T(z,t). (B) For a given spreading factor rm/R (symbol color), the portion of energy exchanged depends on two dimensionless groups, one based on dynamic properties ρα2/Rγ and the other on material thermal properties M (symbol shape). The experimental data (symbols) are consistent with the theoretical results with rm/R=1.4 (solid lines).
Fig. 5.
Fig. 5.
Cooling from different-sized drops impacting at ambient temperature onto a warmed feather. (A) A photograph of a gray duck pennaceous feather used in the experiments. (B) A scanning electron microscope image reveals the interlocking barb and barbule microtexture that is responsible for the natural superhydrophobicity of the feather. (C) High-speed images show the two different-sized streams of water drops at identical flow rates bounce off of the top surface of the feather. (D) A heat map illustrates the temperature underneath the warmed feather averaged over a 100-s period. During this period, the two streams of ambient-temperature water drops that bounce on the top side of the feather lead, on the bottom side, to local cooling. The circles denote the location of the stream of large drops (left), the stream of small drops (right), and a midpoint in which there are no drops (center). (E) The temperature within each of these circled regions is plotted for 10 s before the start of the experiment, as well as 2 min during which the drops steadily drip on the top side of the feather. Insets highlight the periodicity of the temperature response on the side of the feather opposite to where the drops impact. Here the time between each falling water drop is 2 s for the large drops and 0.3 s for the small drops.
Fig. S3.
Fig. S3.
Heat transfer by cold water drops impacting a feather. (A) A water drop beads up on the feather, illustrating natural superhydrophobicity. (B) Air plasma irradiation of the feather changes it from being superhydrophobic to superhydrophilic. Here reflections barely can be seen on the surface of a water drop that has completely spread over the now superhydrophilic feather. (C) The temperature throughout a 3-min period measured under a superhydrophobic feather and superhydrophilic feather both subjected to a stream of cold (13C) water drops. Here the time between each falling water drop is 0.6s.
Fig. S4.
Fig. S4.
Experimental setup to measure the aggregate cooling of different-sized drops dripping on a heated feather. This experimental setup includes (1) suspended feather with clamp, (2) two dispensing needles (different gauges) connected to syringes filled with water, (3) double syringe pump, (4) high-speed camera, (5) heat gun, and (6) thermal camera. Here the experiment is conducted outdoors so that the drops are at the ambient temperature of T= 3.9C. The same setup was used inside the laboratory to collect the measurements illustrated in Fig. 5 of the main text.
Fig. S5.
Fig. S5.
Cooling from different-sized ambient-temperature drops onto a warmed feather conducted outdoors at a chilly ambient temperature of Tatm=3.9C. (A) A heat map shows the temperature underneath the warmed feather averaged over a 6-s period. During this period, the two streams of water drops that bounce on the top side of the feather lead to local cooling. The locations of the stream of large drops (left), the stream of small drops (right), and a midpoint in which there are no drops (center) are shown. (B) The temperature within each of these locations is plotted for the 30 s before the drops begin falling through the steady dripping that lasts for over 30 s and for a few seconds after the dripping stopped. The mild wind in the outdoor environment likely contributed to some of the larger temperature fluctuations.

References

    1. Leon Bolle JCM. Spray cooling of hot surfaces. Multiphas Sci Tech. 1982;1:1–97.
    1. Kim J. Spray cooling heat transfer: The state of the art. Int J Heat Fluid Flow. 2007;28:753–767.
    1. Deng W, Gomez A. Electrospray cooling for microelectronics. Int J Heat Mass Tran. 2011;54:2270–2275.
    1. Pikkula BM, Torres JH, Tunnell JW, Anvari B. Cryogen spray cooling: Effects of droplet size and spray density on heat removal. Laser Surg Med. 2001;28:103–112. - PubMed
    1. Thomas SK, Cassoni RP, MacArthur CD. Aircraft anti-icing and de-icing techniques and modeling. J Aircraft. 1996;33:841–854.

Publication types

LinkOut - more resources