. 2017 Jul 3;114(27):E5444-E5453.
doi: 10.1073/pnas.1704099114. Epub 2017 Jun 19.

Virus-induced inflammasome activation is suppressed by prostaglandin D2/DP1 signaling

Affiliations

Virus-induced inflammasome activation is suppressed by prostaglandin D2/DP1 signaling

Rahul Vijay et al. Proc Natl Acad Sci U S A. .

Abstract

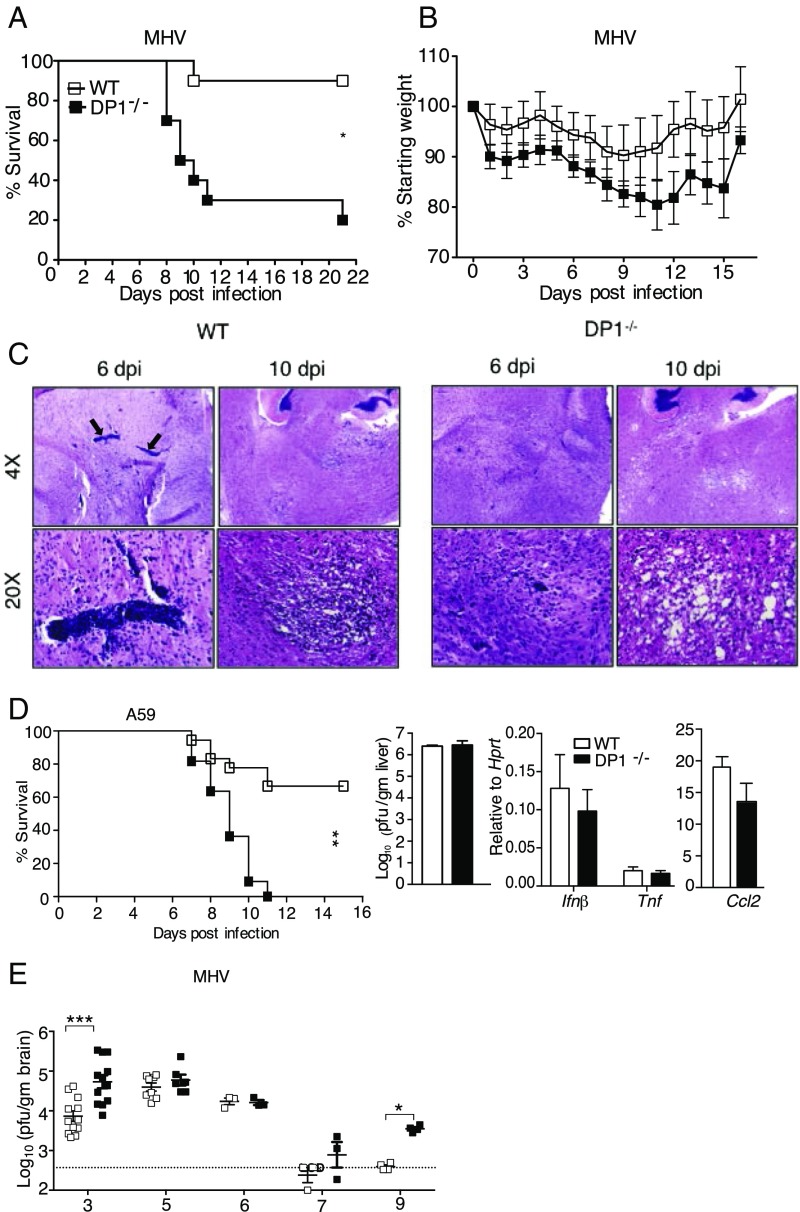
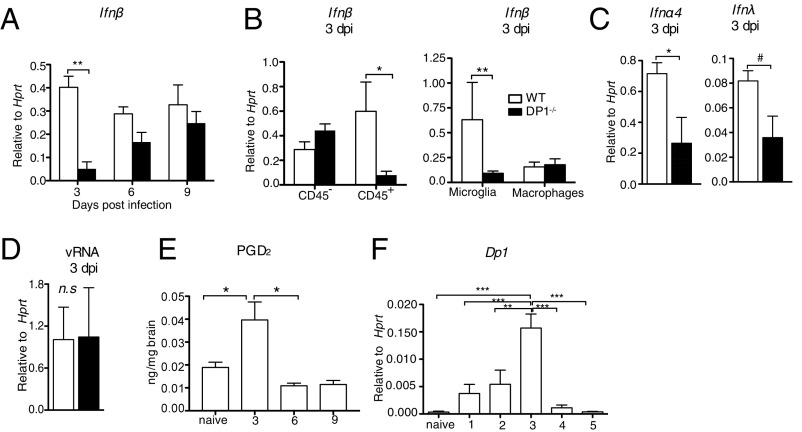
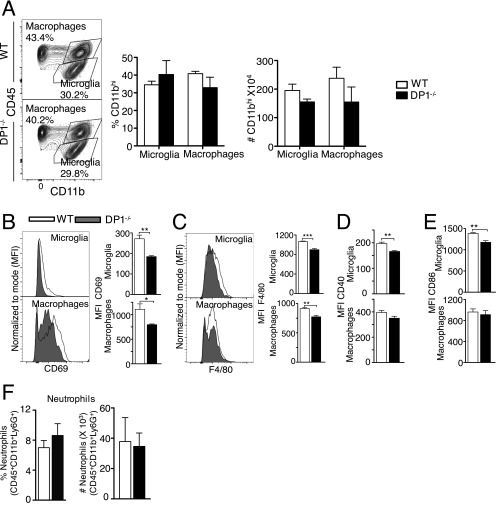
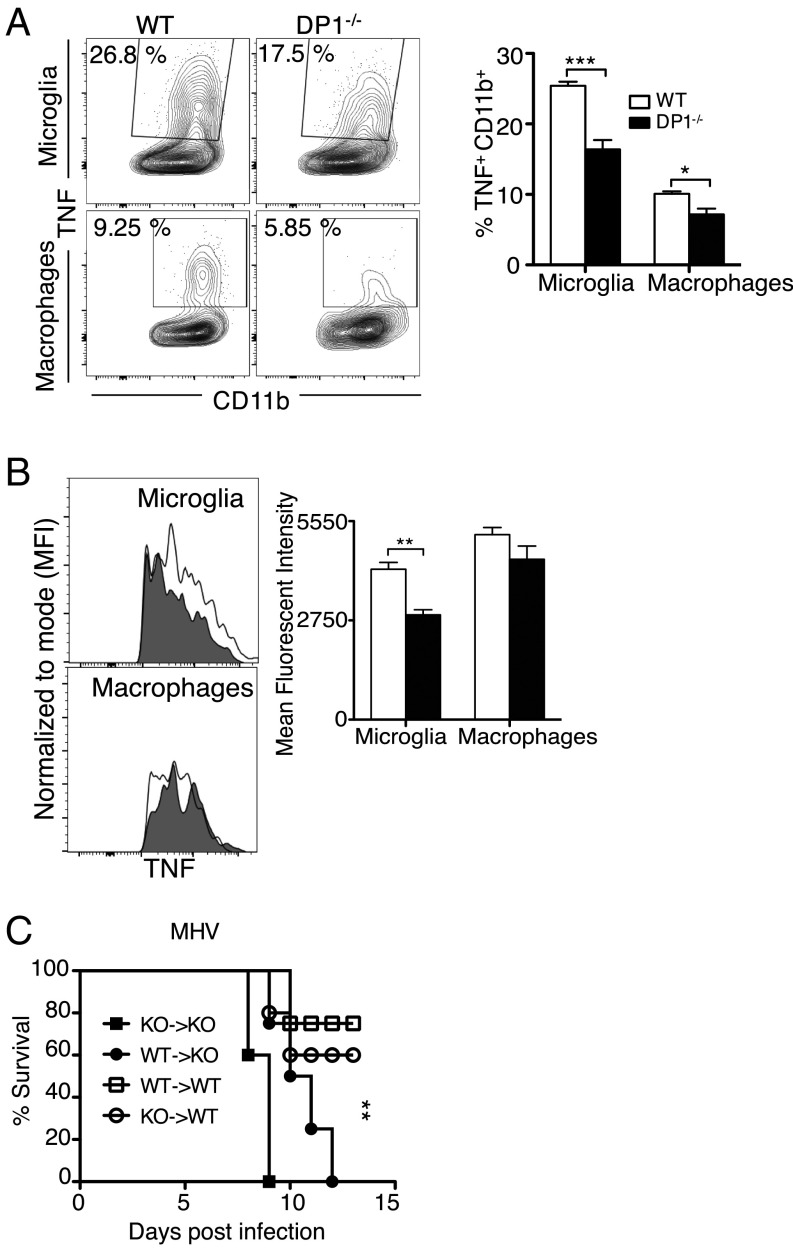
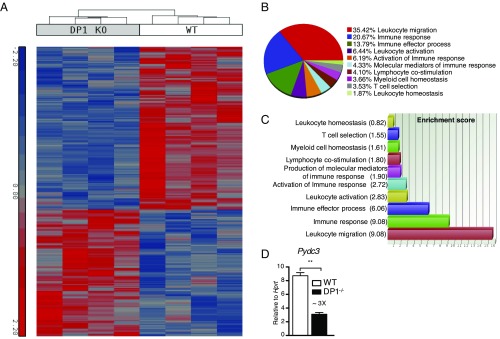
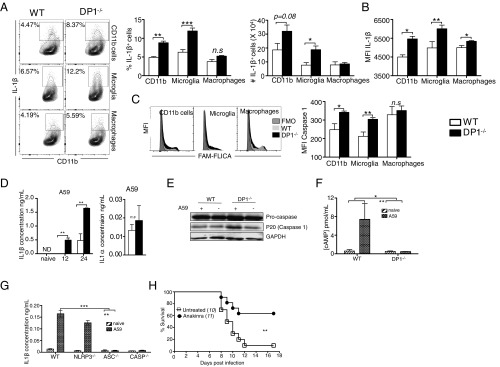
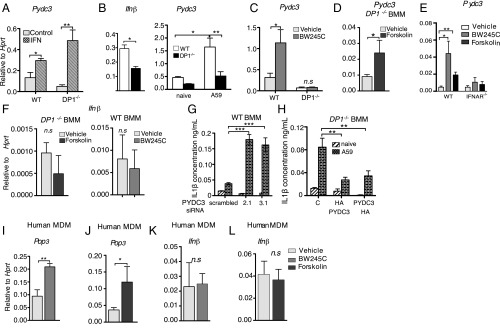
Prostaglandin D2 (PGD2), an eicosanoid with both pro- and anti-inflammatory properties, is the most abundantly expressed prostaglandin in the brain. Here we show that PGD2 signaling through the D-prostanoid receptor 1 (DP1) receptor is necessary for optimal microglia/macrophage activation and IFN expression after infection with a neurotropic coronavirus. Genome-wide expression analyses indicated that PGD2/DP1 signaling is required for up-regulation of a putative inflammasome inhibitor, PYDC3, in CD11b+ cells in the CNS of infected mice. Our results also demonstrated that, in addition to PGD2/DP1 signaling, type 1 IFN (IFN-I) signaling is required for PYDC3 expression. In the absence of Pydc3 up-regulation, IL-1β expression and, subsequently, mortality were increased in infected DP1-/- mice. Notably, survival was enhanced by IL1 receptor blockade, indicating that the effects of the absence of DP1 signaling on clinical outcomes were mediated, at least in part, by inflammasomes. Using bone marrow-derived macrophages in vitro, we confirmed that PYDC3 expression is dependent upon DP1 signaling and that IFN priming is critical for PYDC3 up-regulation. In addition, Pydc3 silencing or overexpression augmented or diminished IL-1β secretion, respectively. Furthermore, DP1 signaling in human macrophages also resulted in the up-regulation of a putative functional analog, POP3, suggesting that PGD2 similarly modulates inflammasomes in human cells. These findings demonstrate a previously undescribed role for prostaglandin signaling in preventing excessive inflammasome activation and, together with previously published results, suggest that eicosanoids and inflammasomes are reciprocally regulated.

Keywords: coronavirus; encephalitis; inflammasomes; prostaglandin D2; pyrin domain-only protein.


Conflict of interest statement

The authors declare no conflict of interest.

Figures

Fig. 1.
Fig. 1.
Increased morbidity and mortality in infected DP1−/− mice. Six- to seven-week-old B6 or DP1−/− mice were infected i.c. with 700 pfu of MHV (AD) or with 3,000 pfu of A59 (E). Mice were monitored daily for survival (A) and weight loss (B) after MHV infection. Data are representative of three independent experiments; n = 6 or 7 mice per group. *P < 0.05, Kaplan–Meier log-rank survival test and Student’s t test. (C) Sections from WT and DP1−/− brains harvested at 6 and 10 dpi. Arrows indicate large perivascular infiltrates observed at 6 dpi in infected WT but not in DP1−/− mice. Data are representative of six to eight mice per group at 5 or 6 dpi and three or four mice per group at 8–10 dpi. (D, Left) Mice were infected with MHV-A59 and were monitored for survival. Data are representative of two independent experiments; n = 9 or 10 mice per group. **P < 0.01, Kaplan–Meier log-rank survival test. Virus titers (Center) and cytokine mRNAs (Right) were measured at 5 dpi. Data represent the mean ± SEM of two independent experiments; n = 4 mice per group. (E) Viral titers in the brains of MHV-infected B6 or DP1−/− mice at indicated time points. Data represent the mean ± SEM of two independent experiments; n = 4–10 mice per group. *P < 0.05, ***P < 0.001, Mann–Whitney U test.
Fig. S1.
Fig. S1.
CD4 and CD8 T-cell response in MHV-infected brains of WT and DP1−/− mice. Brains from MHV-infected WT or DP1−/− mice were harvested at 8 dpi for quantifying T-cell responses. (A) Brain cells were incubated with M133 peptide in the presence of Brefeldin A for 6 h and were assayed for IFN and TNF using flow cytometric analysis. The frequency and number of IFN + cells (Left and Center) and the frequency of TNF+IFN + cells (Right) (as a measure of polyfunctionality) are shown. (B) The frequency (Left) and total number (Right) of FoxP3+ CD4 T cells are shown. (C) The frequency (Left) and total number (Right) of virus-specific CD8 T cells, determined using MHC class I/peptide S510 tetramers are shown. Data represent the mean ± SEM of two independent experiments; n = 4 mice per group; *P < 0.05; **P < 0.01; ***P < 0.001, Mann–Whitney U test; n.s., not significant.
Fig. 2.
Fig. 2.
Blunted IFN-I response in DP1−/− mice. WT or DP1−/− mice were infected i.c. with MHV, and brains were harvested at the indicated time points post infection for qRT-PCR (AD and F) and lipid analysis (E). (A and B) Ifnβ mRNA expression on days 3, 6, and 9 post infection in total brain (A) and in CD45 and CD45+ cells (B, Left) and microglia (CD45intCD11b+) and macrophages (CD45hiCD11b+) (B, Right) in WT and DP1−/− mice at 3 dpi. (C) Ifnα4 (Left) and Ifnλ (Right) mRNA expression in microglia of WT and DP1−/− mice. (D) MHV RNA levels in microglia and macrophages (CD11b+ cells) in the brain at 3 dpi. (E) PGD2 levels in the brains of WT mice measured using LC/MS analysis. (F) Dp1 mRNA levels in CD11b+ cells. Data represent the mean ± SEM of two or three independent experiments; n = 4 mice per group; *P < 0.05; #P = 0.053; **P < 0.01; ***P < 0.001, Mann–Whitney U test; n.s., not significant.
Fig. S2.
Fig. S2.
Myeloid cell response in brains of WT and DP1−/− mice. Cells were harvested from the brains of MHV-infected WT or DP1−/− mice on dpi 3. (A) The frequency and number of microglia and macrophages. (BE) The activation status of microglia and macrophages is shown as the MFI (mean fluorescence intensity) of CD69 (B), F4/80 (C), CD40 (D), and CD86 (E). (F) The frequency and number of neutrophils. Data represent the mean ± SEM of two independent experiments; n = 4 mice per group; *P < 0.05; **P < 0.01; ***P < 0.001, Mann–Whitney U test.
Fig. 3.
Fig. 3.
Decreased microglia and macrophage activation and function in DP1−/− mice. (A and B) Cells were harvested from the brains of MHV-infected WT or DP1−/− mice on d 3. Functionality of microglia and macrophages are depicted as frequency (A) and mean fluorescence intensity (MFI) (B) of TNF+ cells. Data represent the mean ± SEM of two independent experiments; n = 4 mice per group, *P < 0.05; **P < 0.01; ***P < 0.001, Mann–Whitney U test. (C) WT and DP1−/− reciprocal bone marrow chimeras were infected with 100 pfu of MHV and monitored for survival. Data represent the mean ± SEM of two independent experiments; n = 7 or 8 mice per group; **P < 0.01, Kaplan–Meier log-rank survival test.
Fig. 4.
Fig. 4.
Microarray analyses of CD11b cells at 3 dpi. DP1−/− or WT mice were infected with MHV, and at 3 dpi CD11b+ cells from the brain were sorted using magnetic beads for microarray analysis. (A) The heat map shows the 629 genes that were differentially regulated between the two groups at a fold-change cut-off of 2 and P < 0.05. (B) The pie-chart shows the percentage of differentially expressed genes with various immune-related functions. (C) The bar graph shows the enrichment score of immune-related genes that were differentially expressed. (D) Brain-derived CD11b+ cells were sorted from MHV-infected WT and DP1−/− mice at 3 dpi and were analyzed for Pydc3 mRNA levels; **P < 0.01.
Fig. 5.
Fig. 5.
Increased inflammasome activity in the absence of DP1 signaling. Brain-derived cells from MHV-infected WT or DP1−/− mice (AC) or BMMs infected with A59 in vitro (DG) were analyzed for IL1β (A, B, D, and G), caspase-1 (C and E), or cAMP (F). (A and B) Frequency, number, and MFI (mean fluorescence intensity) of IL-1β–producing total CD11b cells, microglia, and macrophages. (C) MFI of activated caspase-1 as shown by FAM-FLICA staining. Data represent the mean ± SEM of two independent experiments; n = 4 mice per group; *P < 0.05; **P < 0.01; ***P < 0.001, Mann–Whitney U test; n.s., not significant. FMO, fluorescent minus one (control). (D) Cell supernatants were assayed by ELISA for IL-1β at the indicated time points or IL-1α at 24 hpi. Data represent the mean ± SEM of two independent experiments; n = 4 samples per group; **P < 0.01, Student’s t test; n.s., not significant. (E) Cell lysates were assayed for caspase 1 activation at 24 hpi by immunoblotting. Data shown are representative of three independent experiments; n = 2 samples per group. (F) Cell lysates were assayed for cAMP at 24 hpi. Data represent the mean ± SEM of two independent experiments; n = 4 samples per group; *P < 0.05, **P < 0.01, two-way ANOVA. (G) BMMs were generated from WT, NLRP3−/−, ASC−/−, or caspase-1−/− bone marrow and were infected with A59. Cell supernatants were assayed for IL-1β by ELISA at 24 hpi. Data represent the mean ± SEM of two independent experiments; n = 4 samples per group; **P < 0.01, ***P < 0.001, two-way ANOVA. (H) Six- to eight-week-old DP1−/− mice were treated with anakinra as described in Materials and Methods, infected with MHV, and monitored daily. **P < 0.01, Kaplan–Meier log-rank survival test. ND, not detected.
Fig. 6.
Fig. 6.
Pydc3 inhibits inflammasome function. BMMs from WT, DP1−/−, or IFNAR−/− mice (AH) or MDMs from human blood (IL) were prepared. (A) Pydc3 mRNA levels were measured in BMMs treated with IFN-β or PBS (control) for 48 h. (B) Ifnβ and Pydc3 mRNA levels were measured in A59-infected WT or DP1−/− cells. (C, D, and F) Pydc3 (C and D) and Ifnβ (F) mRNA levels were measured in uninfected WT or DP1−/− BMMs following treatment with BW245C (C and F), forskolin (D and F), or vehicle for 48 h. (E) WT or IFNAR−/− BMMs were treated with BW245C, forskolin, or vehicle, and Pydc3 mRNA levels were quantified using qRT-PCR. (G and H) BMMs were infected with A59 following either siRNA-mediated knockdown in WT BMMs (G) or overexpression of Pydc3 in DP1−/− BMMs (H), and IL1β in cell supernatants was quantified by ELISA. MDMs were generated from human PBMCs as described in Materials and Methods. (IL) Pop3 (I and J) or Ifnβ (K and L) mRNA levels following BW245C treatment (I and K) or forskolin treatment (J and L) were quantified using qRT-PCR. Data shown represent the mean ± SEM of two independent experiments; n = 4 samples per group; **P < 0.01; **P < 0.01; ***P < 0.001, Mann–Whitney U test; n.s., not significant. MDM, monocyte-derived macrophages.

References

    1. Ricciotti E, FitzGerald GA. Prostaglandins and inflammation. Arterioscler Thromb Vasc Biol. 2011;31:986–1000. - PMC - PubMed
    1. von Moltke J, et al. Rapid induction of inflammatory lipid mediators by the inflammasome in vivo. Nature. 2012;490:107–111. - PMC - PubMed
    1. Zoccal KF, et al. Opposing roles of LTB4 and PGE2 in regulating the inflammasome-dependent scorpion venom-induced mortality. Nat Commun. 2016;7:10760. - PMC - PubMed
    1. Maier NK, Leppla SH, Moayeri M. The cyclopentenone prostaglandin 15d-PGJ2 inhibits the NLRP1 and NLRP3 inflammasomes. J Immunol. 2015;194:2776–2785. - PMC - PubMed
    1. Wang X, et al. The prostaglandin E2-EP3 receptor axis regulates Anaplasma phagocytophilum-mediated NLRC4 inflammasome activation. PLoS Pathog. 2016;12:e1005803. - PMC - PubMed

Publication types